What is a biomass and Bioenergy Power Plant Boiler, Turbine & Plant Asset Health Dashboard?
A Biomass and Bioenergy Power Plant Boiler, Turbine & Plant Asset Health Dashboard is a centralized analytics platform designed to monitor the performance, reliability, and efficiency of critical assets in biomass power generation. This dashboard consolidates data from boilers, steam turbines, generators, and auxiliary systems into a single view, enabling plant operators to track asset health, predict maintenance needs, and optimize operational efficiency. By integrating asset health scores, failure rates, lifecycle costs, and maintenance backlogs, the dashboard helps utilities reduce downtime, extend equipment lifespan, and improve energy output. It also provides geographic performance comparisons, allowing operators to benchmark asset reliability across different plants and regions.
How to Create a Biomass and Bioenergy Power Plant Boiler, Turbine & Plant Asset Health Dashboard
You don’t need to build your report from scratch, just start with a ready to use dashboard template from Mokkup. Add in your data and export it however you like. Here’s how to do it:
1. Create or Log in to Your Mokkup Account
Start by signing up on Mokkup.ai using your email. If you already have an account, just log in, and you’ll be good to go.
2. Choose and Customize Your Dashboard Template
Find the Biomass and Bioenergy Power Plant Boiler, Turbine & Plant Asset Health Dashboard template in the Templates section. Use the drag and drop editor to adjust KPIs, edit filters, or add elements based on your data.
3. Export to Your BI Tool
Once your dashboard wireframe is ready, use the BI Tool Export feature to send it directly to Power BI or Tableau for further analysis and enhancements. You can also download the dashboard as a PDF, PNG, or JPEG, embed it on a platform, or invite your team to collaborate.
Note: This is a Pro template. You’ll need a Pro subscription on Mokkup to use and customize this dashboard wireframe. Upgrade anytime to unlock full access.
Biomass and Bioenergy Power Plant Boiler, Turbine & Plant Asset Health Dashboard Example
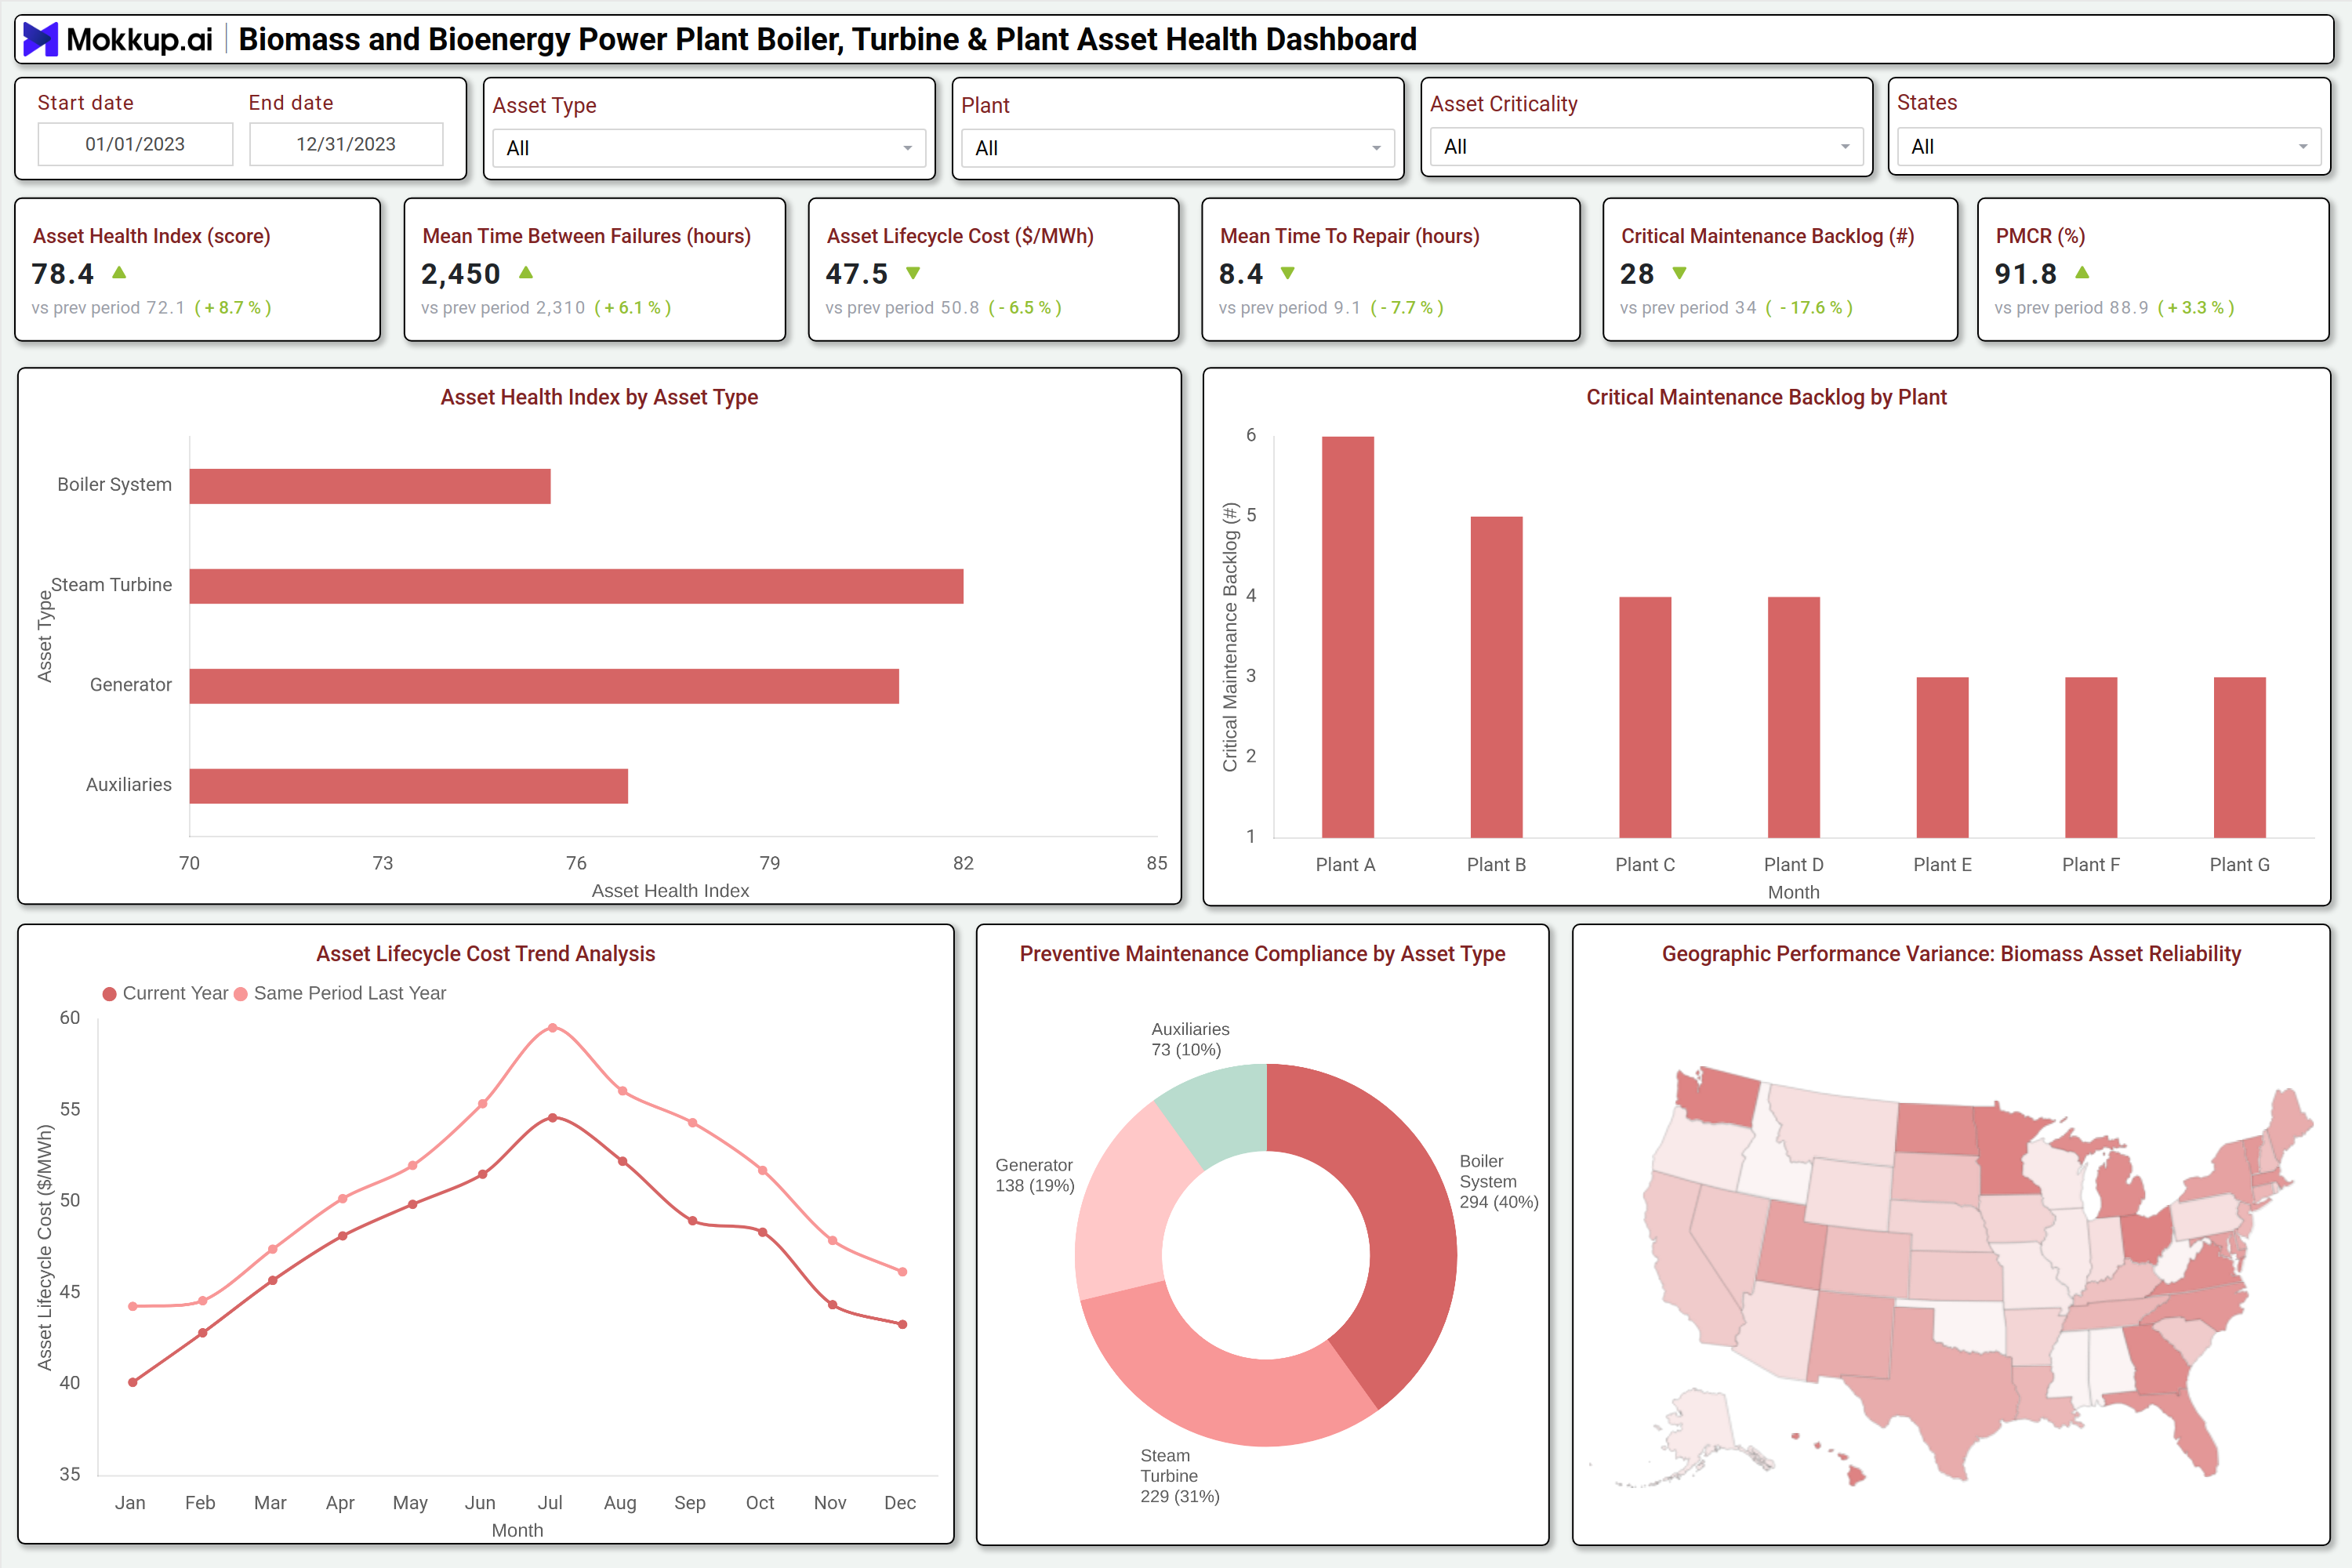
A typical biomass power plant asset health dashboard includes interactive filters for date ranges, asset types, plants, and criticality levels. Key performance tiles display metrics such as the Asset Health Index, Mean Time Between Failures (MTBF), Asset Lifecycle Cost, Mean Time To Repair (MTTR), Critical Maintenance Backlog, and Preventive Maintenance Compliance Rate (PMCR). Trend charts compare current performance against historical data, highlighting improvements or declines in asset reliability. The dashboard also features asset health breakdowns by type (boilers, turbines, generators, auxiliaries), allowing operators to identify underperforming components. A geographic heatmap visualizes asset reliability variances across different regions, while a maintenance backlog chart pinpoints plants with the highest pending critical repairs. Together, these elements provide a comprehensive view of asset health, enabling data-driven maintenance and operational decisions.
How to Analyze Data in a Biomass and Bioenergy Power Plant Boiler, Turbine & Plant Asset Health Dashboard
Here is how you can analyze data from this dashboard:
- Monitor the Asset Health Index to assess overall equipment condition and detect early signs of degradation.
- Track Mean Time Between Failures (MTBF) to evaluate reliability trends and identify recurring failure patterns.
- Analyze Asset Lifecycle Cost ($/MWh) to optimize maintenance spending and improve cost efficiency.
- Review Mean Time To Repair (MTTR) to minimize downtime and enhance repair efficiency.
- Assess Critical Maintenance Backlog to prioritize high-risk repairs and prevent unplanned outages.
- Compare Preventive Maintenance Compliance Rate (PMCR) against targets to ensure scheduled maintenance adherence.
- Examine asset health by type to determine which components (boilers, turbines, generators) require attention.
- Use Geographic Performance Variance to benchmark asset reliability across different plants and regions.
- Evaluate year-over-year trends to measure improvements in asset performance and maintenance efficiency.
Benefits of a Biomass and Bioenergy Power Plant Boiler, Turbine & Plant Asset Health Dashboard
The following are the benefits of using this biomass boiler efficiency optimization tools dashboard:
- Enhance Asset Reliability: Predict potential equipment failures before they occur to improve reliability and avoid unexpected breakdowns.
- Reduce Unplanned Downtime: Use proactive maintenance planning to minimize disruptions and maintain continuous operations.
- Lower Operational Costs: Optimize asset lifecycle management to reduce repair expenses, extend usage, and control maintenance spending.
- Improve Energy Efficiency: Ensure boilers and turbines operate at peak performance to minimize energy waste and improve output.
- Extend Equipment Lifespan: Apply data-driven maintenance strategies that preserve asset health and delay costly replacements.
- Support Regulatory Compliance: Track maintenance activities and safety metrics to meet regulatory standards and audit requirements.
- Enable Cross-Plant Benchmarking: Compare performance across multiple plants to identify best practices and drive continuous improvement.
- Strengthen Capital Investment Decisions: Leverage performance insights to prioritize upgrades and guide long-term capital planning.
KPIs to Track in a Biomass and Bioenergy Power Plant Boiler, Turbine & Plant Asset Health Dashboard
The following key KPIs can be tracked by using this Asset Health Analytics for Biomass Power Generation Plants dashboard:
- Asset Health Index (Score) – Measures overall equipment condition based on sensor data, maintenance history, and failure rates.
- Mean Time Between Failures (MTBF) (Hours) – Indicates the average time between equipment failures, reflecting reliability.
- Asset Lifecycle Cost ($/MWh) – Tracks the total cost of owning and maintaining an asset per megawatt hour of energy produced.
- Mean Time To Repair (MTTR) (Hours) – Measures the average time taken to repair an asset after a failure.
- Critical Maintenance Backlog (counts) – Counts pending high priority maintenance tasks that could lead to unplanned outages.
- Preventive Maintenance Compliance Rate (PMCR) (%) – Shows the percentage of scheduled maintenance tasks completed on time.
Frequently Asked Questions
1. What is a predictive maintenance dashboard for bioenergy plant equipment used for?
It monitors boiler, turbine, and plant equipment performance to prevent failures, optimize maintenance, and improve energy efficiency.
2. What data sources feed into this biomass power plant boiler performance monitoring dashboard?
SCADA systems, CMMS (Computerized Maintenance Management Systems), IoT sensors, and operational logs.
3. Can this Bioenergy turbine health tracking software for utilities predict equipment failures?
Yes, by analyzing trends in asset health, failure rates, and maintenance backlogs.