What is a Bioenergy Power Plant Utilities & Facility Operations Dashboard?
A bioenergy plant utilities dashboard is a centralized analytics interface designed to monitor, manage, and optimize utility systems and facility operations within a bioenergy power plant. It consolidates data from critical infrastructure such as HVAC systems, water supply, compressed air, auxiliary power, fire protection, and facility assets. This dashboard supports bioenergy plant facility management by providing real-time visibility into asset health, maintenance compliance, energy consumption, and system availability. By integrating operational and maintenance metrics, it enables plant teams to maintain uptime, control costs, and ensure safe and compliant operations across all facility areas.
How to Create a Bioenergy Power Plant Utilities & Facility Operations Dashboard
You don’t need to build your report from scratch, just start with a ready-to-use dashboard template from Mokkup. Add in your data and export it however you like. Here’s how to do it:
1. Create or Log in to Your Mokkup Account
Start by signing up on Mokkup.ai using your email. If you already have an account, just log in, and you’ll be good to go.
2. Choose and Customize Your Dashboard Template
Find the Bioenergy Power Plant Utilities & Facility Operations Dashboard template in the Templates section. Use the drag-and-drop editor to adjust KPIs, edit filters, or add elements based on your data.
3. Export to Your BI Tool
Once your dashboard wireframe is ready, use the BI Tool Export feature to send it directly to Power BI or Tableau for further analysis and enhancements. You can also download the dashboard as a PDF, PNG, or JPEG, embed it on a platform, or invite your team to collaborate.
Note: This is a Pro template. You’ll need a Pro subscription on Mokkup to use and customize this dashboard wireframe. Upgrade anytime to unlock full access.
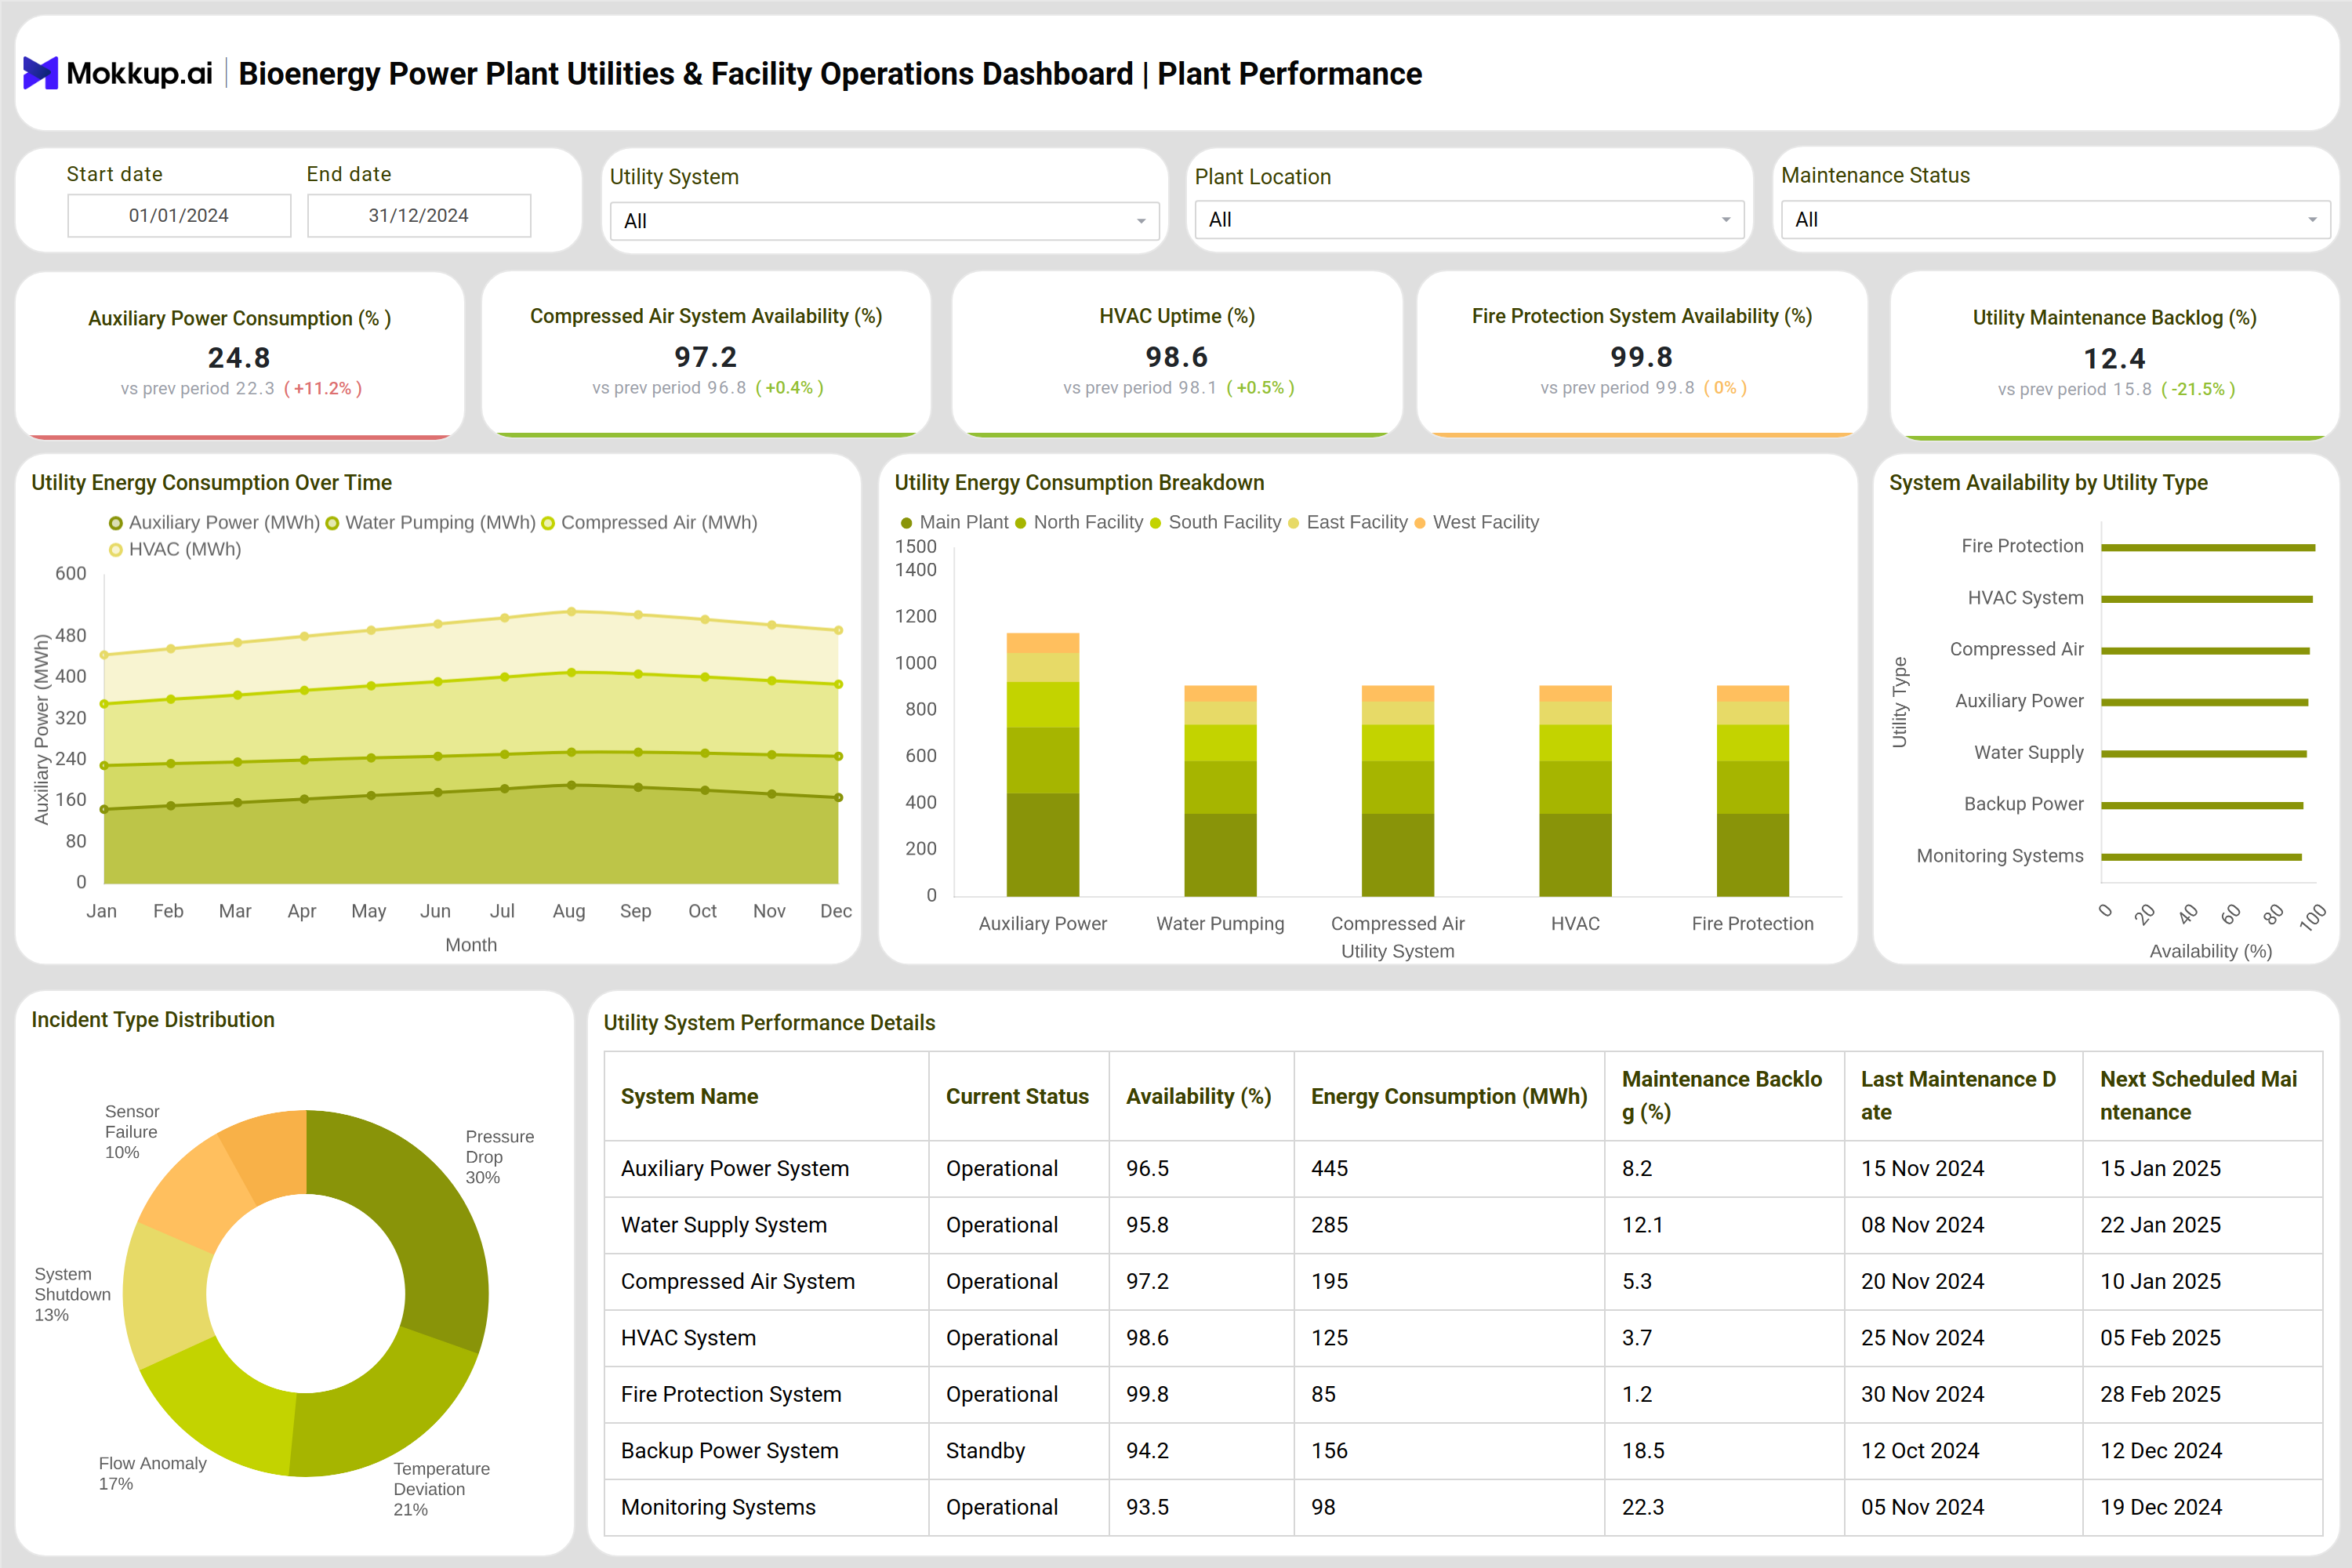
Bioenergy Power Plant Utilities & Facility Operations Dashboard Example
You can build your own Bioenergy Power Plant Utilities & Facility Operations Dashboard to present a comprehensive view of both asset health and plant utility performance. Preventive maintenance compliance, reactive work orders, safety incidents, and regulatory non-compliances are tracked alongside asset condition scores. Facility areas such as buildings, roads, storage yards, offices, and utility rooms are monitored to identify maintenance backlogs and risk zones. On the utilities side, the dashboard highlights auxiliary power consumption, HVAC uptime, compressed air availability, and fire protection system readiness.
Energy consumption trends across different utilities are visualized monthly, allowing operators to identify inefficiencies. System-level tables provide details such as current operational status, availability percentage, energy usage, maintenance backlog, and upcoming service schedules. Together, these views support bioenergy utilities' performance monitoring and ensure reliable facility operations.
How to Analyze Bioenergy Power Plant Utilities & Facility Operations Dashboard
Here is how you can analyze data from this dashboard:
- Review preventive maintenance compliance trends to assess maintenance discipline
- Track reactive maintenance work orders to identify recurring facility issues
- Analyze asset condition distribution to prioritize repair or replacement actions
- Monitor utility system availability to ensure operational continuity
- Compare energy consumption across utilities to identify optimization opportunities
- Evaluate maintenance backlog levels to reduce operational risk
- Review safety incidents and non-compliances for corrective action planning
- Use facility-area work order data to allocate maintenance resources effectively
Benefits of Bioenergy Power Plant Utilities & Facility Operations Dashboard
The following are the benefits of using this dashboard:
- Improves visibility into facility and utility system performance
- Enhances preventive maintenance planning and execution
- Reduces unplanned downtime across critical plant utilities
- Supports data-driven bioenergy plant operations analytics
- Optimizes energy usage across auxiliary systems
- Strengthens safety and regulatory compliance monitoring
- Enables faster response to asset health issues
- Improves coordination between operations and maintenance teams
KPIs to Track in Bioenergy Power Plant Utilities & Facility Operations Dashboard
The following key KPIs can be tracked by using this dashboard:
- Preventive Maintenance Compliance (%) – Measures how consistently scheduled maintenance activities are completed on time.
- Reactive Maintenance Work Orders (count) – Tracks the number of unplanned maintenance tasks triggered by asset failures.
- Average Work Order Closure Time (days) – Indicates the average time taken to resolve and close maintenance requests.
- Facility Safety Incidents (count) – Records the total number of safety-related incidents within the plant facility.
- Regulatory Non-Compliances (count) – Measures the number of facility operations that failed to meet regulatory requirements.
- Asset Condition Distribution – Shows the overall health status of facility assets categorized as good, fair, or poor.
- Utility System Availability (%) – Reflects the percentage of time utility systems are operational and available for use.
- Auxiliary Power Consumption (%) – Tracks the proportion of generated power consumed by auxiliary plant systems.
- HVAC Uptime (%) – Measures the operational availability of HVAC systems supporting plant facilities.
- Utility Maintenance Backlog (%) – Indicates the volume of pending maintenance tasks relative to total maintenance demand.
- Energy Consumption by Utility System – Monitors energy usage across individual utility systems to identify inefficiencies.
Frequently Asked Questions
1. What is the purpose of a bioenergy plant utilities dashboard?
The purpose is to centralize monitoring of facility assets and utility systems, enabling efficient operations, maintenance planning, and energy management.
2. How does this dashboard support facility management?
It supports bioenergy plant facility management by tracking asset health, maintenance compliance, safety incidents, and system availability in one platform.
3. Which utility systems are typically monitored?
Common systems include auxiliary power, HVAC, water supply, compressed air, fire protection, backup power, and monitoring systems.
4. How does it help with energy optimization?
By analyzing energy consumption trends and comparing utility performance, operators can reduce waste and improve efficiency through bioenergy facility utilities monitoring.
5. Is this dashboard useful for compliance reporting?
Yes, it helps track safety incidents, regulatory non-compliances, inspection dates, and corrective actions to maintain compliance.