
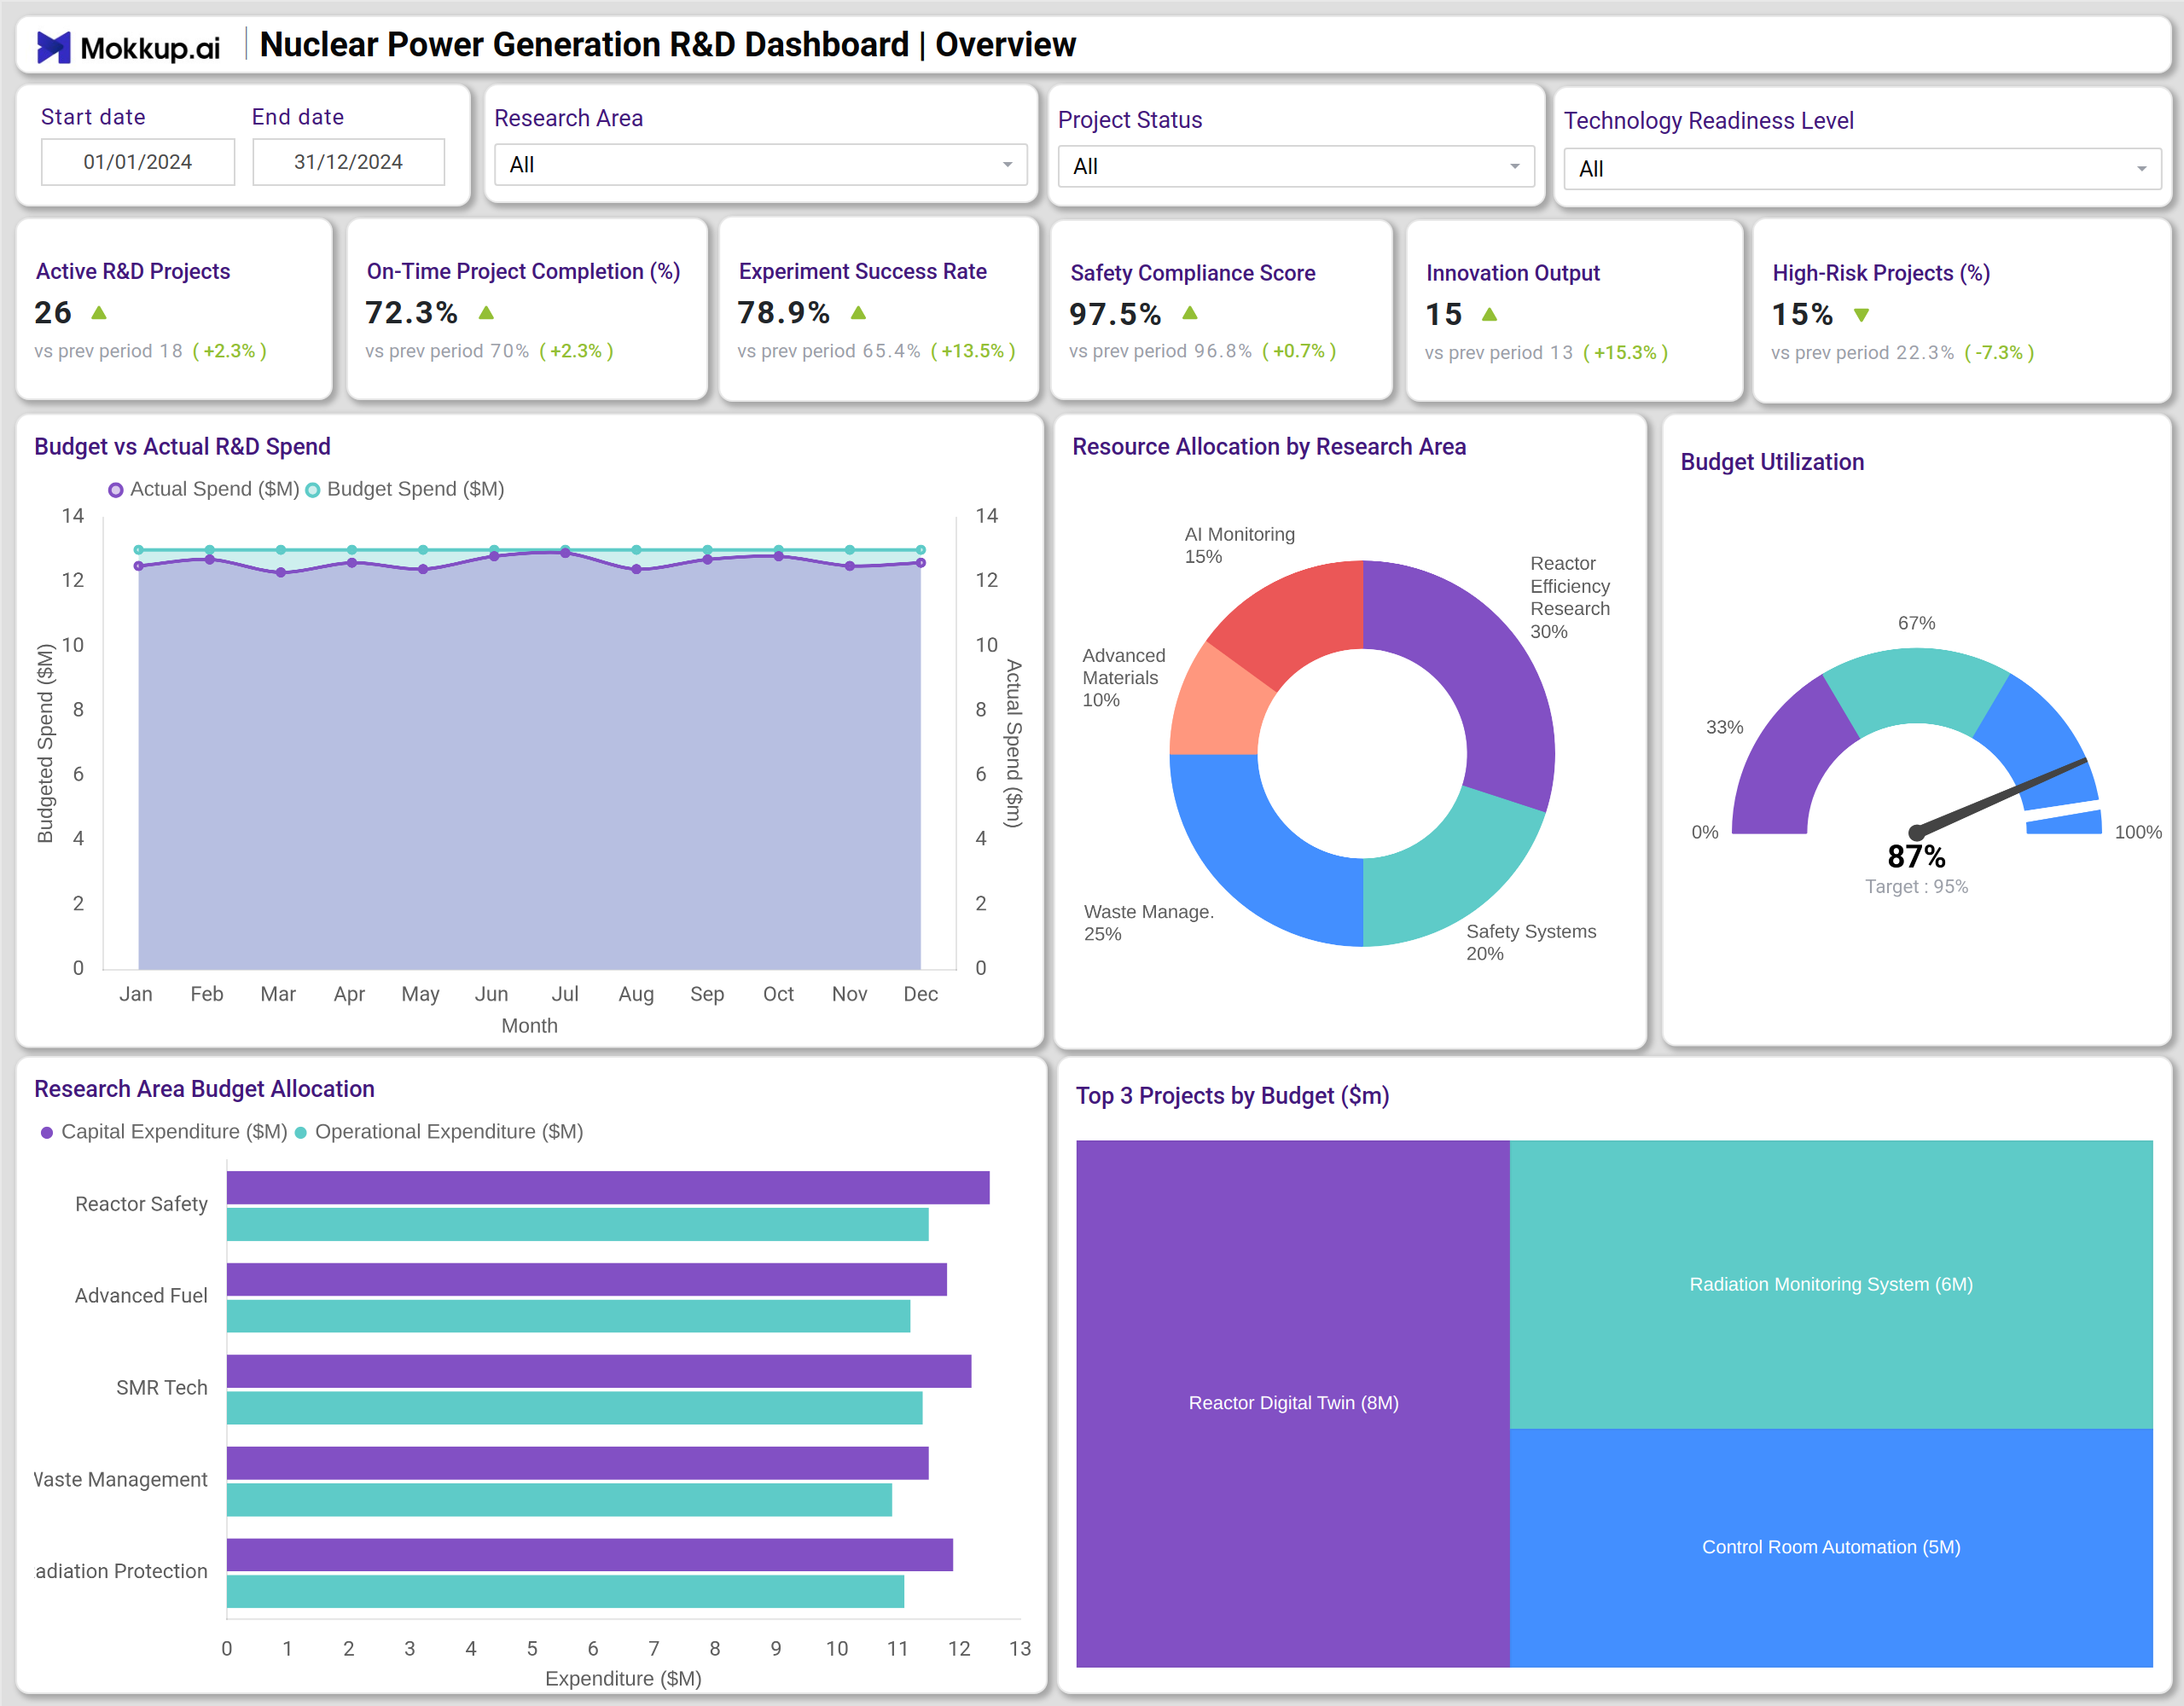
What is a Nuclear Power Generation R&D Dashboard?
A Nuclear Power Generation R&D Dashboard is a centralized performance tracking system that consolidates all critical research and development metrics into one interface. It provides comprehensive nuclear R&D performance tracking by monitoring Technology Readiness Levels (TRL), engineering hours, milestone slippage, experiment success rates, and budget utilization. The dashboard uses project data from various research areas to identify risks early and support efficient, data-driven R&D management. By integrating experiment failure analysis, resource utilization trends, and high-risk project details, the dashboard allows project managers and researchers to make more informed strategic decisions. It also serves as a complete nuclear research development analytics dashboard, offering stakeholders an integrated view of project health, innovation output, safety compliance, and financial performance.
How to Create a Nuclear Power Generation R&D Dashboard
You don’t need to build your report from scratch—just start with a ready-to-use dashboard template from Mokkup. Add in your data and export it however you like. Here’s how to do it:
1. Create or Log in to Your Mokkup Account
Start by signing up on Mokkup.ai using your email. If you already have an account, just log in, and you’ll be good to go.
2. Choose and Customize Your Dashboard Template
Find the Nuclear Power Generation R&D Dashboard template in the Templates section. Use the drag-and-drop editor to adjust KPIs, edit filters, or add elements based on your data.
3. Export to Your BI Tool
Once your dashboard wireframe is ready, use the BI Tool Export feature to send it directly to Power BI or Tableau for further analysis and enhancements. You can also download the dashboard as a PDF, PNG, or JPEG, embed it on a platform, or invite your team to collaborate.
Note: This is a Pro template. You’ll need a Pro subscription on Mokkup to use and customize this dashboard wireframe. Upgrade anytime to unlock full access.
Nuclear Power Generation R&D Dashboard Example
You can create a Nuclear Power Generation R&D Dashboard that visualizes both strategic program health and deep technical project performance using the two dashboards shown above. The Overview dashboard focuses on program-level health, tracking active project counts, on-time completion rates, innovation output, and budget versus actual spend. It also covers research area budget allocation and high-risk project percentages—helping leadership monitor portfolio-wide progress and financial oversight. The Technical Insights dashboard expands this by tracking Technology Readiness Level (TRL) progression, engineering hours utilized, critical milestone slippage, and experiment pass rates. These visualizations offer a complete view of nuclear technology readiness assessment and nuclear experiment performance analytics. Together, these dashboards enable thorough surveillance of research progress, technical complexity, resource efficiency, and risk management—ensuring successful outcomes across the R&D portfolio.
How to Analyze Data in a Nuclear Power Generation R&D Dashboard
Here’s how to break down the key performance signals in a power generation R&D dashboard:
- Monitor the Average Technology Readiness Level (TRL) to gauge the overall maturity of the R&D portfolio.
- Track Engineering Hours Utilized against previous periods to assess team productivity and utlization analytics.
- Review the Critical Milestone Slippage percentage to identify projects facing significant delays.
- Analyze the Experiment Pass Rate to understand the effectiveness and reliability of testing phases.
- Check the Average Complexity Score to see if project challenges are increasing or decreasing over time.
- Examine the Experiment Failure Distribution to pinpoint recurring technical issues, such as material fatigue or cooling anomalies.
- Evaluate Resource Utilization percentages for key labs and facilities to optimize asset allocation.
Benefits of a Nuclear Power Generation R&D Dashboard
- Enables comprehensive tracking of nuclear R&D performance across all projects and research areas.
- Improves strategic decision-making through unified nuclear technology readiness assessment.
- Identifies project risks and bottlenecks early by analyzing milestone slippage and complexity.
- Enhances resource management by monitoring facility and lab utilization rates.
- Strengthens budget control and forecasting with clear visualizations of actual vs. planned spend.
- Reduces operational risk via integrated tracking of high-risk projects and their budget variances.
- Provides a complete nuclear research development analytics dashboard for teams and stakeholders.
KPIs to Track in a Nuclear Power Generation R&D Dashboard
- Active R&D Projects (count) – Tracks the total number of ongoing research initiatives.
- Critical Milestone Slippage (%) – Shows the percentage of key project deadlines that have been delayed.
- Innovation Output (count) – Tracks the number of new patents, designs, or processes developed.
- Safety Compliance Score (%) – Monitors adherence to safety protocols and regulations.
- High-Risk Projects (%) – Shows the proportion of projects classified as high-risk.
- Budget Variance (%) – Compares the difference between actual spend and the original budget for projects and calculates the cost & profitability.
- Resource Utilization (%) – Measures the usage rate of critical testing facilities and labs.
- Reactor Simulation Accuracy (%) – Tracks the precision and reliability of reactor simulation models.
Frequently Asked Questions
1. Why is an R&D dashboard important in nuclear power generation?
It centralizes key research metrics such as technology readiness, experiment success, and project timelines to ensure efficient and progressive development.
2. Can this dashboard help identify failing projects early?
Yes, it helps identify potential issues through trends in milestone slippage, budget variance, and low experiment pass rates.
3. Does it support portfolio management and reporting?
Yes, the dashboard includes overviews of project status, risk categories, and budget allocation, which are essential for stakeholder reports.