
What is an Oil Fired Power Plant Project Management Dashboard?
An Oil Fired Power Plant Project Management Dashboard is a structured visual platform designed to monitor and manage the performance, progress, and risks associated with constructing and commissioning an oil-fired power facility. It consolidates key project metrics such as schedule variance, milestone completion, workforce productivity, contractor performance, and safety into a unified view. By integrating oil-fired power plant project tracking, construction milestone monitoring, and contractor performance evaluation, the dashboard enables project managers to maintain control over timelines, resources, and quality. It serves as a central tool for tracking progress against plans, identifying delays, evaluating contractor efficiency, and ensuring that high-risk issues are proactively addressed.
How to Create an Oil Fired Power Plant Project Management Dashboard
You don’t need to build your report from scratch—just start with a ready-to-use dashboard template from Mokkup. Add in your data and export it however you like. Here’s how to do it:
1. Create or Log in to Your Mokkup Account
Start by signing up on Mokkup.ai using your email. If you already have an account, just log in, and you’ll be good to go.
2. Choose and Customize Your Dashboard Template
Find the Oil Fired Power Plant Project Management Dashboard template in the Templates section. Use the drag-and-drop editor to adjust KPIs, edit filters, or add elements based on your data.
3. Export to Your BI Tool
Once your dashboard wireframe is ready, use the BI Tool Export feature to send it directly to Power BI or Tableau for further analysis and enhancements. You can also download the dashboard as a PDF, PNG, or JPEG, embed it on a platform, or invite your team to collaborate.
Note: This is a Pro template. You’ll need a Pro subscription on Mokkup to use and customize this dashboard wireframe. Upgrade anytime to unlock full access.
Oil Fired Power Plant Project Management Dashboard Example
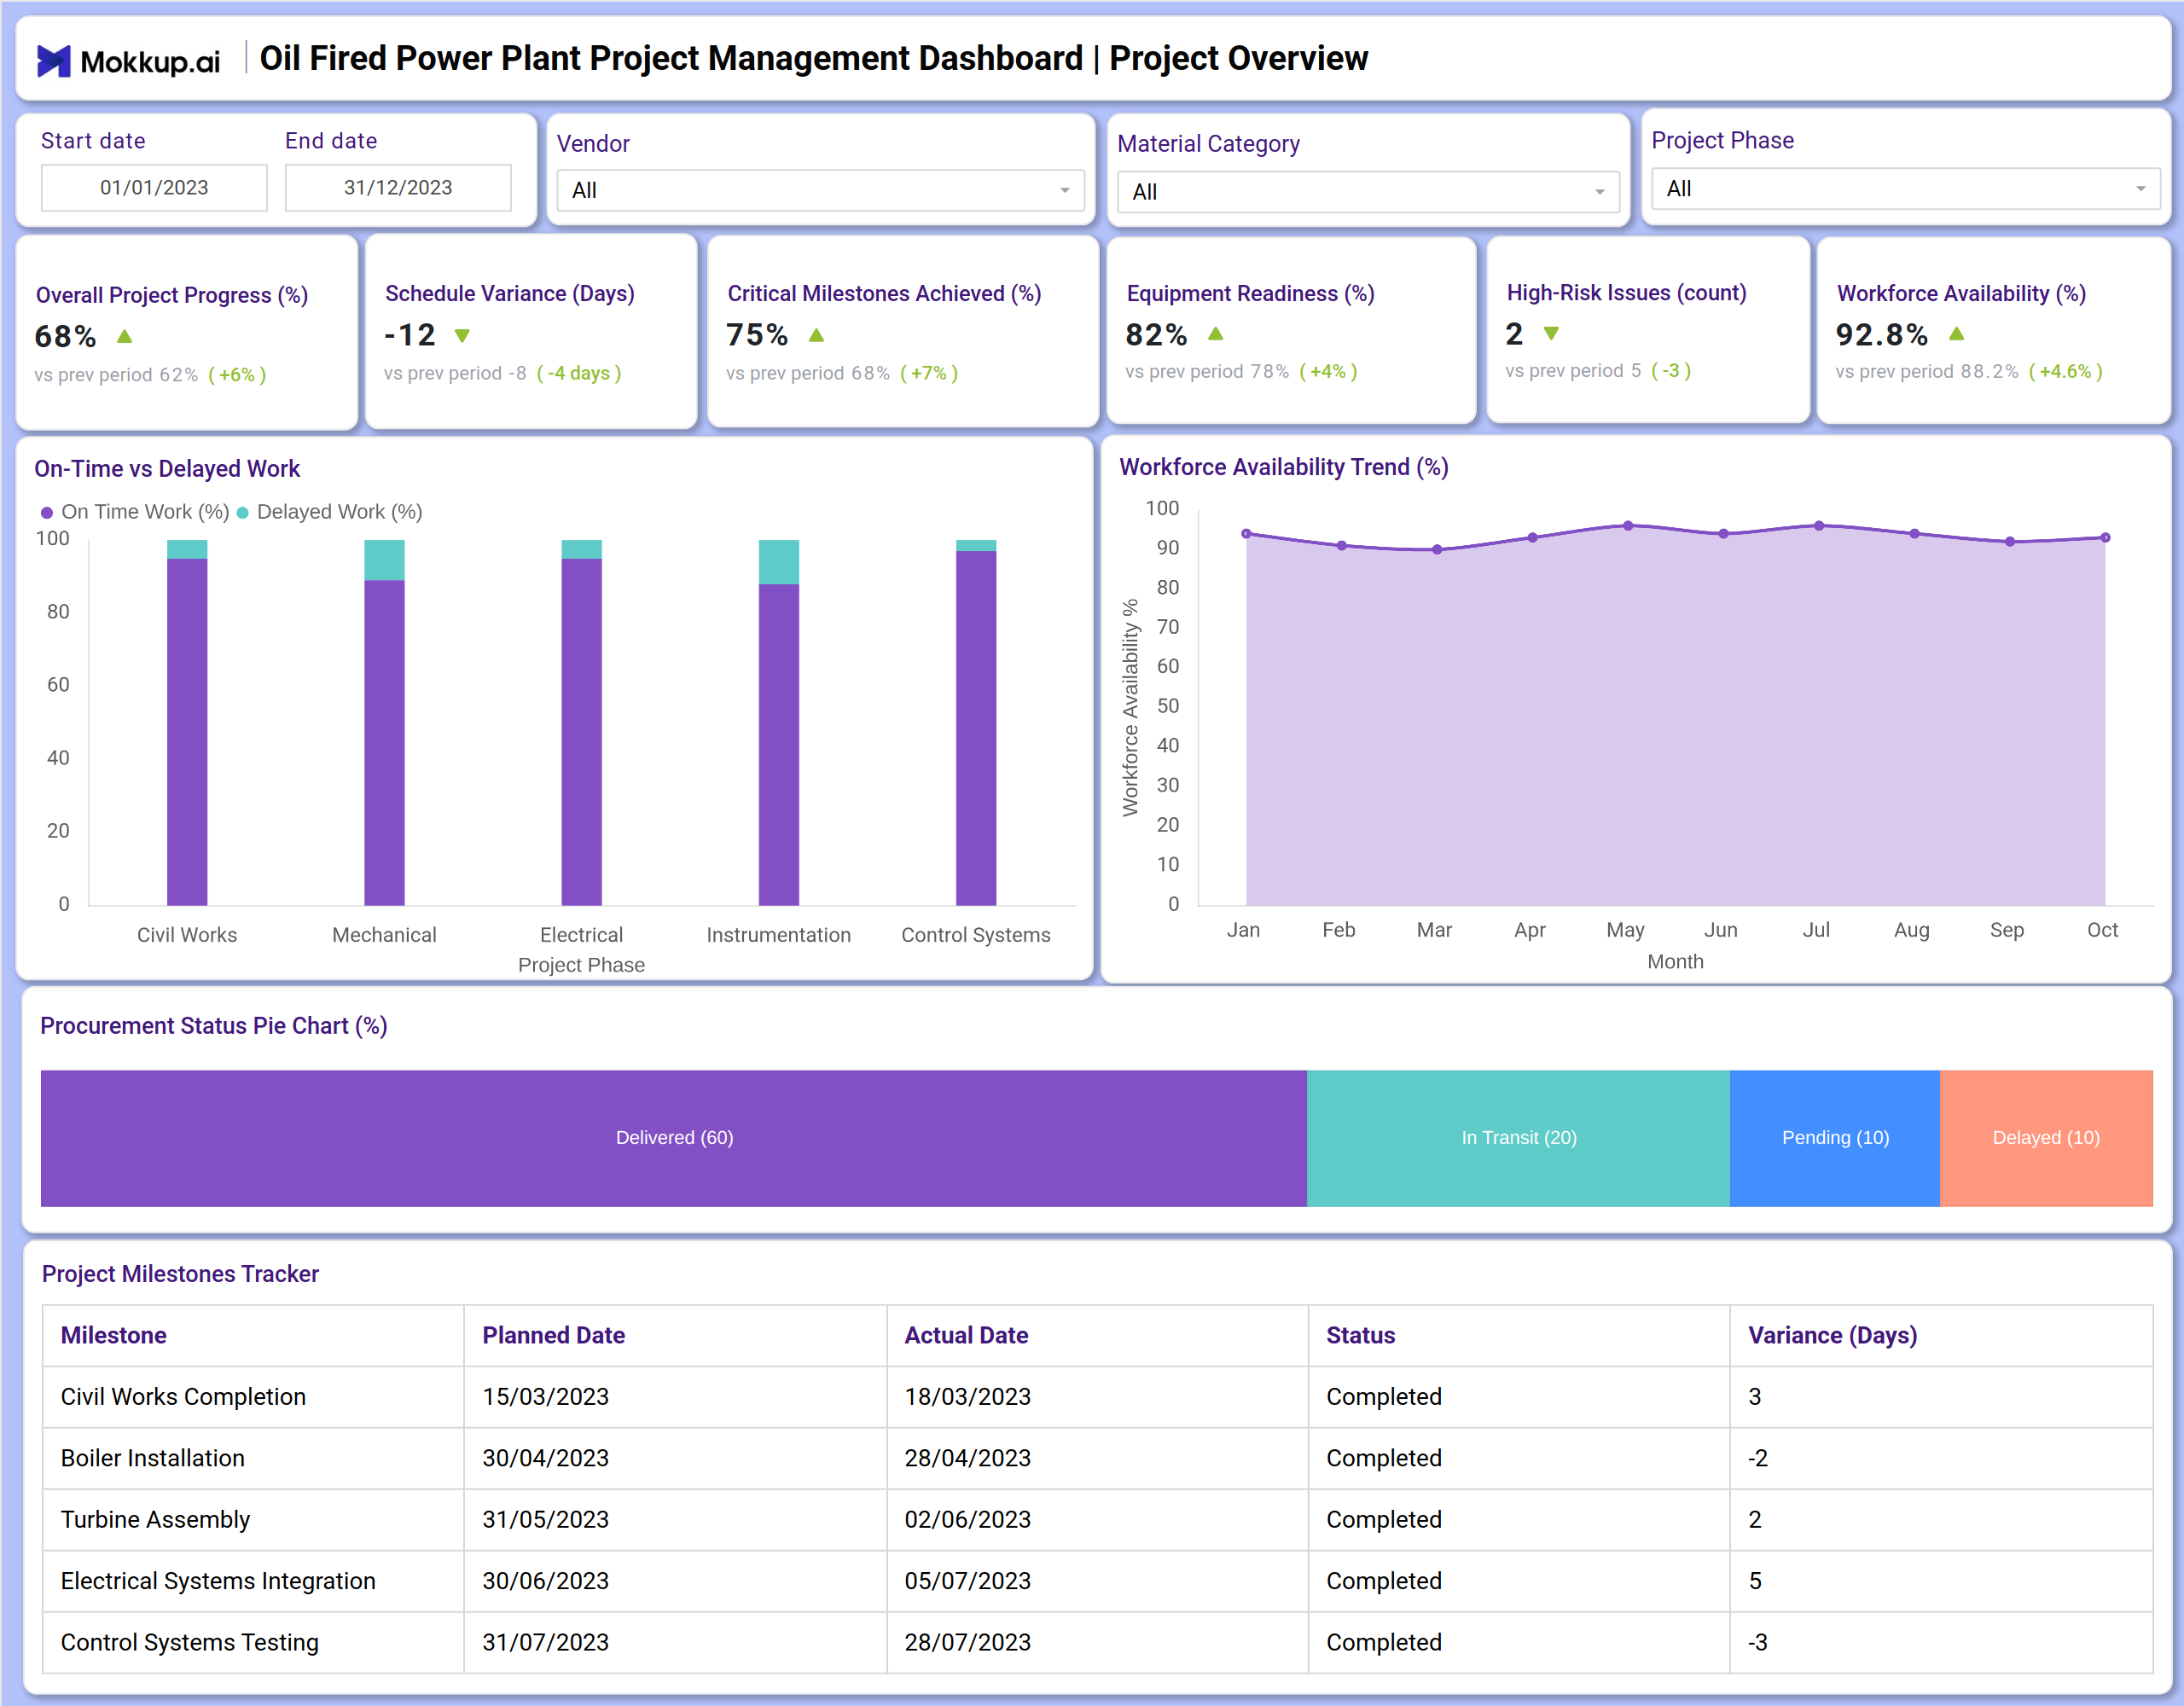
You can create an Oil Fired Power Plant Project Management Dashboard that brings together project overview and detailed performance tracking into a unified view. A typical dashboard includes the Project Overview section, where users can track overall project progress, schedule variance, critical milestones, equipment readiness, and high-risk issues. Visual charts help analyze workforce availability trends, on-time vs delayed work, and procurement status across months. The Detailed Performance Tracking dashboard builds on this by displaying average delay days, workforce productivity, equipment delivery times, change orders, safety incidents, and contractor performance scores. A detailed table logs contractor on-time delivery, quality scores, and safety ratings, while charts illustrate schedule adherence by phase and commissioning readiness. Together, these modules deliver crucial power plant construction KPIs that help project managers ensure timely completion, manage contractor relationships, and maintain safety and quality standards.
How to Analyze Data in Oil Fired Power Plant Project Management Dashboard
Here is how you can analyze data from this dashboard:
- Monitor Overall Project Progress (%) to gauge how much of the project has been completed against the plan.
- Track Schedule Variance (Days) to identify delays and understand their impact on the project timeline.
- Review Critical Milestones Achieved (%) to ensure key project phases are completed as scheduled.
- Assess Equipment Readiness (%) to verify that machinery and systems are available for installation and commissioning.
- Monitor High-Risk Issues (count) to address potential threats to project success proactively.
- Evaluate Workforce Availability (%) to ensure adequate staffing levels across project phases.
- Analyze Workforce Productivity (%) to measure the efficiency of labor resources.
- Track Equipment Delivery (days) to manage supply chain and logistics performance.
- Review Change Orders (count) to monitor scope changes and their impact on the project.
- Monitor Safety Incidents (count) to uphold workplace safety and compliance.
- Assess Contractor Performance Score to evaluate contractor efficiency and adherence to agreements.
- Scrutinize Schedule Adherence by Phase (%) to identify lagging areas needing intervention.
- Review Commissioning Readiness (%) to prepare for the final testing and handover phase.
Benefits of Oil Fired Power Plant Project Management Dashboard
The following are the benefits of using this dashboard:
- Provides centralized visibility into project progress, risks, and performance across all phases.
- Supports oil-fired power plant project tracking for timely decision-making and reporting.
- Improves schedule adherence and reduces delays through proactive variance monitoring.
- Enhances contractor management with clear contractor performance evaluation metrics.
- Increases workforce efficiency by tracking availability and productivity trends.
- Strengthens safety oversight with incident tracking and contractor safety ratings.
- Reduces manual reporting effort with consolidated project data visualization.
- Ensures readiness for stakeholder reviews with organized milestone and performance records.
KPIs to Track in Oil Fired Power Plant Project Management Dashboard
The following key KPIs can be tracked by using this dashboard:
- Overall Project Progress (%): The percentage of total project work completed against the planned scope.
- Schedule Variance (Days): The difference between the planned and actual project timeline, indicating delays or early completion.
- Critical Milestones Achieved (%): The proportion of key project milestones completed on or before their due dates.
- Equipment Readiness (%): The percentage of required equipment that is available and ready for installation or use.
- High-Risk Issues (count): The number of identified risks that could significantly impact project cost, timeline, or quality.
- Workforce Availability (%): The percentage of planned labor resources that are present and assigned to the project.
- Workforce Productivity (%): The efficiency of the workforce is measured as output against expected performance.
- Equipment Delivery (days): The average time taken for critical equipment to be delivered to the site.
- Change Orders (count): The number of approved modifications to the original project scope or specifications.
- Safety Incidents (count): The total number of safety-related events or accidents recorded on site.
Frequently Asked Questions
1. What is the purpose of an oil-fired power plant project dashboard?
It helps project managers track progress, monitor delays, evaluate contractors, and manage risks throughout the construction and commissioning phases of the project.
2. Can the dashboard help in contractor evaluation?
Yes. It provides metrics such as on-time delivery, quality scores, and safety ratings for objective evaluation of contractor performance.
3. How does the dashboard improve project delivery?
By offering clear visibility into schedule variance, milestone completion, and high-risk issues, it enables proactive management and timely interventions.
4. Who uses this dashboard?
Project managers, site engineers, construction supervisors, contract managers, safety officers, and project stakeholders.