
What is a B2B LNG Customer Performance Dashboard?
The B2B LNG Customer Performance Dashboard gives gas trading teams, contract managers, and commercial analysts a consolidated view of how large industrial and utility customers are performing against their supply agreements. Covering everything from SLA compliance and LNG contract volume delivery tracking to invoice accuracy and take-or-pay obligations, this dashboard surfaces contract risk early and highlights where revenue and margin are under pressure. Built for B2B energy suppliers serving utility-scale, industrial, and municipal customers, it provides a single source of truth for commercial performance across all accounts. Aggregating data across customer segments and geographic regions, it helps commercial teams move from reactive reporting to proactive account management.
How to Create a B2B LNG Customer Performance Dashboard
You don't need to build your report from scratch, just start with a ready-to-use dashboard template from Mokkup. Add in your data and export it however you like. Here's how to do it:
1. Create or Log in to Your Mokkup Account
Start by signing up on Mokkup.ai using your email. If you already have an account, just log in, and you'll be good to go.
2. Choose and Customize Your Dashboard Template
Find the B2B LNG Customer Performance Dashboard template in the Templates section. Use the drag-and-drop editor to adjust KPIs, edit filters, or add elements based on your data.
3. Export to Your BI Tool
Once your dashboard wireframe is ready, use the BI Tool Export feature to send it directly to Power BI or Tableau for further analysis and enhancements. You can also download the dashboard as a PDF, PNG, or JPEG, embed it on a platform, or invite your team to collaborate.
Note: This is a Pro template. You'll need a Pro subscription on Mokkup to use and customize this dashboard wireframe. Upgrade anytime to unlock full access.
B2B LNG Customer Performance Dashboard Example
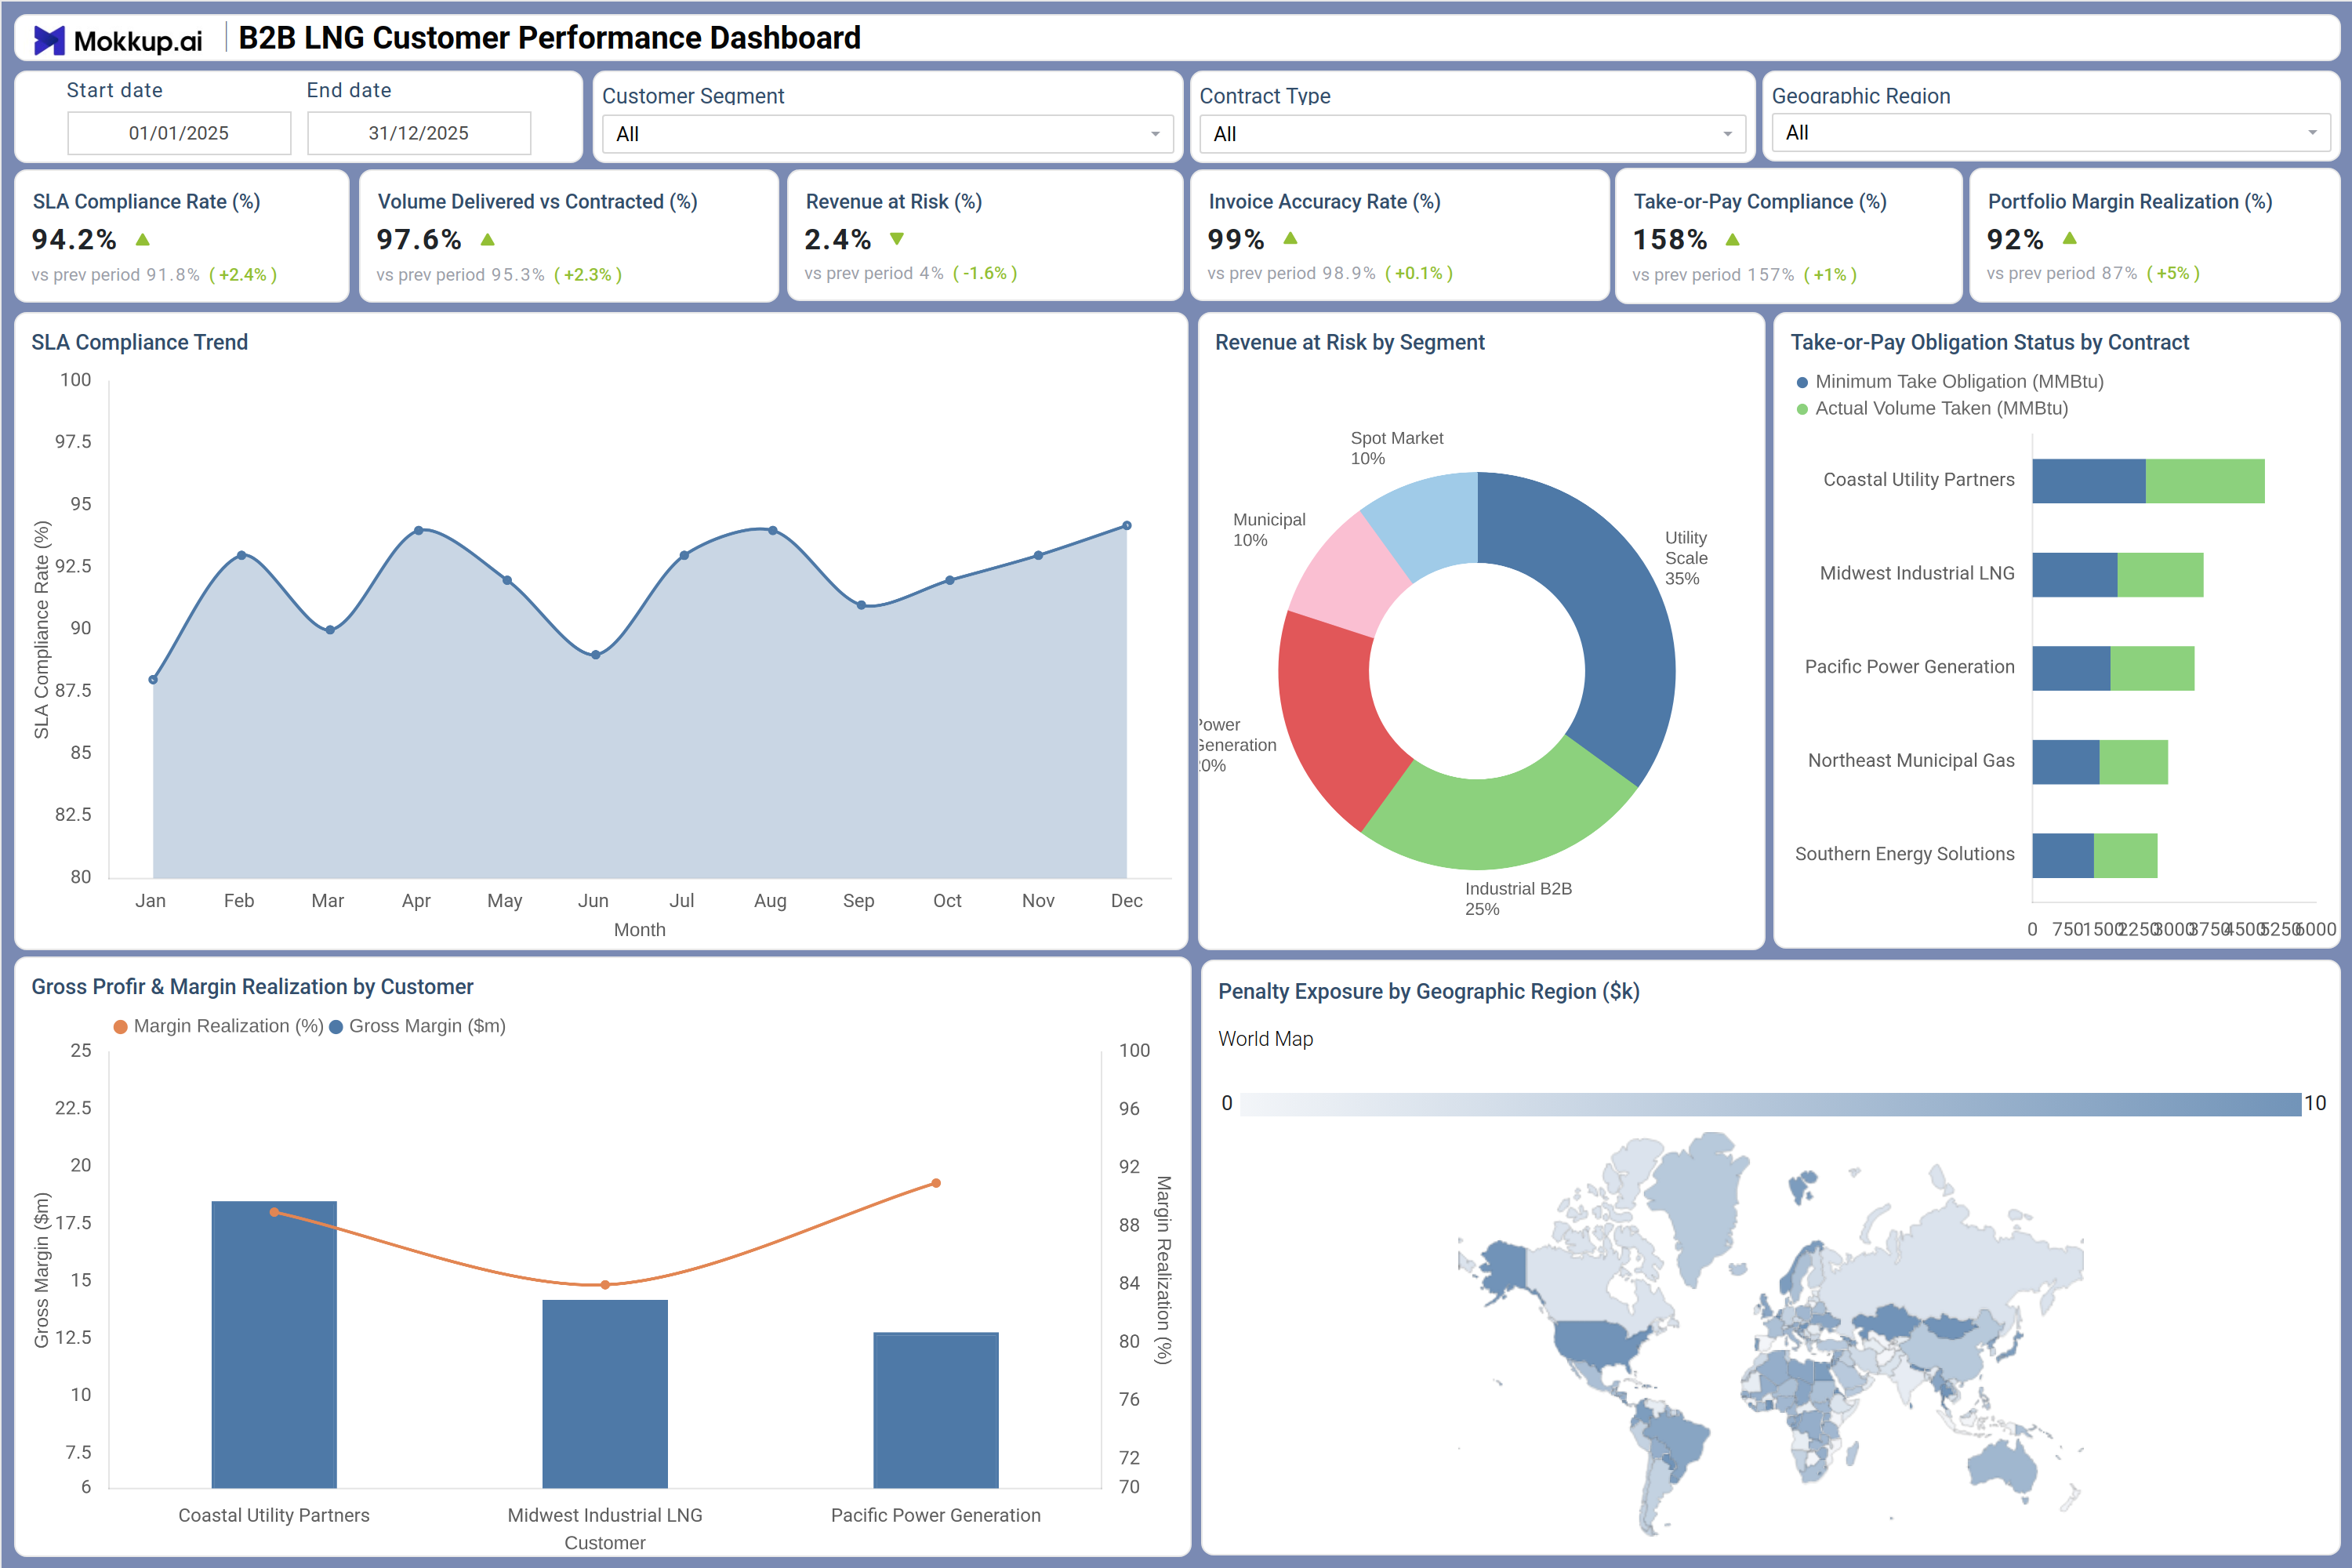
A commercial account manager opens this dashboard at the start of the week to assess how well the supply portfolio is meeting contracted obligations across the customer base. The top-level KPI row immediately signals whether SLA compliance is holding across segments and whether invoice accuracy is in line with contractual expectations, giving teams a fast pulse check before diving deeper. The Revenue at Risk by Segment view then helps managers understand which customer categories are driving the most exposure, allowing them to prioritize conversations with the highest-risk accounts before penalties are triggered. As the team shifts attention to individual contract performance, the Take-or-Pay Obligation Status by Contract chart makes LNG take-or-pay compliance monitoring straightforward — planners can immediately see which customers are drawing below their minimum volume commitments and quantify the potential financial impact. This view is particularly valuable for commercial leads who need to prepare for quarterly customer reviews with clear, data-backed talking points.
The Gross Profit and Margin Realization by Customer chart gives finance and commercial teams a joint view of which accounts are generating the strongest margins and which are underperforming relative to contracted rates. Rather than reviewing spreadsheets or disparate reports, teams can spot underperforming accounts directly on screen and escalate decisions to account managers. Finally, the Penalty Exposure by Geographic Region map helps regional teams understand where contractual risk is concentrated and where proactive account intervention is most needed.
How to Analyze Data in a B2B LNG Customer Performance Dashboard
Here is how you can analyze data from this dashboard:
- Use the Customer Segment filter to isolate performance data for Utility Scale, Industrial B2B, or municipal customers.
- Review the SLA Compliance Trend chart to spot seasonal dips in delivery performance before they trigger contractual penalties.
- Monitor the Revenue at Risk by Segment donut chart to understand which segments carry the highest revenue exposure.
- Analyze the Take-or-Pay Obligation Status by Contract chart to identify customers drawing below minimum volume commitments and model LNG portfolio margin realization tracking implications.
- Compare the Gross Profit and Margin Realization by Customer chart to find accounts where margin realization is declining despite stable gross profit.
- Filter by Contract Type to assess performance differences between fixed-term and spot market agreements.
- Use the Geographic Region filter to align Penalty Exposure by Geographic Region data with specific regional operations teams.
- Track Volume Delivered vs Contracted over time to assess consistency in LNG contract volume delivery tracking and flag accounts at risk of shortfall.
Benefits of a B2B LNG Customer Performance Dashboard
The following are the benefits of using this dashboard:
- Centralizes SLA compliance, take-or-pay obligations, and margin realization metrics across B2B LNG customer accounts in one structured template.
- Supports take-or-pay compliance monitoring for LNG teams with a dedicated contract obligation chart covering all major customer accounts.
- Reduces manual data compilation for quarterly customer performance reviews with pre-built KPI tiles and chart layouts.
- Enables geographic-level analysis of revenue-at-risk LNG contracts to guide regional account management and intervention decisions.
- Provides a combined bar and line breakdown of gross profit and margin realization by customer for operational efficiency planning.
- Helps commercial account teams align customer delivery performance with contract terms across all segments without rebuilding reports from scratch.
- Gives finance leaders and commercial managers a shared view of portfolio margin and delivery performance across the full customer base.
KPIs to Track in a B2B LNG Customer Performance Dashboard
The following key KPIs can be tracked by using this dashboard:
- SLA Compliance Rate (%): Central to any SLA compliance rate LNG dashboard — measures the percentage of service level agreements met across all active B2B accounts and signals where delivery reliability is at risk.
- Volume Delivered vs Contracted (%): Tracks how closely actual delivery volumes match contracted commitments — a core indicator of supply chain reliability and fulfillment consistency.
- Revenue at Risk (%): Quantifies the share of total revenue exposed to contractual penalties or shortfalls — directly tied to LNG portfolio margin realization tracking and financial forecasting.
- Invoice Accuracy Rate (%): Measures billing precision against contracted terms — key to revenue at risk LNG contracts analysis and reducing customer dispute resolution time.
- Take-or-Pay Compliance (%): Evaluates whether customers are meeting their minimum volume take obligations against contracted thresholds — supporting proactive account management workflows.
- Portfolio Margin Realization (%): Tracks actual margin achieved versus targeted margin across all customer contracts, segments, and geographic regions.
Frequently Asked Questions
1. What teams use a B2B LNG Customer Performance Dashboard?
Commercial account managers, contract compliance teams, finance analysts, and regional operations leads all benefit from this dashboard. It provides a unified view of customer obligations and financial performance that spans both strategic and operational roles within a gas supply organization.
2. How does this dashboard improve contract compliance monitoring?
The Take-or-Pay Obligation Status by Contract chart lets teams see which customers are underperforming against their minimum volume commitments. Combined with the SLA Compliance Trend chart, managers can proactively engage accounts before contractual thresholds are breached and penalties are incurred.
3. Can this dashboard track penalty exposure by region?
Yes. The Penalty Exposure by Geographic Region map provides a visual breakdown of financial risk concentration across geographies, enabling regional managers to prioritize their outreach based on actual exposure levels rather than assumptions.
4. How does the Revenue at Risk by Segment chart work?
The Revenue at Risk by Segment donut chart breaks total revenue exposure down by customer segment, Utility Scale, Industrial B2B, Municipal, and Spot Market. It shows which segments are contributing most to overall risk, helping commercial teams decide where to focus revenue protection efforts.
5. What does Portfolio Margin Realization measure?
Portfolio Margin Realization (%) captures how much of the expected margin is actually being achieved across the full book of customer contracts. An SLA compliance rate LNG dashboard that also tracks margin realization helps leadership confirm whether strong delivery metrics are translating into profitable customer outcomes.