
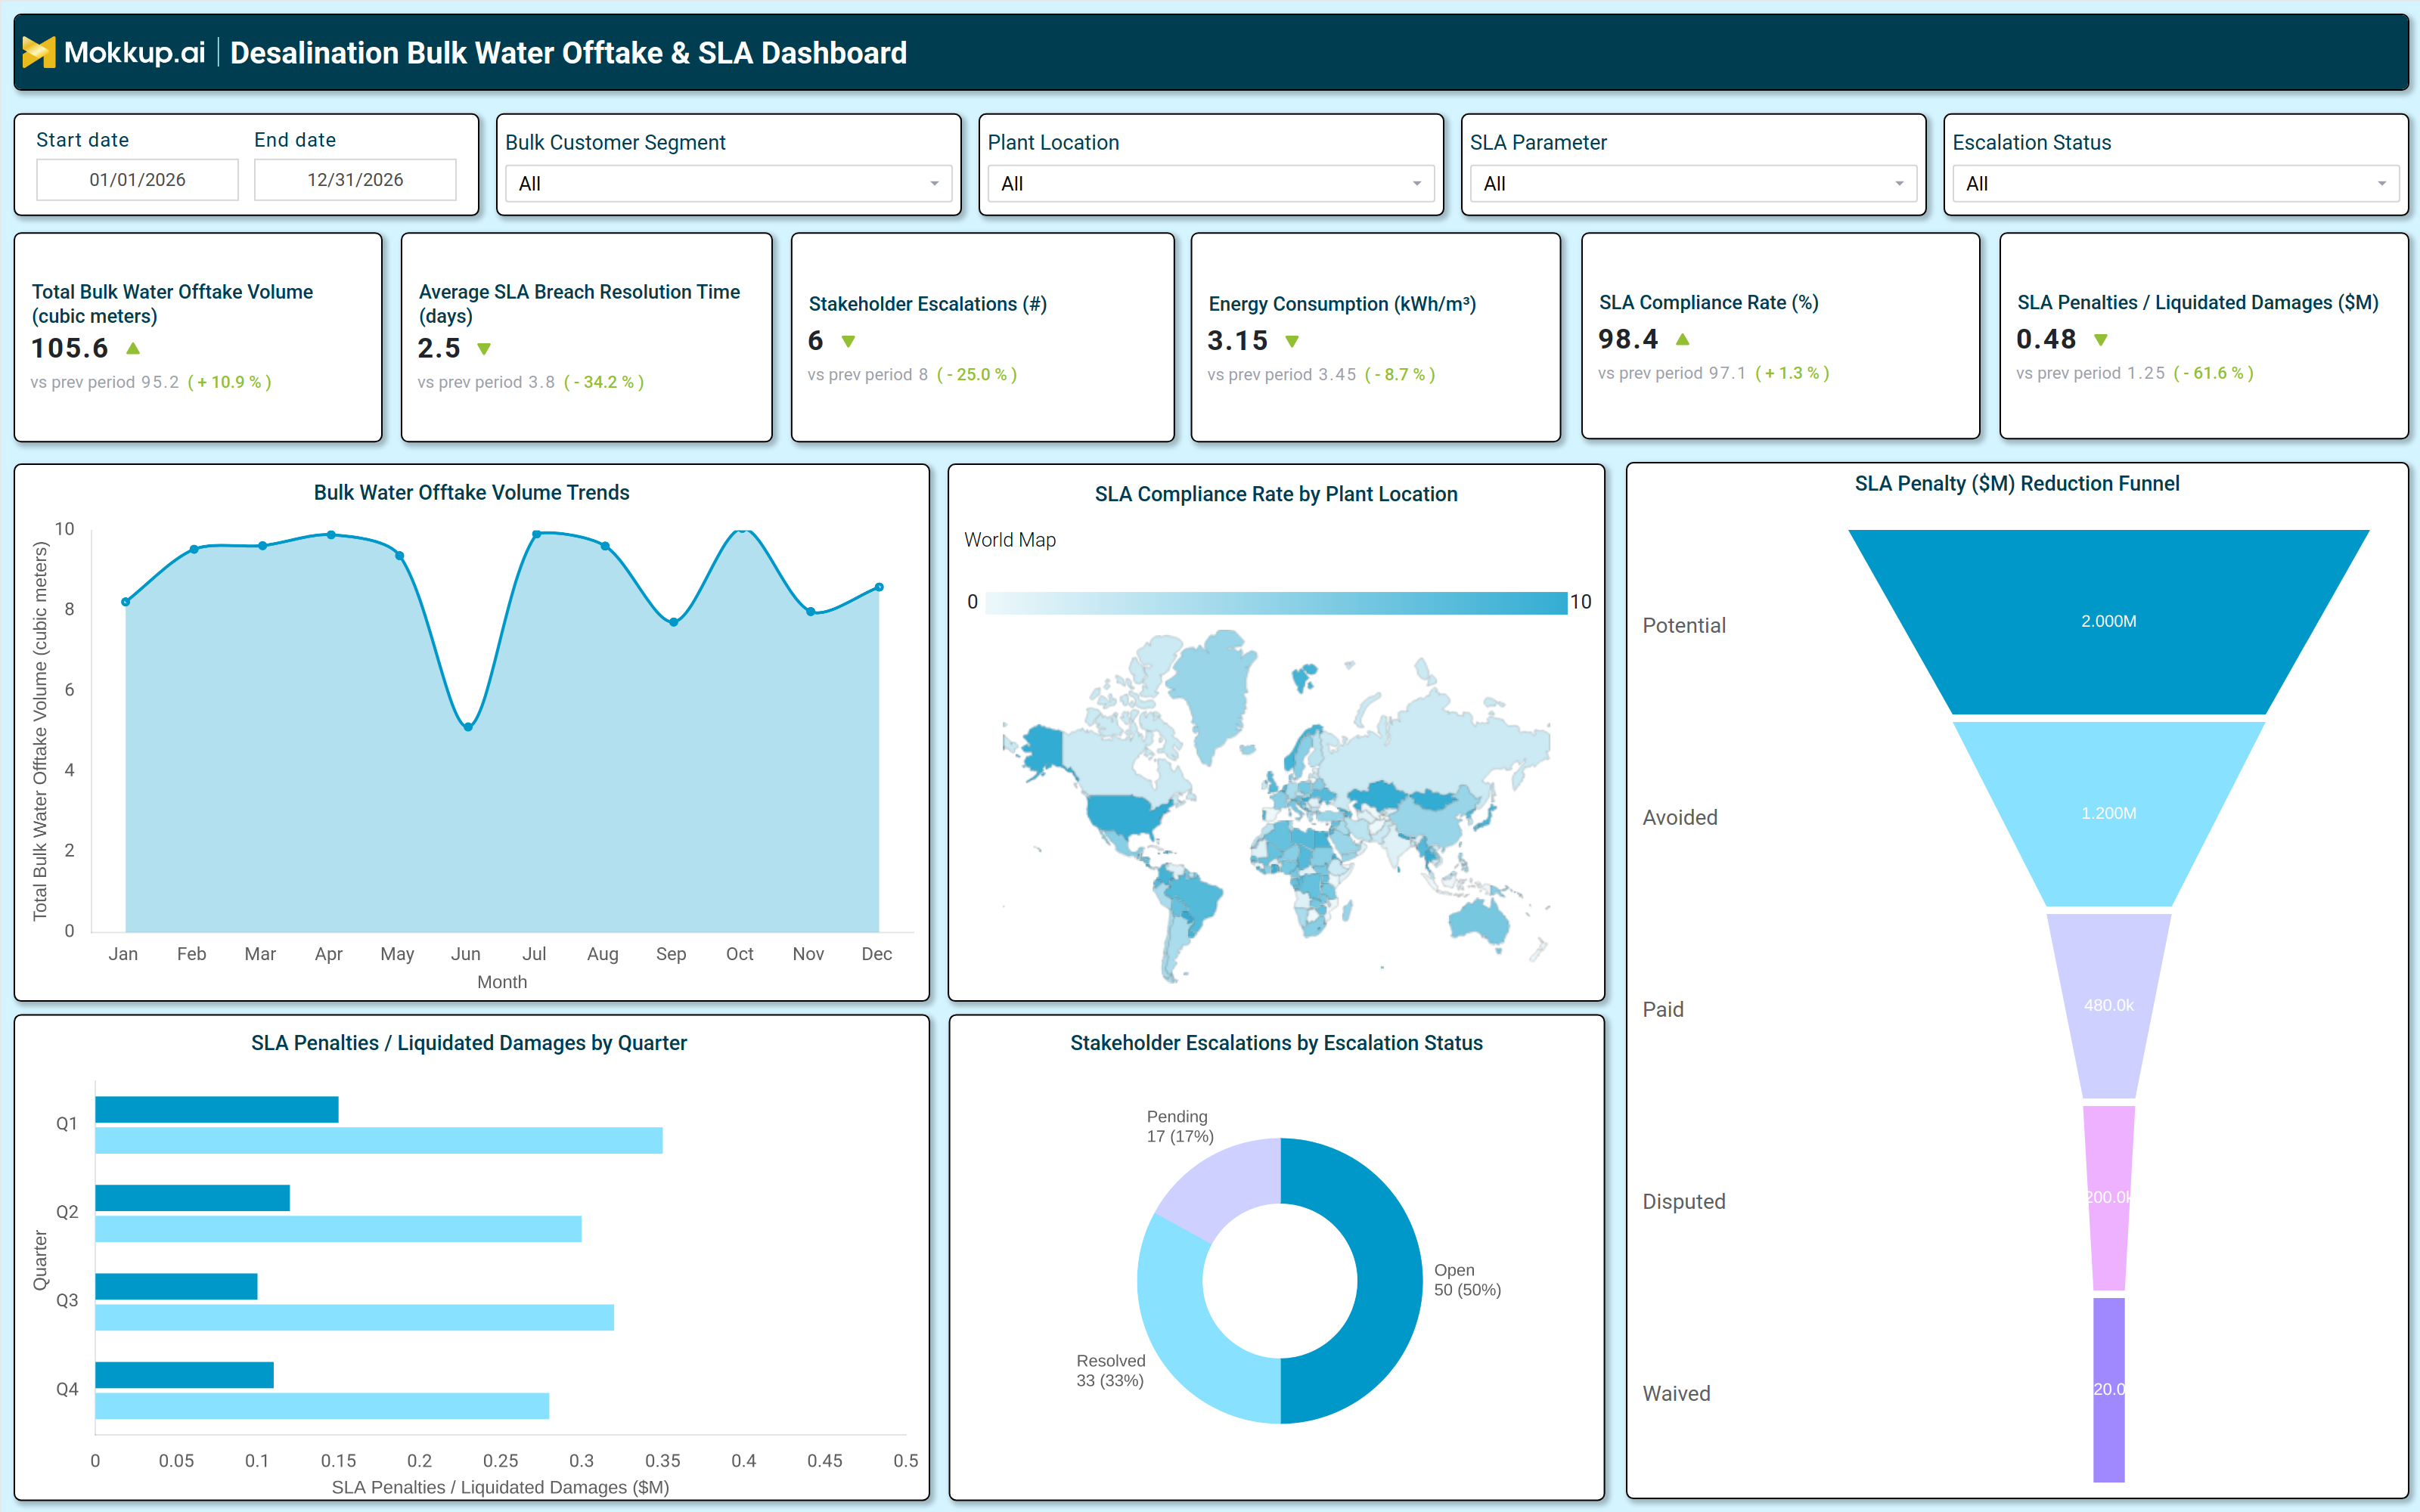
What is a Desalination Bulk Water Offtake & SLA Dashboard?
The Desalination Bulk Water Offtake & SLA Dashboard is an analytics tool for water utility operators, offtake contract managers, and plant performance teams who need a complete view of bulk water offtake dashboard metrics in one place. It tracks total delivery volumes, SLA compliance rates, energy efficiency, stakeholder escalations, and SLA penalty liquidated damages exposure across all customer segments and plant locations.
By consolidating these operational and contractual signals together, the dashboard enables teams to detect compliance risks early and respond before minor breaches become significant financial obligations. Whether managing a single desalination facility or a multisite supply network, users gain the structured visibility needed to protect offtake agreements and maintain performance standards.
How to Create a Desalination Bulk Water Offtake & SLA Dashboard
You don't need to build your report from scratch—just start with a ready-to-use Desalination Bulk Water Offtake & SLA Dashboard template from Mokkup. Add in your data and export it however you like. Here’s how to do it:
1. Create or Log in to Your Mokkup Account
Start by signing up on Mokkup.ai using your email. If you already have an account, just log in, and you'll be good to go.
2. Choose and Customize Your Dashboard Template
Find the Desalination Bulk Water Offtake & SLA Dashboard template in the Templates section. Use the drag and drop editor to adjust KPIs, edit filters, or add elements based on your data.
3. Export to Your BI Tool
Once your dashboard wireframe is ready, use the BI Tool Export feature to send it directly to Power BI or Tableau for further analysis and enhancements. You can also download the dashboard as a PDF, PNG, or JPEG, embed it on a platform, or invite your team to collaborate.
Note: This is a Pro template. You'll need a Pro subscription on Mokkup to use and customize this dashboard wireframe. Upgrade anytime to unlock full access.
Desalination Bulk Water Offtake & SLA Dashboard Example
A bulk water operations manager typically opens this dashboard at the start of a review period to assess whether contracted delivery volumes are tracking on target and whether the overall desalination SLA compliance rate is holding within acceptable thresholds. The plant location map gives an immediate geographic snapshot of where compliance performance is strongest and where specific facilities may be drifting toward breach territory. Rather than waiting for a formal audit, teams can identify at risk locations and initiate corrective conversations with plant operators weeks before a breach is formally recorded.
As the review deepens, contract managers turn their attention to the escalation landscape examining how many stakeholder escalations are still open or pending compared to those fully resolved. This distinction matters because unresolved escalations often signal brewing disputes that will eventually convert into penalties. For teams focused on water utility SLA breach resolution, this view serves as a daily pulse check, ensuring that breach timelines are not quietly exceeding contractual tolerance windows while teams are occupied with other priorities. At the executive and commercial level, the penalty reduction funnel reframes the compliance story as a financial management narrative. Leadership can see how much potential penalty exposure has been avoided through proactive action, how much has been paid, and what remains in disputed or waived status. Quarterly penalty trends add a forward-looking dimension, helping finance teams forecast liability and adjust risk reserves accordingly.
How to Analyze Data in a Desalination Bulk Water Offtake & SLA Dashboard
Here is how you can analyze data from this dashboard:
- Filter by Customer Segment: Isolate offtake volumes and SLA metrics for specific buyer accounts.
- Track Delivery Targets: Review the total offtake KPI to confirm performance against prior periods.
- Monitor Volume Trends: Use the trend chart to detect seasonal dips or delivery anomalies early.
- Evaluate Plant Compliance: Analyze the SLA compliance map to identify underperforming facilities.
- Identify Penalty Trends: Compare quarterly penalty charts to spot periods with higher financial impact.
- Assess Penalty Exposure: Use the funnel to understand avoided, paid, and disputed penalties.
- Manage Escalations: Filter by escalation status to track open issues and resolution ownership.
- Improve Resolution Time: Monitor SLA breach resolution time to reduce delays in issue closure.
Benefits of a Desalination Bulk Water Offtake & SLA Dashboard
The following are the benefits of using this dashboard:
- Centralized Performance View: Combines delivery, compliance, and penalty metrics across all plants.
- Stronger SLA Monitoring: Tracks compliance across customer segments and plant locations.
- Reduced Manual Effort: Prebuilt KPIs and charts simplify SLA and offtake reporting.
- Targeted Plant Insights: Enables plant-level performance analysis for operational improvements.
- Clear Penalty Visibility: Funnel view highlights exposure across all penalty stages.
- Better Contract Management: Aligns teams with SLA obligations and escalation workflows.
- Shared Operational Clarity: Provides a unified view for operations and commercial leadership.
KPIs to Track in a Desalination Bulk Water Offtake & SLA Dashboard
The following key KPIs can be tracked by using this dashboard:
- Total Bulk Water Offtake Volume (cubic meters): The core metric in any bulk water offtake dashboard measures total volume delivered against contracted offtake obligations over the selected period.
- Average SLA Breach Resolution Time (days): Tracks how quickly identified SLA breaches are closed shorter resolution cycles directly reduce the risk of compounding penalties and improve compliance standing.
- Stakeholder Escalations (#): Quantifies the number of escalations raised by bulk water customers. Effective stakeholder escalation water supply management is essential to preserving longterm offtake relationships.
- Energy Consumption (kWh/m³): Measures the energy intensity of desalination plant performance tracking rising consumption per cubic meter signals process inefficiency that may affect delivery cost and sustainability targets.
- SLA Compliance Rate (%): Evaluates the proportion of delivery and quality obligations met against SLA terms the primary benchmarking indicator for desalination SLA compliance rate across all plant locations.
- SLA Penalties / Liquidated Damages ($M): Tracks total SLA penalty liquidated damages incurred across all customer segments, enabling finance and legal teams to manage and reduce contractual liability.
Frequently Asked Questions
Q1. What teams use a Desalination Bulk Water Offtake & SLA Dashboard?
Water utility operations teams, offtake contract managers, plant performance analysts, and executive leadership overseeing bulk water supply agreements are the primary users of this dashboard.
Q2. How does this dashboard improve SLA compliance outcomes?
By combining the SLA Compliance Rate KPI with the plant-level compliance map and the Penalty Reduction Funnel, teams can identify which locations are at risk of breach and take corrective action before penalties are formally assessed.
Q3. Can this dashboard track escalation resolution status?
Yes, the Stakeholder Escalations by Escalation Status donut chart breaks all escalations into Pending, Open, and Resolved categories, giving contract teams a clear picture of where active intervention is still needed.