What is an Oil-Fired Power Industrial Contract Profitability Dashboard?
An Oil-Fired Power Industrial Contract Profitability Dashboard is a performance monitoring system designed to help utilities evaluate revenue, margin, contract delivery reliability, billing cycle efficiency, and penalty patterns across industrial power contracts. It functions as an oil-fired power industrial contract profitability dashboard, centralizing contract KPIs into a single analytical interface. Utilities use it to examine how contract structures, delivery performance, fuel price scenarios, and customer payment behavior influence profitability.
This dashboard also serves as a tool for analyzing thermal power plant contract revenue and margin performance, enabling teams to compare contracted load versus actual energy sold, analyze cost-to-serve, track penalty charges, and assess contract renewal risks. With integrated monitoring of SLA compliance, billing accuracy, and payment delays, the dashboard supports operational and financial transparency for contract managers, finance teams, and commercial departments. It also serves as an oil-based generation contract cost, pricing, and profitability monitoring system, enabling electric utilities to quantify risks and enhance contract outcomes across various industrial segments.
How to Create an Oil-Fired Power Industrial Contract Profitability Dashboard
You don’t need to build your report from scratch—just start with a ready-to-use dashboard template from Mokkup. Add in your data and export it however you like. Here’s how to do it:
1. Create or Log in to Your Mokkup Account
Start by signing up on Mokkup.ai using your email. If you already have an account, just log in, and you’ll be good to go.
2. Choose and Customize Your Dashboard Template
Find the Oil-Fired Power Industrial Contract Profitability Dashboard template in the Templates section. Use the drag-and-drop editor to adjust KPIs, edit filters, or add elements based on your data.
3. Export to Your BI Tool
Once your dashboard wireframe is ready, use the BI Tool Export feature to send it directly to Power BI or Tableau for further analysis and enhancements. You can also download the dashboard as a PDF, PNG, or JPEG, embed it on a platform, or invite your team to collaborate.
Note: This is a Pro template. You’ll need a Pro subscription on Mokkup to use and customize this dashboard wireframe. Upgrade anytime to unlock full access.
Oil-Fired Power Industrial Contract Profitability Dashboard Example
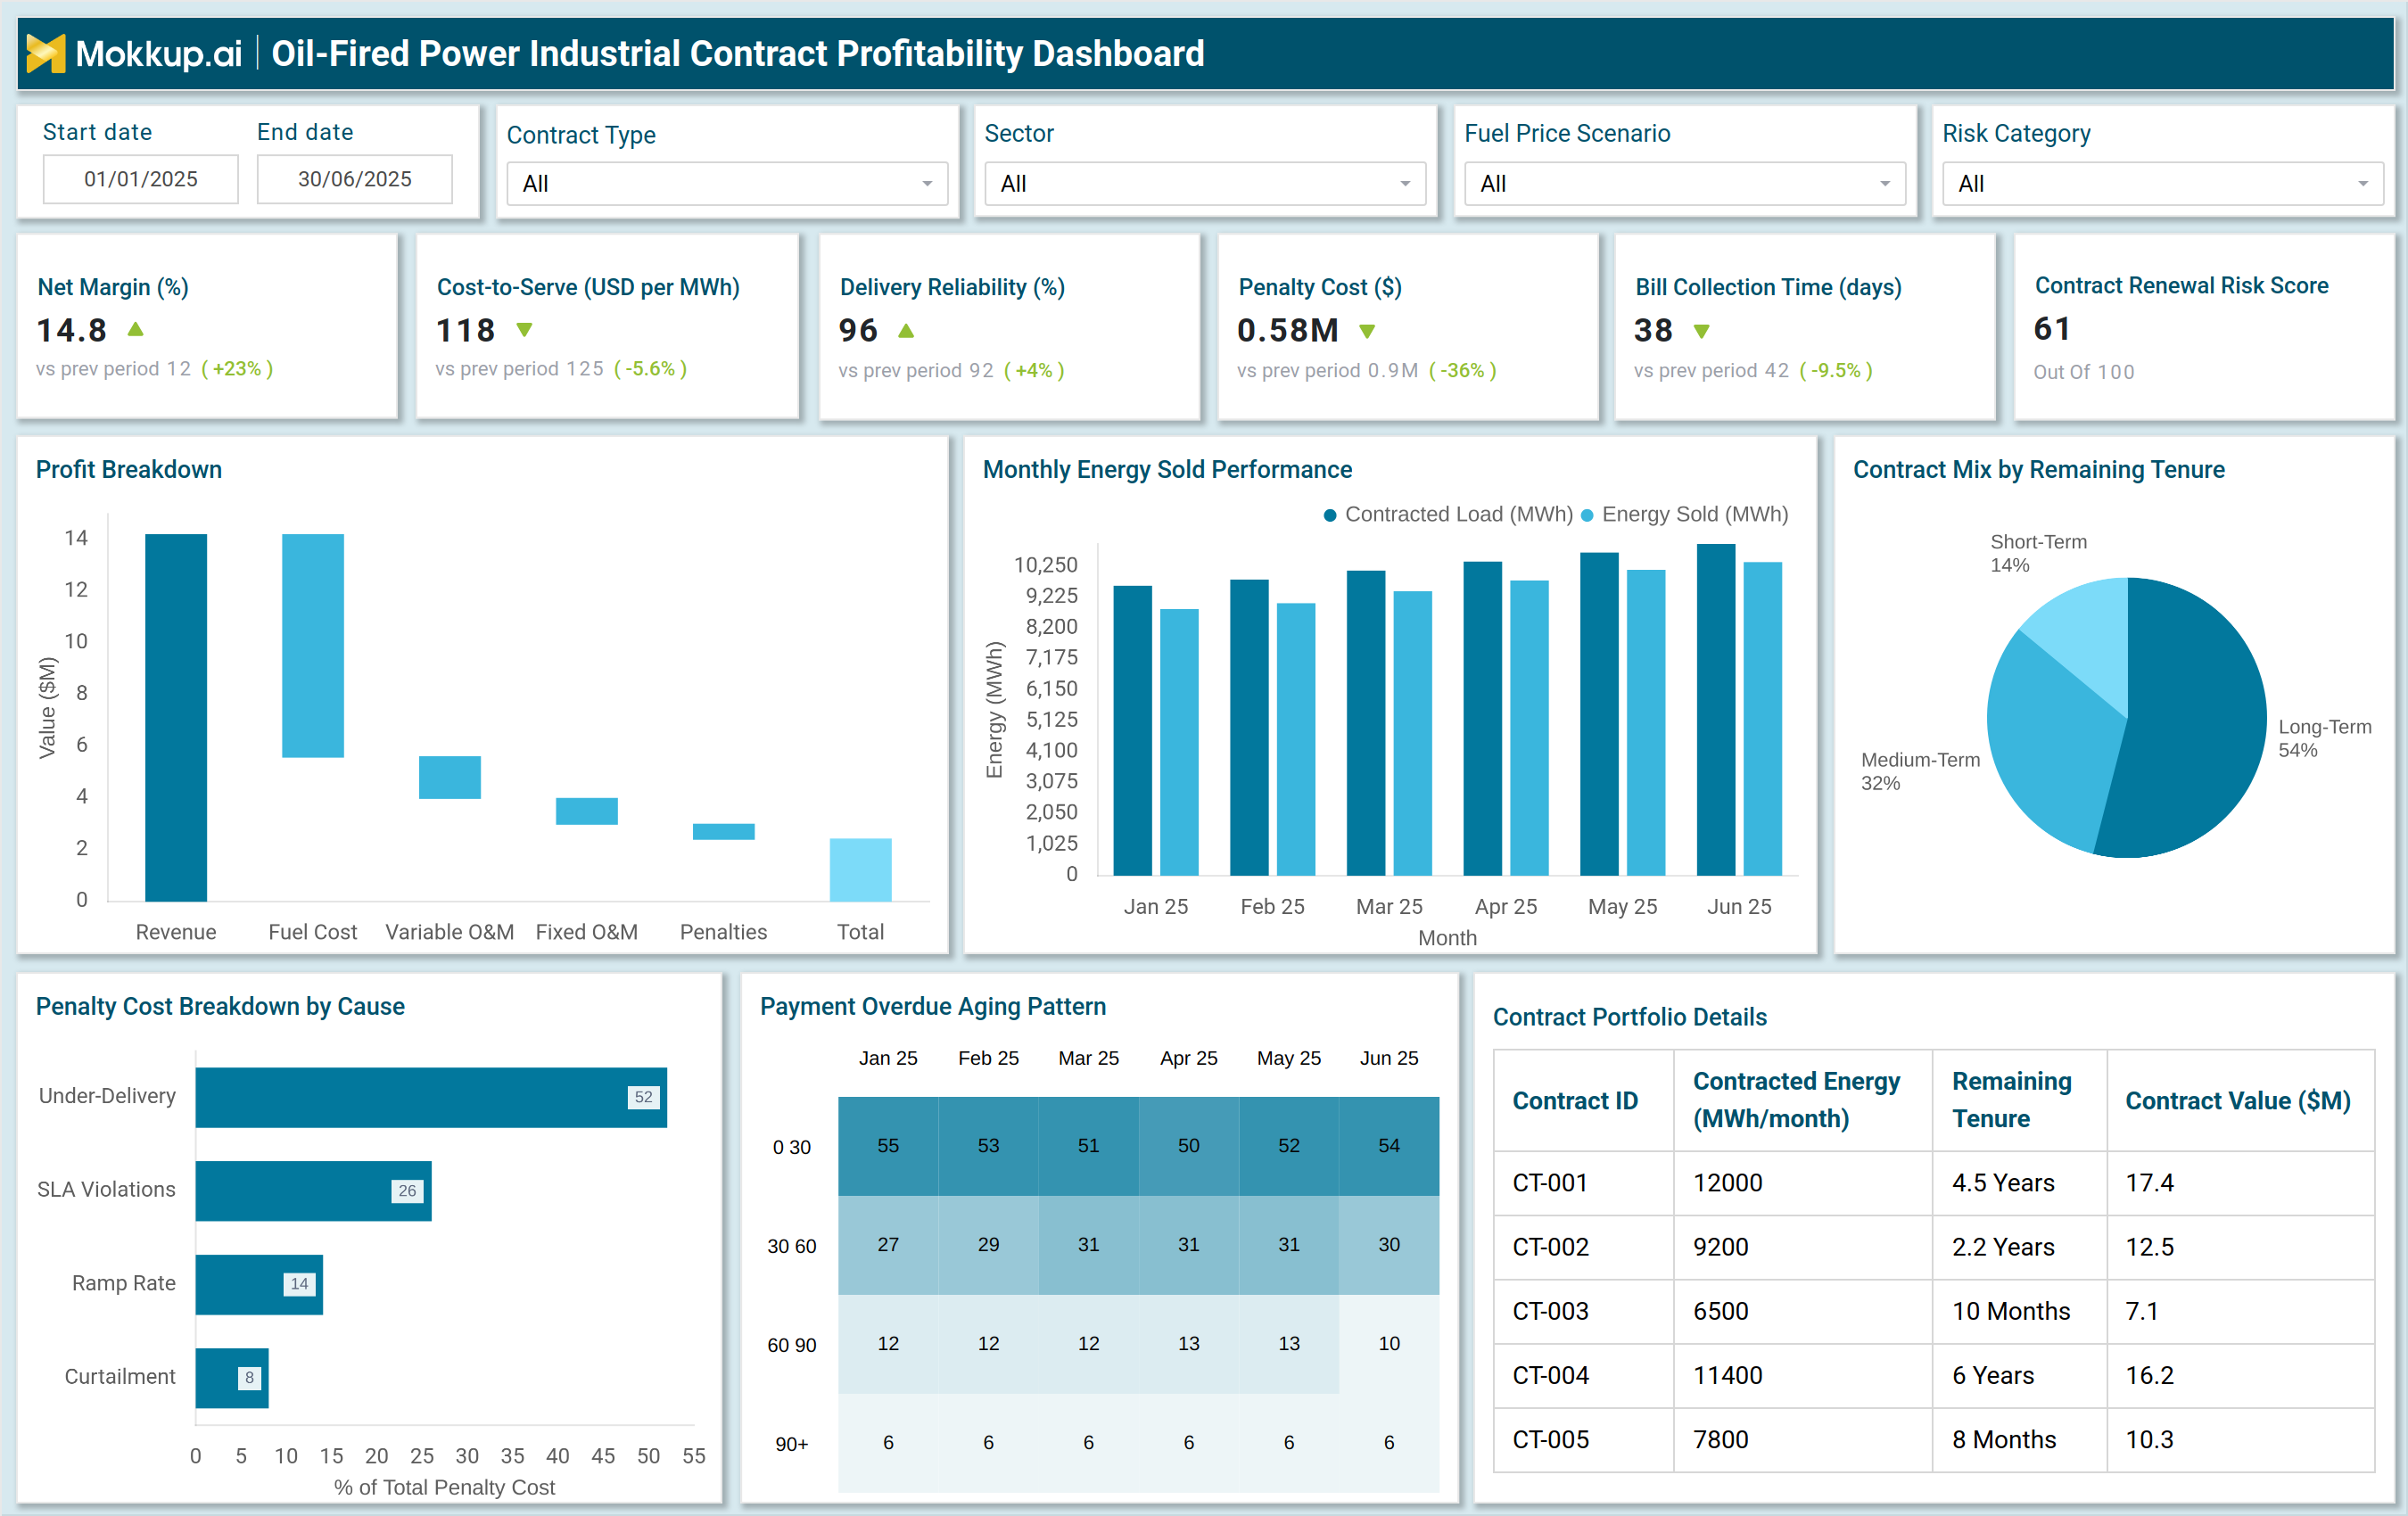
A practical example of this dashboard includes visuals that help utilities measure contract profitability from multiple dimensions. At the top level, KPIs such as Net Margin, Cost-to-Serve, Delivery Reliability, Penalty Cost, Bill Collection Time, and Contract Renewal Risk Score provide a quick assessment of financial and operational contract performance. These indicators help utilities understand whether contracts are generating sustained profitability and meeting delivery commitments. The Profit Breakdown visualization separates revenue, fuel costs, variable operating and maintenance (O&M) costs, fixed O&M costs, and penalties. This breakdown enables utilities to precisely identify margin pressure points, making the dashboard suitable as a tool for evaluating utility-scale thermal power contracts and financial performance reporting.
Monthly Energy Sold Performance charts compare contracted load with actual energy sold, helping identify scenarios of under-delivery or over-delivery that impact profitability. Additional visuals, such as Penalty Cost Breakdown, Payment Overdue Aging Pattern, and Contract Mix by Remaining Tenure, provide insights into compliance gaps, customer payment behavior, and the distribution of the contract lifecycle. These components make the dashboard a dependable industrial power purchase agreement profitability and cost efficiency tracker for oil-fired utilities. The inclusion of billing cycle indicators and SLA performance metrics transforms the dashboard into a comprehensive dashboard for oil-fired plant contract settlement, billing accuracy, and revenue realization, supporting financial governance and operational accountability. Penalty and deviation visualizations also function as a thermal generation contract deviation, clause compliance, and penalty analysis tool, helping utilities enforce contract terms and mitigate financial risks.
How to Analyze Data in an Oil-Fired Power Industrial Contract Profitability Dashboard
Here is how you can analyze data from this oil-fired plant contract settlement, billing accuracy, and revenue realization dashboard:
- Review Net Margin (%) to determine profitability trends across industrial contracts.
- Analyze Cost-to-Serve (USD/MWh) to evaluate whether operating costs are aligned with contract pricing.
- Monitor Delivery Reliability (%) to identify SLA adherence and potential penalty risks.
- Track Penalty Cost ($) to understand drivers such as under-delivery, ramp rate issues, or curtailment.
- Evaluate Bill Collection Time to measure payment accuracy and customer responsiveness.
- Review Contract Renewal Risk Score to prioritize contracts that require renegotiation or improved service levels.
- Compare contracted load vs. energy sold to evaluate performance deviations.
- Analyze penalty breakdown to find recurring operational or contractual gaps.
- Monitor payment overdue patterns to detect customers with chronic delays.
- Assess contract value and tenure to segment profitable long-term agreements from short-term ones.
Benefits of an Oil-Fired Power Industrial Contract Profitability Dashboard
The following are the benefits of using this thermal power plant contract revenue and margin performance analysis tool:
- Provides a consolidated view of contract profitability across industrial customer segments.
- Helps identify margin erosion caused by fuel volatility, cost-to-serve, or penalties.
- Improves billing accuracy and revenue realization.
- Enhances SLA compliance monitoring through structured delivery and penalty data.
- Supports contract renegotiation with factual performance metrics.
- Enables commercial teams to evaluate customer payment behavior and credit risk.
- Strengthens governance by tracking clause compliance and operational deviations.
- Enhances decision-making for contract renewal or termination.
- Allows utilities to optimize pricing strategies based on actual cost and performance outcomes.
- Supports long-term profitability planning through detailed contract lifecycle insights.
KPIs to Track in an Oil-Fired Power Industrial Contract Profitability Dashboard
The following key KPIs can be tracked by using this dashboard:
- Net Margin (%) – Measures profitability after costs and penalties.
- Cost-to-Serve (USD/MWh) – Operational cost required to fulfill contract obligations.
- Delivery Reliability (%) – SLA performance indicator showing delivery success.
- Penalty Cost ($) – Total penalty value resulting from contract deviations.
- Bill Collection Time (Days) – Measures the duration of the payment cycle and customer response.
- Contract Renewal Risk Score – Assesses the likelihood of contract continuation.
- Energy Sold vs. Contracted Load – Highlights over- or under-delivery impact.
- Penalty Breakdown by Cause – Identifies major compliance failure areas.
- Payment Overdue Aging – Evaluates customer credit and payment reliability to determine outstanding balances.
- Contract Value ($M) – Financial value of active industrial agreements.
- Remaining Tenure (Years) – Contract lifecycle and renewal planning indicator.
- Contribution from Fuel & O&M Costs – Identifies cost drivers affecting profitability.
Frequently Asked Questions
1. Who uses this dashboard?
Commercial managers, contract administrators, financial controllers, operations teams, and corporate leadership in oil-fired utilities.
2. Why is contract profitability important for oil-fired plants?
Fuel volatility, SLA penalties, and cost-to-serve variations significantly impact margins; profitability monitoring ensures financial stability.
3. How does this dashboard support contract management?
It provides structured insights on delivery reliability, billing accuracy, clause compliance, and renewal risk to improve contract outcomes.