
What is an Annual Shipping Operations & Tax Refund Dashboard?
An Annual Shipping Operations & Tax Refund Dashboard is a centralized analytics tool designed to help logistics managers, importers, and exporters monitor freight costs, customs compliance, and tax refund opportunities. This dashboard consolidates shipment data, tax refund claims, and carrier performance into a single view, enabling businesses to optimize shipping operations and recover eligible customs duties.
By tracking key metrics such as total shipment value, tax refund recovery rates, and eligible pending refunds, companies can identify cost-saving opportunities and ensure compliance with international trade regulations. The dashboard also provides insights into shipment trends by region, product category, and carrier, helping businesses make data-driven decisions to improve efficiency and reduce expenses.
How to Create an Annual Shipping Operations & Tax Refund Dashboard
You don’t need to build your report from scratch, just start with a ready-to-use Annual Shipping Operations & Tax Refund dashboard template from Mokkup. Add in your data and export it however you like. Here’s how to do it:
1. Create or Log in to Your Mokkup Account
Start by signing up on Mokkup.ai using your email. If you already have an account, just log in, and you’ll be good to go.
2. Choose and Customize Your Dashboard Template
Find the Annual Shipping Operations & Tax Refund Dashboard template in the Templates section. Use the drag and drop editor to adjust KPIs, edit filters, or add elements based on your data.
3. Export to Your BI Tool
Once your dashboard wireframe is ready, use the BI Tool Export feature to send it directly to Power BI or Tableau for further analysis and enhancements. You can also download the dashboard as a PDF, PNG, or JPEG, embed it on a platform, or invite your team to collaborate.
Note: This is a Pro template. You’ll need a Pro subscription on Mokkup to use and customize this dashboard wireframe. Upgrade anytime to unlock full access.
Annual Shipping Operations & Tax Refund Dashboard Example
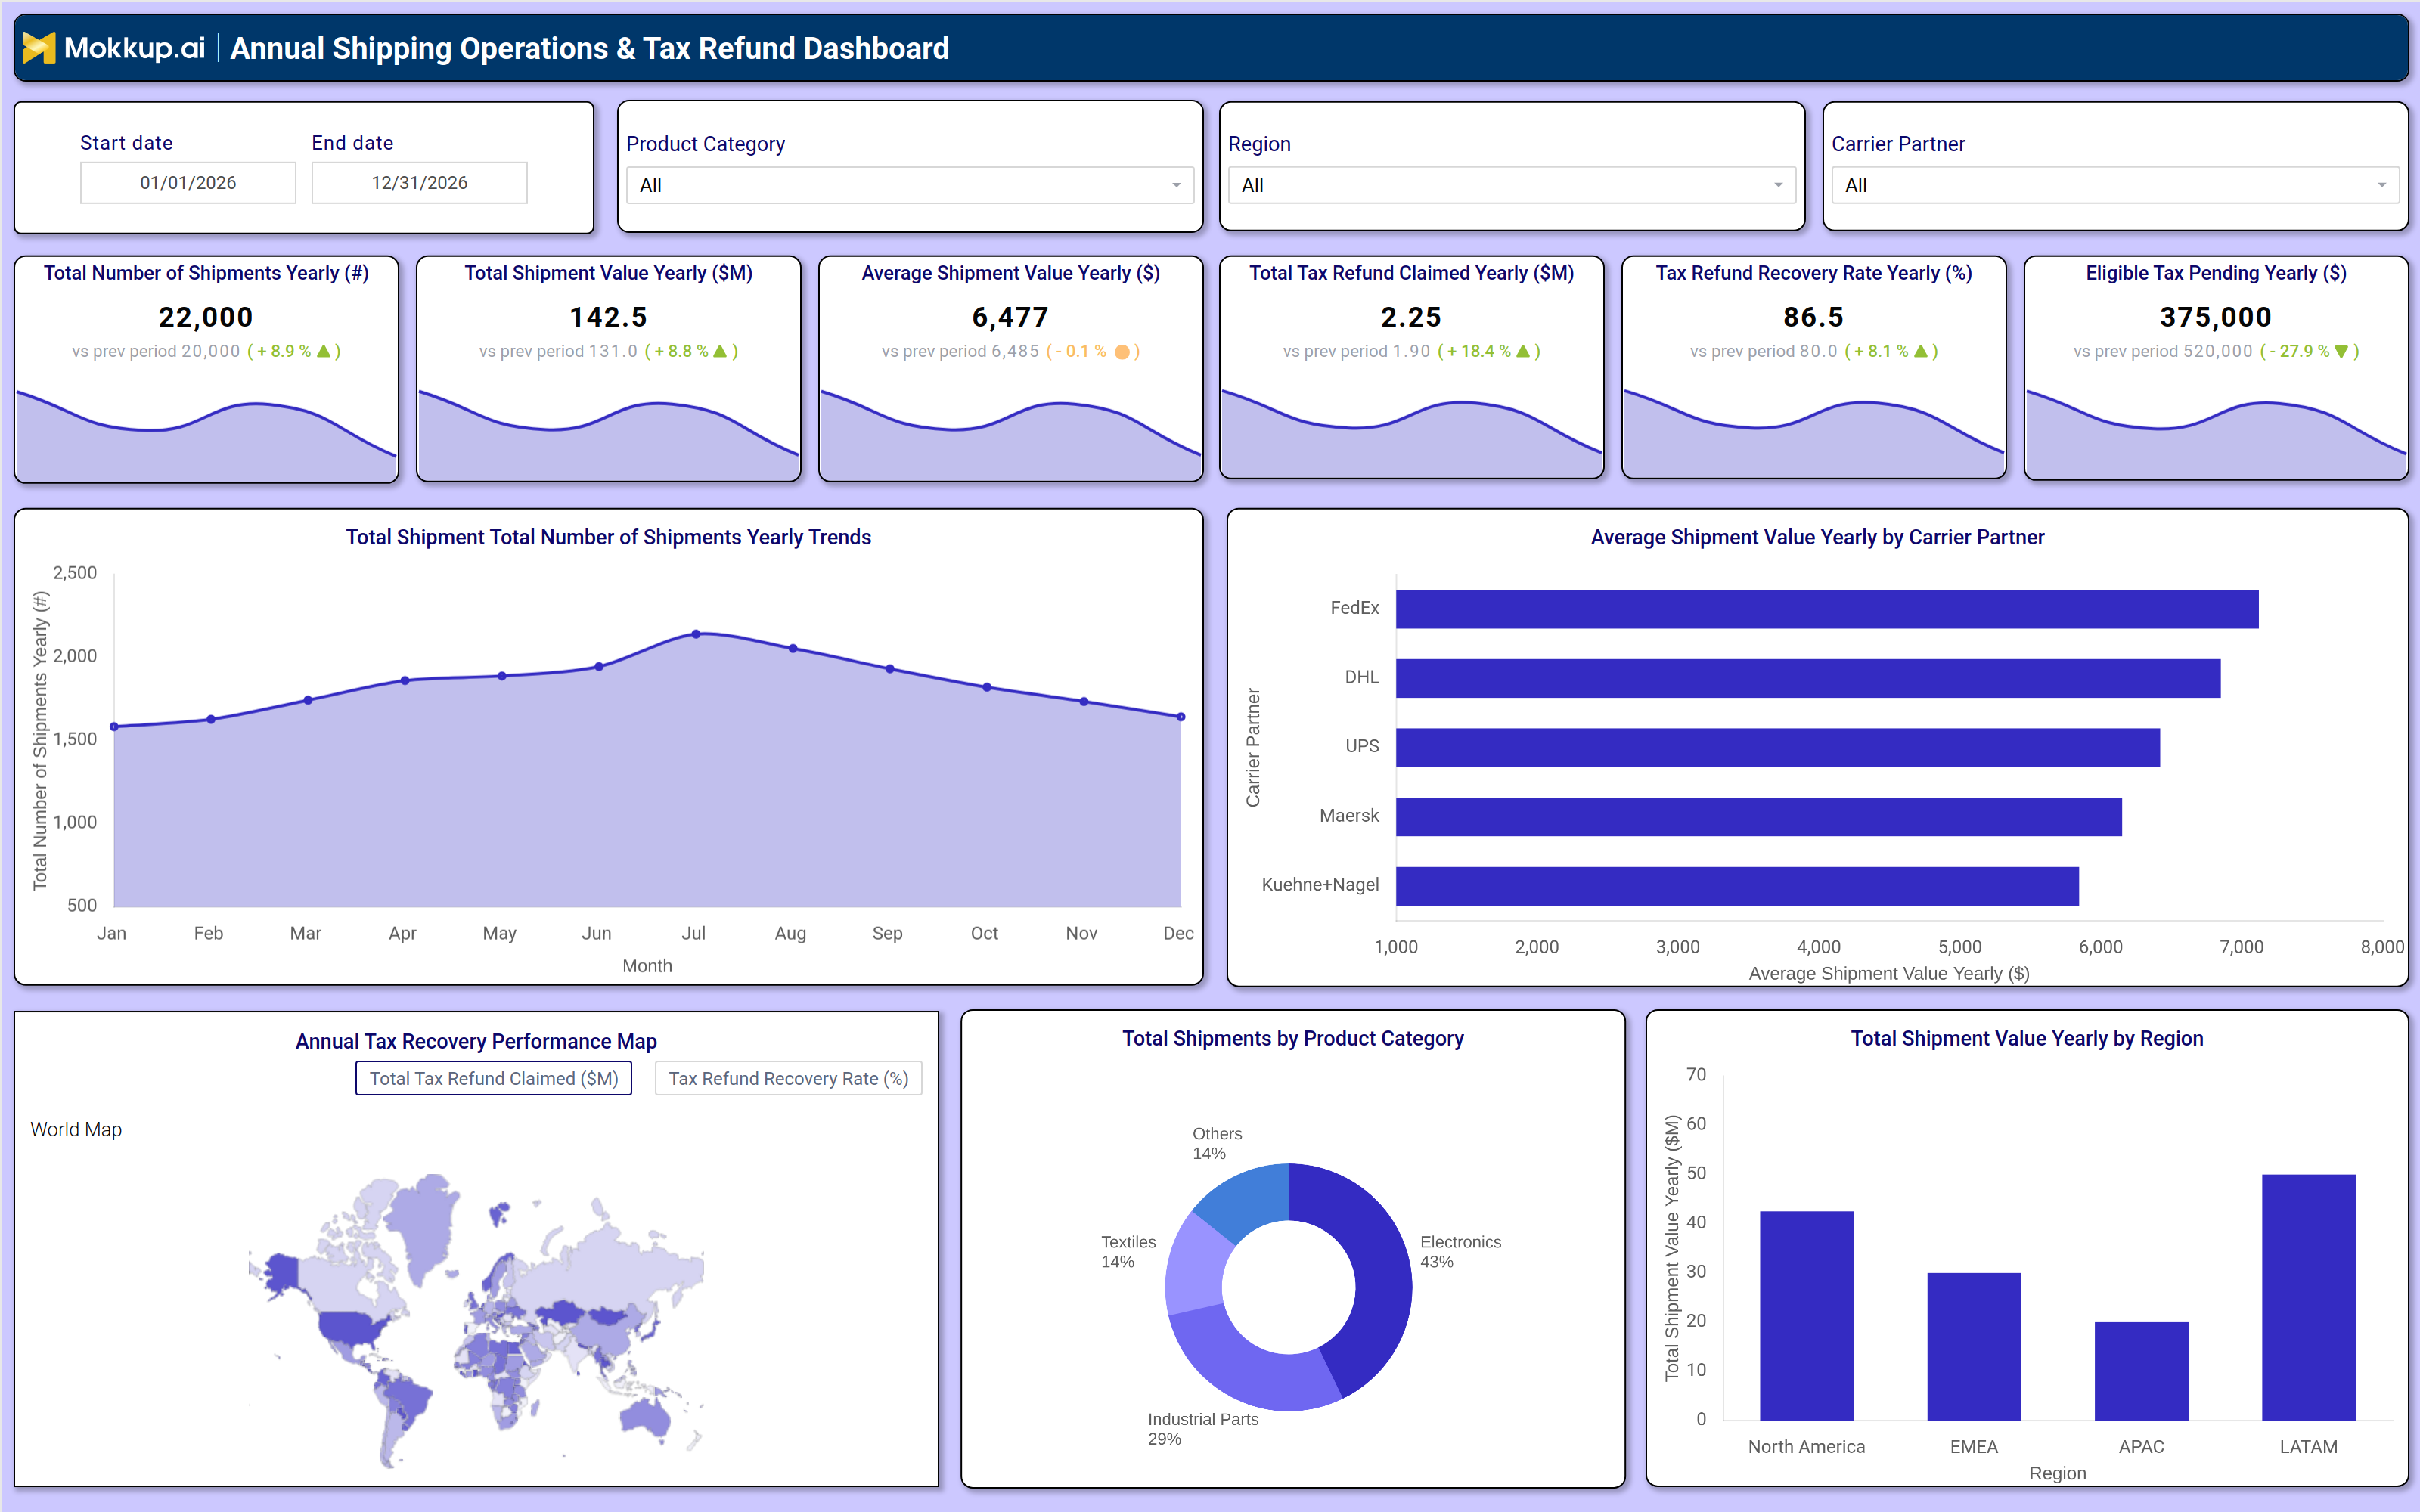
A well-structured freight analytics dashboard includes interactive filters for date range, product category, region, and carrier partner, allowing users to drill down into specific data segments. Key performance tiles display metrics such as total number of shipments, total shipment value, average shipment value, tax refund claimed, tax refund recovery rate, and eligible tax pending. Trend charts compare yearly shipment volumes and values, while a carrier performance breakdown highlights average shipment values by logistics provider.
A product category distribution pie chart shows the proportion of shipments by type (e.g., electronics, textiles, industrial parts), and a regional shipment value bar chart identifies high-cost shipping zones. Additionally, a world map visualizes tax recovery performance by country, helping businesses assess refund opportunities globally.
How to Analyze Data in an Annual Shipping Operations & Tax Refund Dashboard
Here is how you can analyze data from this customs compliance dashboard:
- Track Shipment Volume Trends: Identify seasonal demand patterns to improve logistics planning.
- Compare Shipment Value: Review year-over-year shipment value changes to assess budget impact.
- Monitor Refund Recovery Rates: Evaluate customs compliance efficiency and refund success rates.
- Prioritize Pending Refunds: Analyze eligible tax pending amounts to improve cash flow management.
- Assess Carrier Performance: Compare shipment values by carrier to optimize logistics partnerships.
- Review Product Categories: Analyze category distribution to improve inventory and shipping strategies.
- Evaluate Regional Costs: Identify high-cost shipping regions and explore cost-saving opportunities.
- Track Refund Trends by Country: Focus on regions with the strongest refund recovery potential.
Benefits of an Annual Shipping Operations & Tax Refund Dashboard
The following are the benefits of using this dashboard:
- Improved Freight Visibility: Tracks shipment volumes, values, and logistics trends in one view.
- Higher Tax Recovery: Helps identify and maximize eligible customs duty refunds.
- Better Compliance Monitoring: Supports customs compliance with data-driven refund insights.
- Optimized Carrier Selection: Compares carrier performance and shipping costs effectively.
- Reduced Operational Costs: Improves logistics planning through cost analysis.
- Smarter Decision-Making: Supports strategic shipping and refund optimization initiatives.
- Streamlined Reporting: Consolidates shipment and refund data into a single dashboard.
KPIs to Track in an Annual Shipping Operations & Tax Refund Dashboard
The following key KPIs can be tracked by using this dashboard:
- Total Number of Shipments Yearly (#): Measures annual shipment volume to assess logistics demand.
- Total Shipment Value Yearly ($M): Tracks the total monetary value of shipments for cost analysis.
- Average Shipment Value Yearly ($): Calculates the average cost per shipment to identify pricing trends.
- Total Tax Refund Claimed Yearly ($M): Monitors the total refund amount successfully claimed from customs.
- Tax Refund Recovery Rate Yearly (%): Evaluates the efficiency of refund claims by comparing recovered vs. eligible amounts.
- Eligible Tax Pending Yearly ($): Identifies unclaimed refunds to prioritize recovery efforts.
Frequently Asked Questions
Q1. Who should use a logistics cost optimization dashboard?
Logistics managers, importers, exporters, and finance teams are responsible for shipping costs and tax refunds.
Q2. How does an Annual Shipping Operations & Tax Refund Dashboard improve logistics planning?
The dashboard helps teams analyze shipment trends, carrier performance, regional shipping costs, and refund recovery data, enabling better logistics decisions, cost optimization, and more efficient customs management.
Q3. Can this shipping operations dashboard help reduce shipping costs?
Yes, by analyzing shipment trends, carrier performance, and tax refund opportunities, businesses can identify cost-saving measures.