What is an Addiction Treatment Outcomes Dashboard?
An Addiction Treatment Outcomes Dashboard for Substance Use Disorder (SUD) is an analytics platform designed for addiction treatment settings. It consolidates data from therapy sessions, tracks patient progress, and visualizes key behavioral health metrics. The dashboard wireframe is tailored for clinical leaders, therapists, and program managers who need structured reporting on therapy interventions, patient outcomes, Cognitive Behavioral Therapy (CBT) analytics, and overall program impact. With built-in tools for therapy outcomes tracking and mental health KPI dashboard views, it improves visibility into both individual patient journeys and broader operational trends, enhancing clinical effectiveness and compliance within SUD recovery programs.
How to Create an Addiction Treatment Outcomes Dashboard
You don’t need to build your report from scratch—just start with a ready-to-use dashboard template from Mokkup. Add in your data and export it however you like. Here’s how to do it:
1. Create or Log in to Your Mokkup Account
Start by signing up on Mokkup.ai using your email. If you already have an account, just log in, and you’ll be good to go.
2. Choose and Customize Your Dashboard Template
Find the Addiction Treatment Outcomes Dashboard template in the Templates section. Use the drag-and-drop editor to adjust KPIs, edit filters, or add elements based on your data.
3. Export to Your BI Tool
Once your dashboard wireframe is ready, use the BI Tool Export feature to send it directly to Power BI or Tableau for further analysis and enhancements. You can also download the dashboard as a PDF, PNG, or JPEG, embed it on a platform, or invite your team to collaborate.
Note: This is a Pro template. You’ll need a Pro subscription on Mokkup to use and customize this dashboard wireframe. Upgrade anytime to unlock full access.
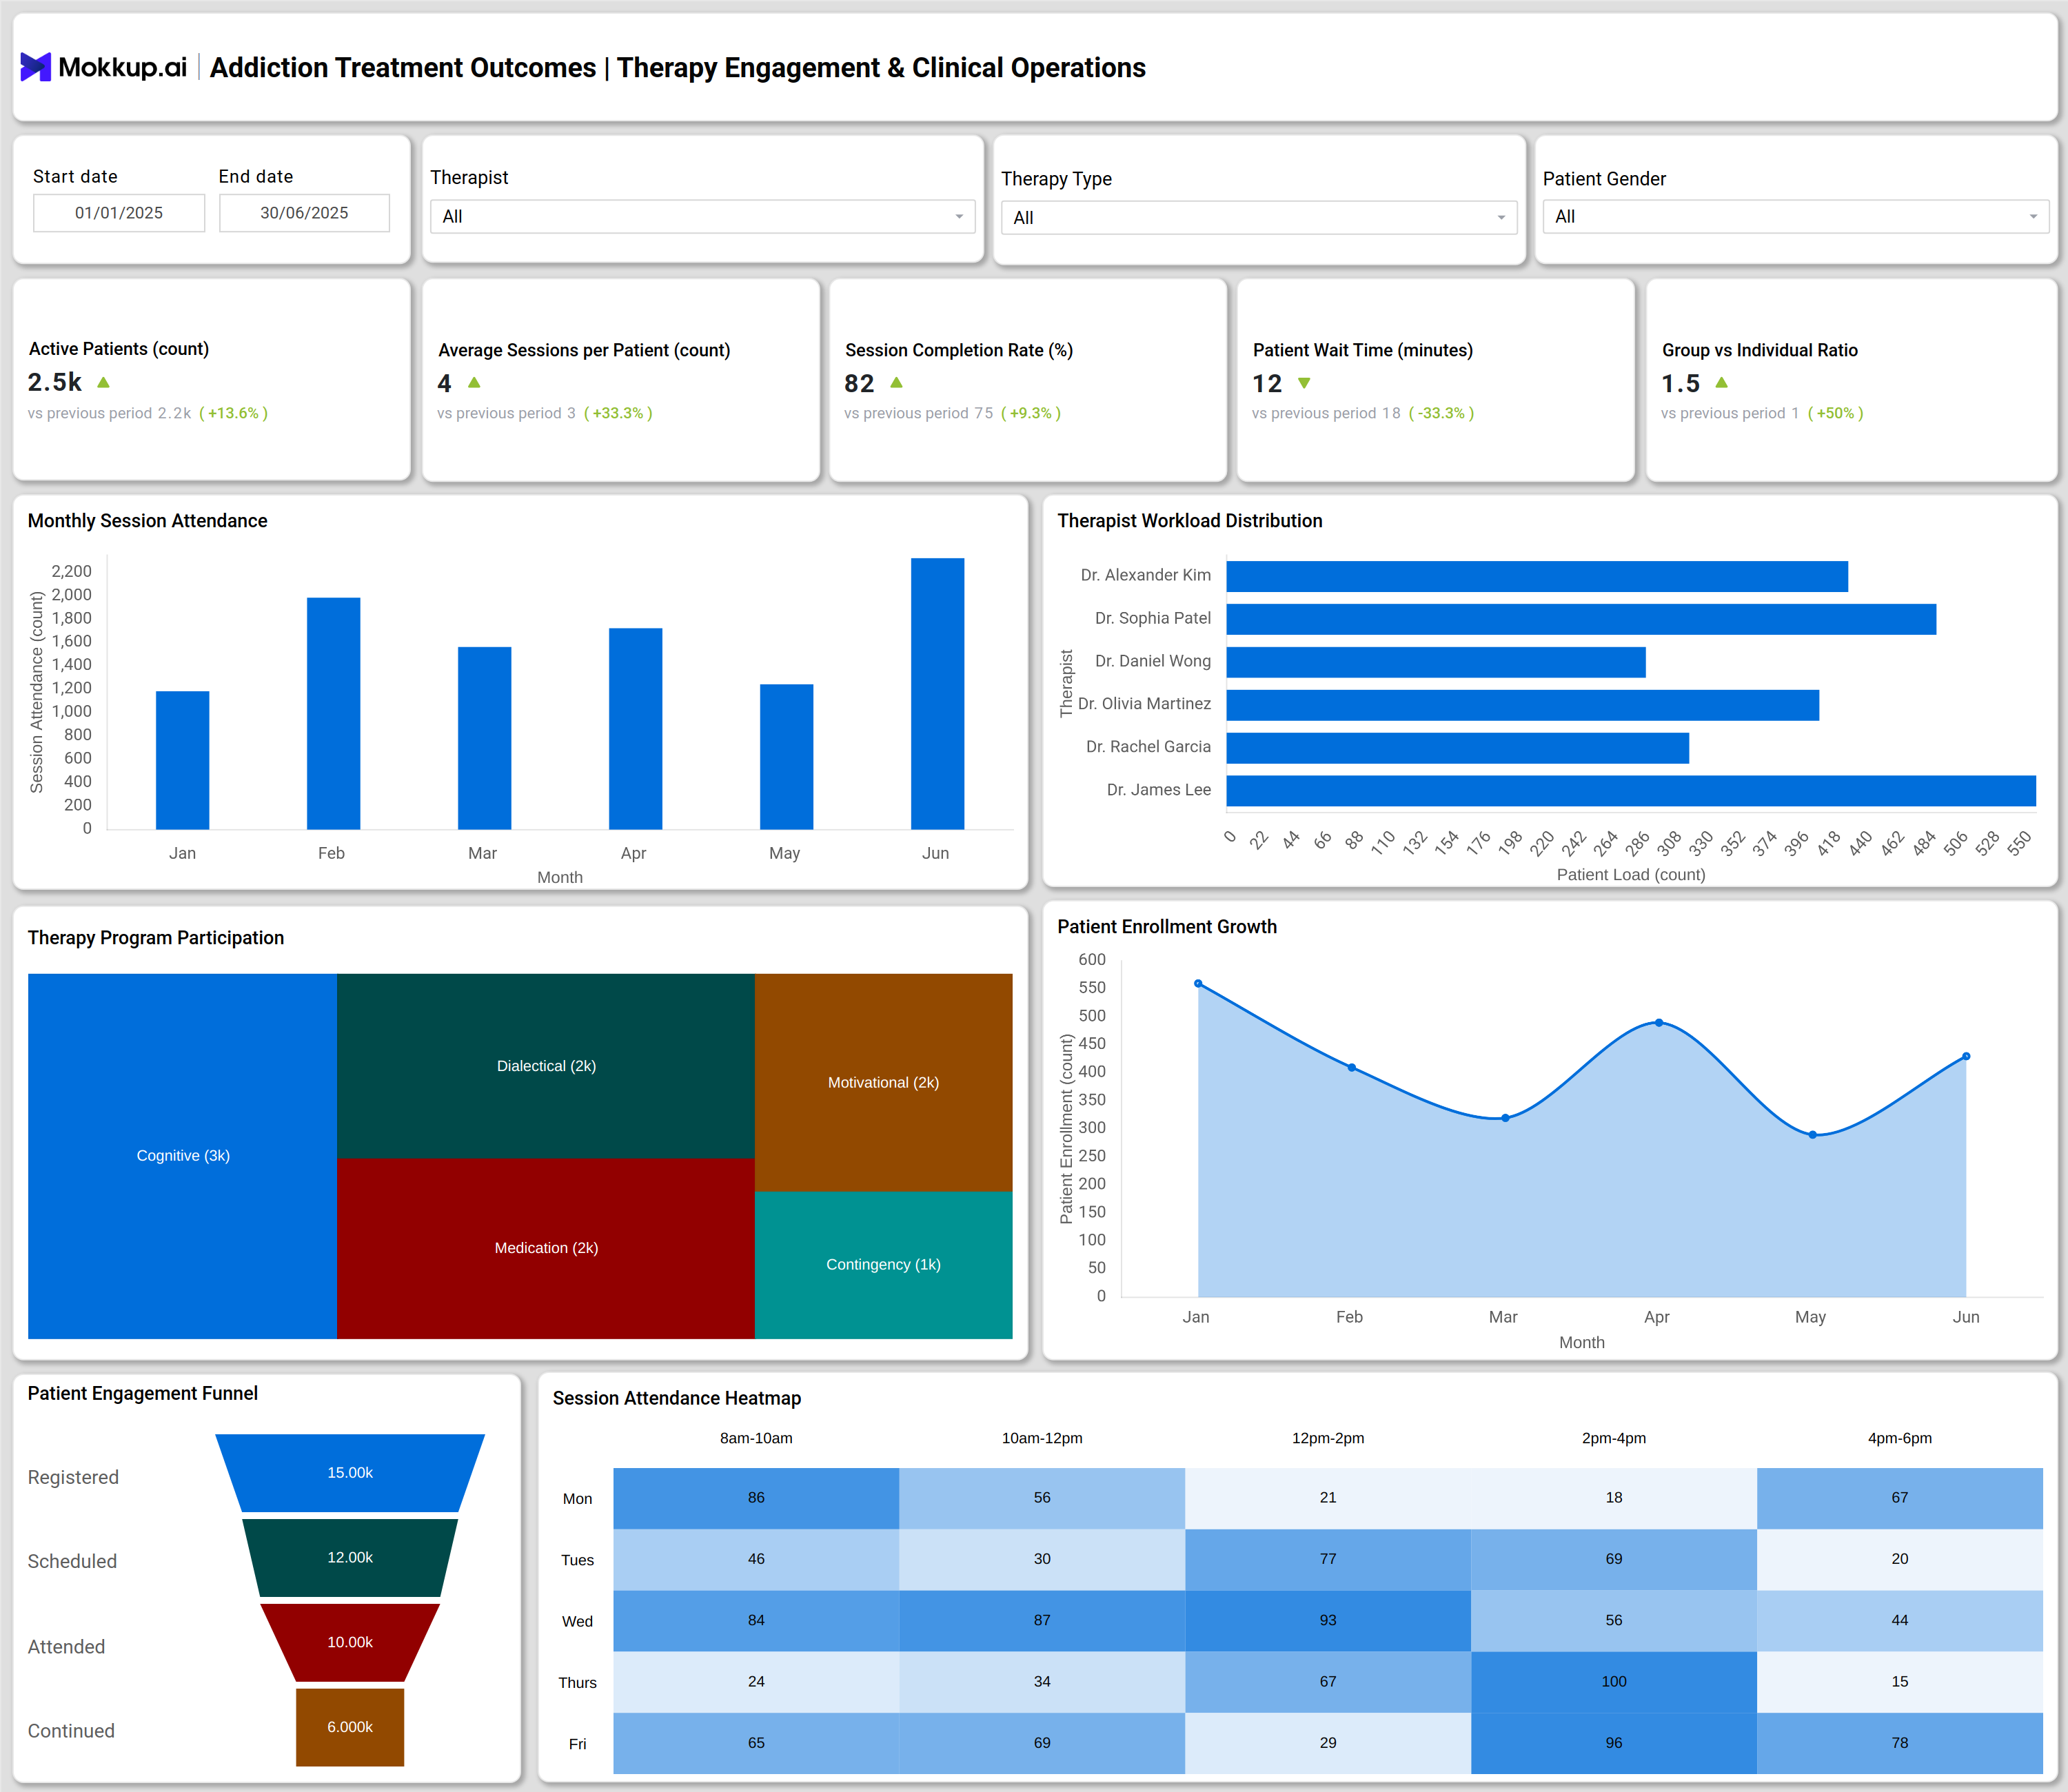
Addiction Treatment Outcomes Dashboard Example
In a typical SUD clinic, the Behavioral Therapy Operations Dashboard brings together operational and clinical data. For example, it tracks the total number of active patients, the average number of sessions per patient, session completion rates, wait times for therapy, and provides ratios of group to individual interventions. Visuals such as bar charts show therapist workload, while treemaps break down program participation across CBT, motivational therapy, and contingency management. Patient engagement funnels map the journey from registration to continued care, and heatmaps reveal patterns of session attendance. The dashboard also serves as a behavioral therapy reporting tool, combining compliance trends, relapse reporting, and patient progress monitoring into a unified interface for quick action and analysis.
How to Analyze Data in Addiction Treatment Outcomes
Addiction treatment centers can utilize outcome dashboards to monitor patient progress, assess the effectiveness of therapy, and enhance overall treatment efficiency. These insights help clinicians, administrators, and counselors make informed, data-driven decisions that enhance recovery outcomes:
- Monitor Therapy Outcomes: Track patient progression across therapy programs to identify high- or low-performing interventions and adjust treatment plans accordingly.
- Utilize Behavioral Health Metrics: Segment patient cohorts using behavioral and clinical data to uncover engagement gaps or areas of risk.
- Evaluate CBT Effectiveness: Measure the success of Cognitive Behavioral Therapy (CBT) across different demographic and clinical groups to optimize personalized care.
- Assess Therapist Workload: Review therapist caseloads to ensure balanced scheduling, improved staff utilization, and reduced burnout.
- Analyze Patient Enrollment Trends: Examine engagement funnels to identify drop-off stages and implement retention strategies that keep patients committed to recovery programs.
- Review Intervention Dashboards: Monitor behavioral intervention data to quickly detect compliance issues or early signs of relapse.
- Leverage Real-Time Analytics: Use session data and compliance rates to refine follow-up protocols and improve program outcomes dynamically.
Benefits of Addiction Treatment Outcomes
A well-designed addiction treatment outcomes dashboard helps organizations improve care delivery, optimize resource allocation, and maintain accountability across therapy programs.
- Centralized Analytics: Consolidates therapy sessions and progress data for faster, data-driven decision-making.
- Enhanced Transparency: Promotes accountability through automated reporting and KPI tracking.
- Improved Patient Outcomes: Enables continuous monitoring of progress and program effectiveness.
- Early Risk Detection: Identifies relapse or non-compliance patterns in real-time for timely interventions.
- Operational Efficiency: Streamlines planning by visualizing therapist capacity and patient flow across programs.
- Regulatory Compliance: Supports accurate reporting for compliance, grants, and accreditation while promoting evidence-based care improvements.
KPIs to Track in Addiction Treatment Outcomes
Key performance indicators (KPIs) offer valuable insights into treatment effectiveness, therapist performance, and patient engagement, all of which are essential for optimizing recovery outcomes.
- Active Patients (count): Number of patients engaged in therapy during the reporting period.
- Average Sessions per Patient: Mean number of sessions completed by each patient.
- Session Completion Rate (%): Proportion of scheduled therapy sessions completed.
- Patient Wait Time (minutes): The average time patients wait before starting their scheduled therapy.
- Group vs. Individual Ratio: Compares the utilization of group therapy sessions to individual therapy sessions.
- Therapist Workload (count): Total sessions assigned or completed by each therapist.
Frequently Asked Questions
Q1. Who can benefit from this dashboard?
Clinical directors, behavioral therapists, SUD program managers, quality teams, and grant administrators utilize the dashboard for operational improvement and tracking therapy outcomes.
Q2. How does this dashboard support Cognitive Behavioral Therapy (CBT) analytics?
It collects and displays CBT-specific intervention data, evaluates session outcomes, and enables ongoing progress monitoring of behavioral therapy metrics for evidence-based adjustments.
Q3. Is the dashboard customizable for different therapy types or patient populations?
Most dashboards allow filtering by therapy type, patient demographics, and substance use categories, making them adaptable for various program settings.