
In the dynamic world of sports, the role of data visualization has undergone a remarkable evolution. From simple charts to complex interactive graphics, the presentation of data has transformed how we perceive and understand athletic performance. This blog delves into the fascinating journey of future trends in sports data visualization, exploring its evolution from humble beginnings to its current state of artistry and sophistication. Whether you like sports or are just into numbers, come along with us as we explore how data visualization has changed in sports. We'll keep it simple and pro as we take a look at how things have evolved. Let's dive in and see how cool this journey is!
Table of Contents
- What are Data Visualization Tools for Sports Analytics?
- Integration of Data Visualization in Broadcasting and Media
- How Cricket Changed Sports Forever?
- Evolution of Data Visualization in Sports
- The Hidden VFX in Live Sports
What are Data Visualization Tools for Sports Analytics?
Data visualization tools for sports analytics help analyze and present complex sports data through interactive charts, graphs, and dashboards. These tools enable coaches and analysts to interpret player performance and game statistics, enhancing strategic decision-making. Popular tools include Tableau, Power BI, Hudl, and Catapult.
Integration of Data Visualization in Sports Broadcasting and Media
Data visualization is rapidly transforming sports broadcasting and media. Statistics are no longer confined to static scoreboards; they are brought to life through engaging visuals. Imagine heatmaps depicting player movement on a basketball court or shot charts showcasing a baseball hitter's strengths. These graphics, integrated seamlessly into broadcasts, offer a deeper understanding of the game's flow and individual performances. It's not just about comprehension, though; data visualization can heighten excitement.
Real-time win probability graphs keep viewers on the edge of their seats, while interactive visualizations allow them to explore game stats in real time. This technology even extends beyond broadcasts. Social media platforms leverage data visualization to create bite-sized content, further engaging fans and promoting the game. By marrying the thrill of sports with the clarity of data, data visualization fundamentally changes how we experience sports broadcasting and media.
How Cricket Changed Sports Forever?
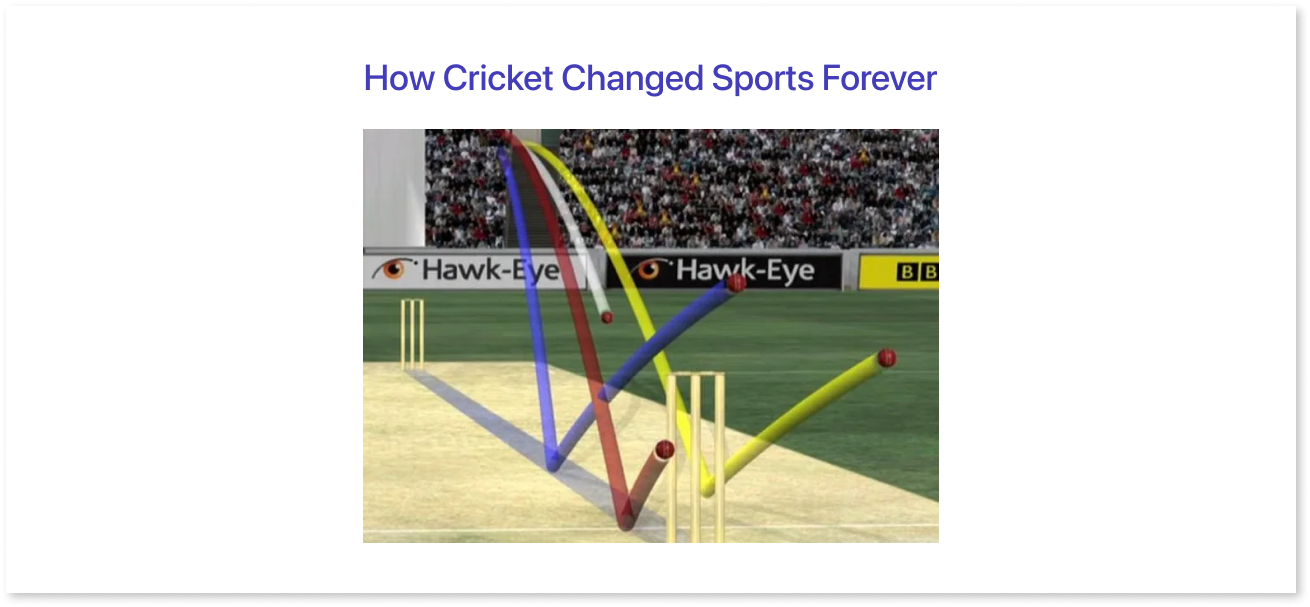
Cricket has revolutionized data visualization in sports through the extensive use of advanced sports analytics and technology. Innovations like Hawk-Eye, which tracks the ball's trajectory, and the Decision Review System (DRS), which utilizes multiple cameras and algorithms to assist in umpire decisions, have set new standards for accuracy and transparency. These sports techs provide real-time data and graphical representations that enhance the spectator experience and offer deeper insights into player performance metrics. As a result, cricket has paved the way for other sports to adopt similar technologies, fundamentally changing how data is used and visualized in sports.

Evolution of Data Visualization in Sports
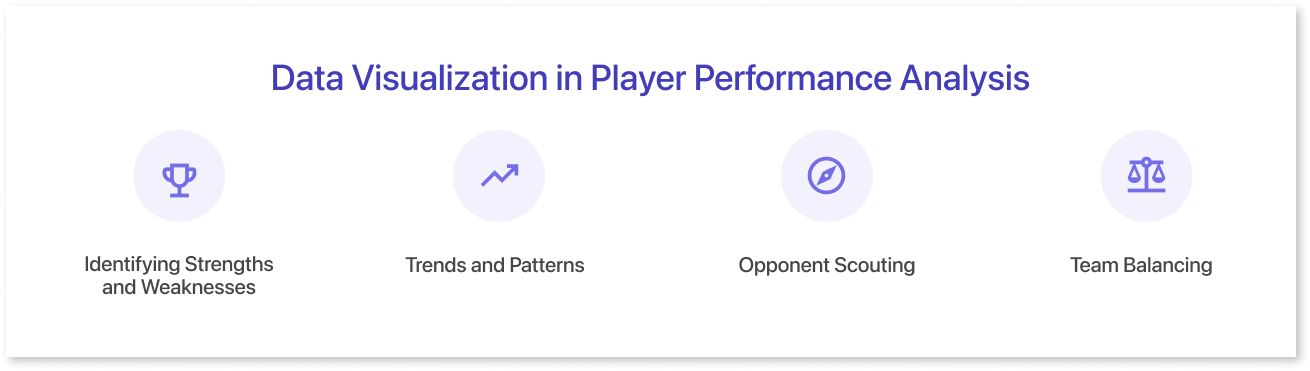
Data visualization has become a game-changer in player performance analysis. It takes the mountains of data generated in modern sports and transforms them into clear, actionable insights for coaches, trainers, and players themselves. Here's how:
- Identifying Strengths and Weaknesses: Visualizations like radar charts or scatter plots can quickly reveal a player's strengths (e.g., high shooting accuracy zones in basketball) and weaknesses (e.g., areas prone to turnovers in football). This allows for targeted training and strategy development.
- Trends and Patterns: Line graphs or heatmaps can expose trends over time. Did a player's batting average dip in the second half of the season? Did a goalkeeper's save percentage improve after adopting a new training technique? Visualizations make these patterns readily apparent.
- Opponent Scouting: Data visualization can be used to analyze an upcoming opponent's tendencies. Heatmaps might show a team's defensive formations, or shot charts could reveal a batter's vulnerability to specific pitches. This equips players with valuable knowledge to exploit weaknesses.
- Team Balancing: Visualizations can help coaches create a well-rounded team by identifying areas where the roster might be lacking. For instance, a stacked bar chart might reveal the team needs more players with strong defensive skills.
The Hidden VFX in Live Sports
The early days of VFX in sports broadcasting were very basic. The introduction of the scorebug in 1994 was a major innovation because it allowed viewers to follow the game easily. Later, the first downline was introduced in 1998. This line helps viewers understand where the goal line is and whether a team has made a first down.
More recently, broadcasters have been using VFX to create even more complex graphics. For example, in baseball, the kzone shows whether a pitch is a strike or a ball. In NASCAR, broadcasters use VFX to track cars and provide viewers with information such as speed, gear position, and fuel consumption.
While these effects are often subtle and seamlessly integrated, they play a crucial role in providing a richer, more informative broadcast.
1. Real-Time Data Visualization
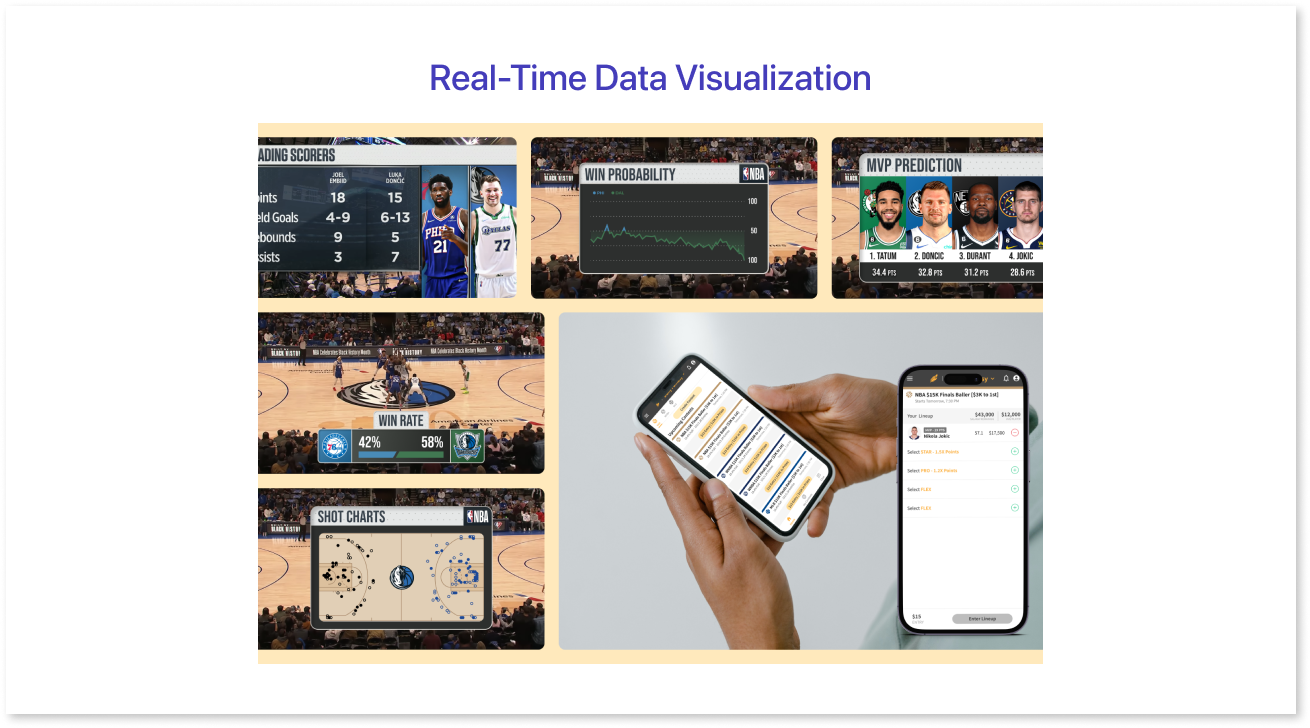
One of the most prominent uses of VFX in live sports is the real-time visualization of data. This includes overlays displaying player statistics, heat maps, and movement trails that track player positions and trajectories. For example, in soccer, viewers can see a player's speed and distance covered, or in basketball, a shot chart highlighting shooting accuracy from various court positions. These visualizations are generated using advanced tracking technologies and are rendered live, ensuring that the information is current and relevant.
2. Augmented Reality (AR) Graphics
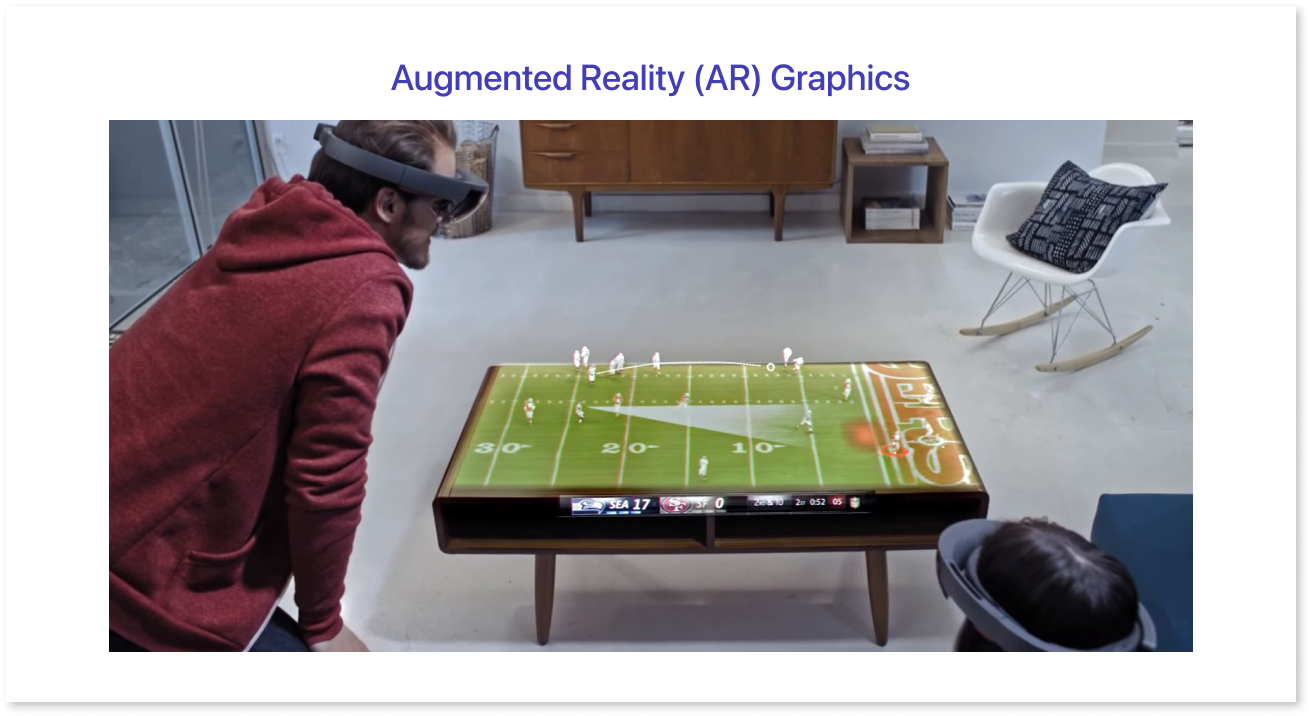
AR graphics have become a staple in sports broadcasting, especially in pre-game shows and replays. These graphics can include virtual pitch maps, player comparisons, and tactical analysis displayed on the field or court. They provide a deeper understanding of the game by visually explaining strategies and plays. For instance, in football, AR can illustrate a quarterback's throwing path or a running back's route, giving viewers insights into the play's execution.
3. Enhanced Replays
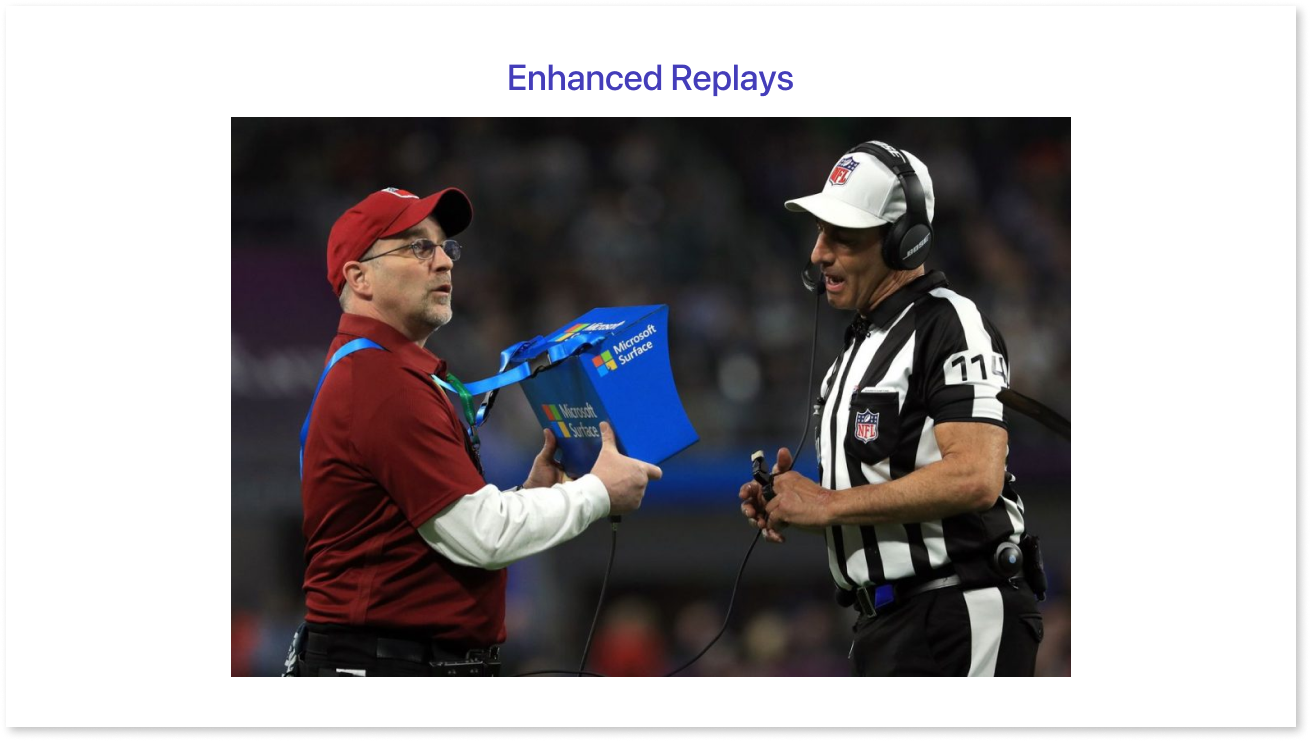
Slow-motion replays have long been a part of sports broadcasting, but VFX has taken this a step further with enhanced replays. These replays can include 3D modeling to show different angles of a play, holographic replays that can be rotated and examined from various perspectives, and virtual recreations that provide a clearer view of controversial moments. This technology not only enhances the viewer's experience but also aids commentators in breaking down complex plays and decisions.
4. Virtual Advertising

Another subtle yet impactful use of VFX in live sports is virtual advertising. This involves overlaying advertisements on the field, court, or rink in real-time, tailored to specific broadcasts and regions. These ads can be adjusted seamlessly without disrupting the live action, providing a significant revenue stream for broadcasters and teams while ensuring a clean and uncluttered viewing experience.
5. Player and Ball Tracking

Advanced VFX systems also include player and ball-tracking technologies. Using high-speed cameras and sensors, these systems capture precise movements and positions, allowing for detailed analysis and visualization. In tennis, for example, Hawk-Eye technology tracks the ball’s trajectory to determine if a shot is in or out, providing crucial data trends for umpire decisions and instant replays.
6. Immersive Fan Experiences
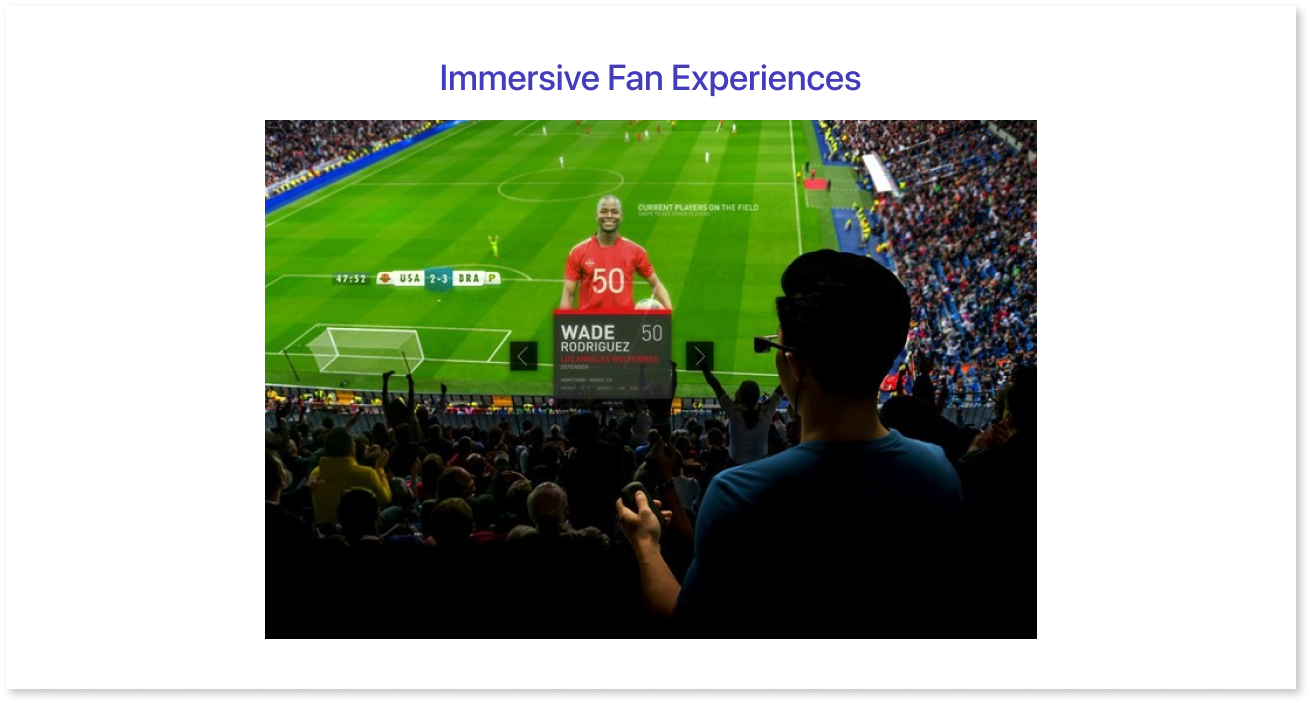
Beyond traditional broadcasts, VFX is used to create immersive fan experiences through virtual and augmented reality. Fans can experience games from a player's perspective or access detailed sports statistics and replays through VR headsets and AR applications. These innovations allow fans to interact with the game in unprecedented ways, deepening their connection and engagement with the sport.
VFX is being used to create new viewing experiences. For example, the NFL has been using RFID tags to track players in real-time. This data is used to create 3D models of the players, which can then be used to generate all sorts of graphics, such as replays from different angles. One particularly interesting example of how VFX is being used in sports broadcasting is a recent NFL game that was broadcast in a Toy Story-themed environment. The entire football field and all the players were brought into a virtual world. This was made possible by combining real-time tracking data with machine learning algorithms.
In short, we can conclude that VFX should be used to serve the story of the game. While VFX can be used to create all sorts of bells and whistles, it's important not to lose sight of the human drama that unfolds on the field.
Conclusion
By leveraging Mokkup.ai's intuitive design features, sports broadcasters can craft data visualizations that seamlessly integrate with hidden VFX, creating a truly revolutionary viewing experience. This cloud-based platform empowers anyone to design professional-grade dashboards in minutes, fostering collaboration and accelerating design iterations. The result: engaging, informative broadcasts that bring fans closer to the game than ever before.
Frequently Asked Questions
Data visualization transforms raw sports data into visual formats, such as charts, heatmaps, and dashboards, helping coaches, analysts, and fans understand patterns in performance, strategy, and game dynamics.
It simplifies complex data, improves decision-making, identifies trends, and enhances communication between teams, coaches, and analysts while boosting fan engagement through interactive insights.
Popular tools include Tableau, Power BI, Mokkup, and Catapult, which enable analysts to visualize performance metrics, player stats, and team comparisons efficiently.
It highlights strengths, weaknesses, and progress trends through visuals, allowing coaches to tailor training plans and athletes to make data-backed improvements.
Common visuals include heatmaps, scatter plots, radar charts, line graphs, and bar charts, each used to showcase performance metrics, movement patterns, and trend analysis.
Teams analyze their opponent's tendencies, optimize formations, and assess player roles through visual data insights, helping them develop effective game plans and make informed tactical decisions.
The future lies in AI-driven analytics, real-time 3D visuals, augmented reality, and immersive fan experiences, offering deeper insights and interactive storytelling.
By turning statistics into interactive visuals, such as live win probabilities or player heatmaps, fans gain a richer, more immersive understanding of the game in real-time.
Prompt it. Wireframe it with Mokkup.ai.
