
In today's fast-paced and data-driven marketing landscape, having a comprehensive understanding of your marketing performance is essential for making decisions. A well-designed marketing dashboard serves as the key to unlocking valuable insights that can drive the success of your campaigns and strategies. By tracking and analyzing essential metrics, you can gain a clear picture of your marketing efforts and identify areas for improvement. In this article, we will explore the essential metrics that should be included in your marketing dashboard, enabling you to make data-backed decisions with confidence. These metrics span various aspects of marketing, providing a holistic view of your performance and empowering you to optimize your strategies for maximum results. By leveraging the power of these metrics, your marketing dashboard becomes a vital tool in achieving your business objectives and staying ahead of the competition. Let's dive into the essential metrics that will unlock the true potential of your marketing efforts and guide you toward success.
Table of Contents
- What Are Business Metrics?
- Why Tracking Business Metrics Is Important
- 5 Key Business Metrics To Include In Your Marketing Dashboard
- Benefits Of Marketing Dashboard
What Are Business Metrics?
Business metrics are quantifiable measures used to evaluate the performance and progress of a company in achieving its strategic goals and objectives. These metrics provide valuable insights into various aspects of a business, including its financial health, operational efficiency, customer satisfaction, and overall growth. By tracking and analyzing key metrics, businesses can make informed decisions, identify areas for improvement, and monitor the effectiveness of their strategies. Common business metrics include sales revenue, customer acquisition cost, conversion rate, customer lifetime value & customer satisfaction. Accurate and relevant metrics help businesses gauge their success, optimize processes, and drive sustainable success in today's competitive landscape.
Why Tracking Business Metrics is Important
Your business isn’t one-dimensional – getting an accurate picture of what’s really going on means measuring multiple metrics and observing how they affect each other. So you can understand exactly what is and isn’t contributing to success. Otherwise, you may make poor decisions that undermine your performance. It all sounds like hard work. However, an all-in-one dashboard makes tracking business metrics much easier. You can create goals for each department and monitor their progress by tracking relevant marketing KPIs from one single platform.
Below are some points briefly discussing why tracking business metrics is important for several reasons:
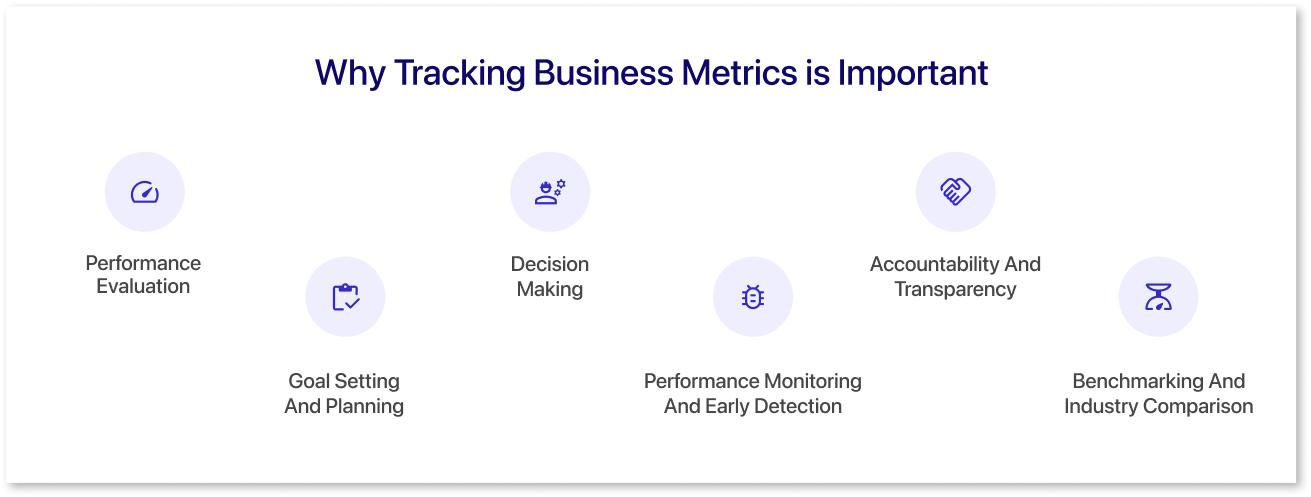
- Performance Evaluation: Tracking metrics allow businesses to assess their performance and measure progress towards their goals. Metrics provide objective data that can be used to evaluate the success or failure of various strategies, initiatives, or projects. By monitoring key metrics, businesses can identify areas that need improvement and make informed decisions to optimize performance.
- Goal Setting And Planning: Metrics help businesses set realistic and measurable goals. By understanding current performance levels and identifying areas for improvement, businesses can establish targets that align with their strategic objectives. Metrics provide a benchmark against which progress can be measured, helping businesses to prioritize initiatives and allocate resources effectively.
- Decision-Making: Metrics provide valuable insights that can support data-driven decision-making. When faced with choices or opportunities, businesses can analyze relevant metrics to evaluate the potential impact on performance. Metrics help quantify the benefits and risks associated with different options, enabling informed decision-making that is based on evidence rather than assumptions or intuition.
- Performance Monitoring And Early Detection: Tracking metrics for marketing on a regular basis allows businesses to monitor performance in real-time. By setting up regular reporting and analysis processes, businesses can identify trends, patterns, or anomalies that may require attention. Early detection of issues or opportunities allows for timely intervention and the ability to make adjustments or capitalize on emerging trends.
- Accountability And Transparency: Metrics provide a basis for accountability and transparency within an organization. By establishing clear performance metrics, businesses can hold individuals, teams, or departments accountable for their results. Metrics also enable transparency by providing a common language and understanding of performance across different levels of the organization, fostering a culture of transparency and continuous improvement.
- Benchmarking And Industry Comparison: Tracking business metrics allows for benchmarking against industry standards or competitors. By comparing performance metrics with similar businesses or industry averages, businesses can gain insights into their relative position and identify areas where they may be falling behind or excelling. Benchmarking can inform goal setting, strategic planning and identify best practices to drive performance improvements.
Overall, tracking business metrics is essential for understanding performance, making informed decisions, and driving continuous improvement. It enables businesses to measure progress, identify areas for optimization, and adapt strategies based on real-time data, ultimately leading to enhanced competitiveness and sustainable growth.
5 Key Business Metrics To Include In Your Marketing Dashboard
It’s the age of analytics, but having lots of data isn’t the same as having information you can act on. For example, checking out your visitor count and page clicks can be fun, but those numbers don’t tell you how to get more ROI out of your next marketing campaign.
A well-designed marketing dashboard is essential for businesses to monitor and evaluate the effectiveness of their marketing efforts. It provides a centralized view of key metrics that are crucial for measuring the success and impact of marketing campaigns. While there are numerous metrics to consider, certain key business metrics stand out as critical indicators of overall marketing performance. In this section, we will explore five key business metrics that should be included in your marketing dashboard. These metrics cover different aspects of marketing, providing valuable insights that can guide you in strategic decision-making and drive business growth.
Creating a marketing dashboard using mokkup.ai will allow you to provide team members with readily accessible visual data. You can also use the Pre-built marketing templates, such as customer journey, website health, webinar analysis, and many more. These templates will provide you with metrics other companies are tracking and understand if they are essential to your business. By tracking these metrics, businesses can gain a comprehensive understanding of their marketing performance and make data-driven optimizations to achieve their goals. Let's delve into these essential metrics and understand how they contribute to a successful marketing dashboard.
1. Sales Revenue
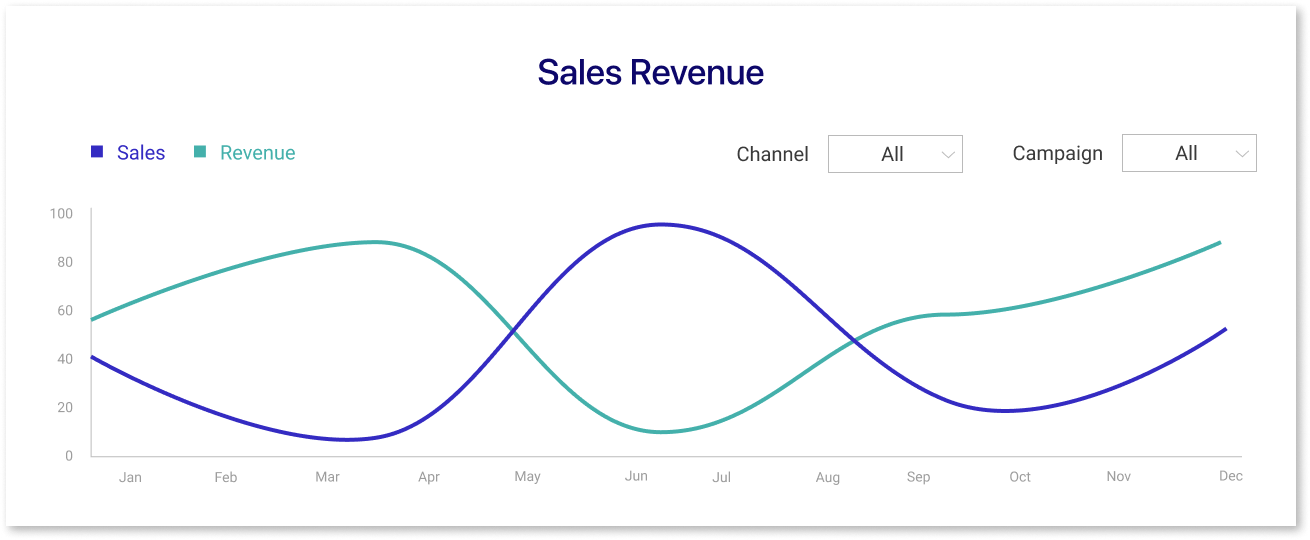
- Sales revenue is a critical metric that helps track the effectiveness and success of a marketing dashboard. It allows you to calculate the return on investment (ROI) for your marketing campaigns. By comparing the revenue generated with the marketing expenses incurred, you can determine the profitability and efficiency of your marketing activities.
- By correlating sales revenue with specific marketing campaigns, you can assess their impact on generating revenue. This analysis helps you identify which campaigns are driving the most sales and which ones are underperforming. It enables you to allocate your marketing budget and resources more effectively.
- Sales revenue data allows you to attribute revenue to specific marketing channels or tactics. This attribution helps you identify which channels are delivering the highest returns and optimize your marketing mix accordingly. For example, you can determine the spend and revenue; hence the ROI per channel, like social media ads, email marketing campaigns, search engine optimization, or offline advertising, can help you make decisions on which channel to spend more on.
2. Customer Acquisition Costs
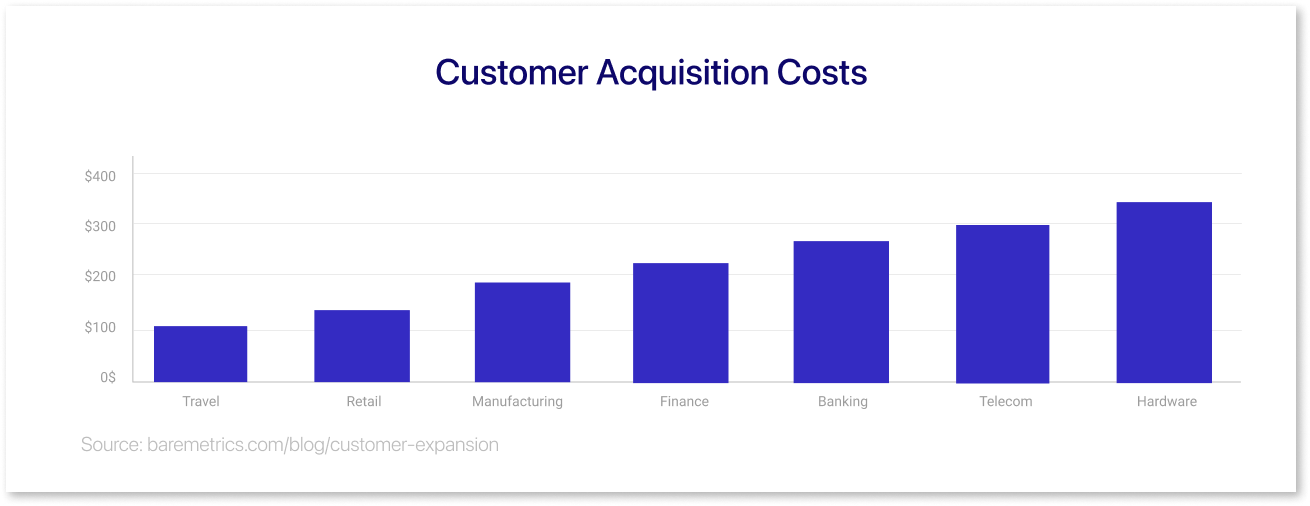
- Customer Acquisition Costs are the expenses related to acquiring new customers. This KPI tells you how much you’re spending on acquiring a new customer, including the associated costs, such as your advertising spend.
- CAC provides insights into the cost associated with acquiring new customers. By tracking and analyzing CAC, you can determine how much budget you should allocate to various marketing channels and campaigns. This helps ensure that your marketing efforts are cost-effective and that you're maximizing the return on your marketing investment.
- By comparing the CAC with the customer lifetime value (CLV), you can calculate the ROI of your marketing efforts. If the CAC is significantly higher than the CLV, it may indicate that your marketing campaigns are not generating enough value from acquired customers. This analysis helps you assess the profitability and long-term sustainability of your marketing strategies.
3. Conversion Rate
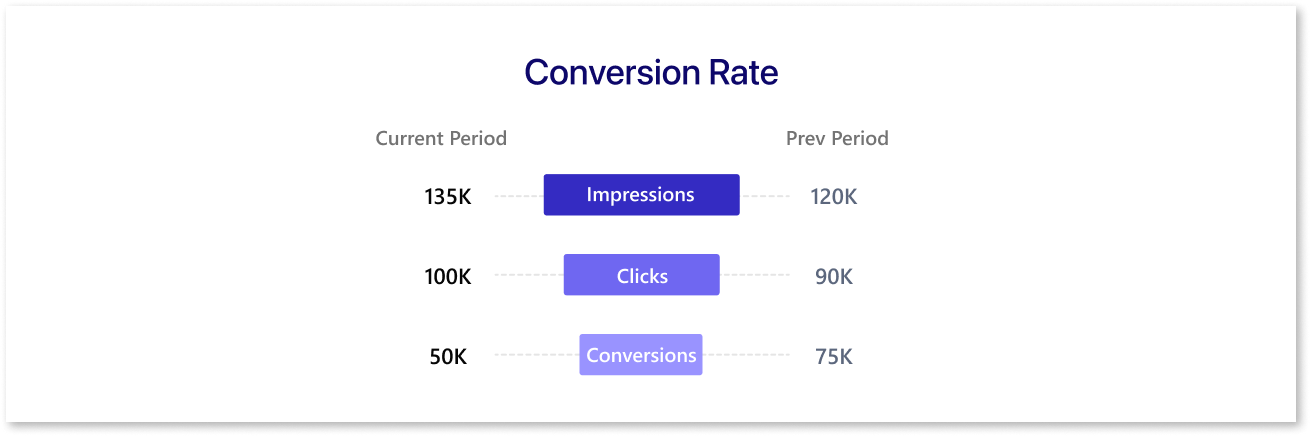
- Conversion rate measures the percentage of visitors or leads who take a desired action, such as making a purchase, filling out a form, or subscribing to a newsletter. By tracking conversion rates, you can evaluate the performance of your marketing campaigns and initiatives. A higher conversion rate indicates that your marketing efforts are effectively driving desired actions and engaging your audience.
- Conversion rate data helps you identify areas for improvement in your marketing campaigns. By analyzing conversion rates across different channels, campaigns, or customer segments, you can pinpoint which specific areas need optimization. This analysis allows you to make data-driven decisions to enhance your marketing strategies, creative elements, messaging, or targeting to increase conversion rates.
- Conversion rate data helps you allocate your marketing budget more effectively. By comparing the conversion rates and associated costs of different marketing channels or campaigns, you can identify which channels deliver the highest return on investment (ROI) and allocate more budget to those channels. This optimization ensures that your resources are focused on the initiatives that generate the best conversion rates and maximize your marketing impact.
4. Customer Lifetime Value
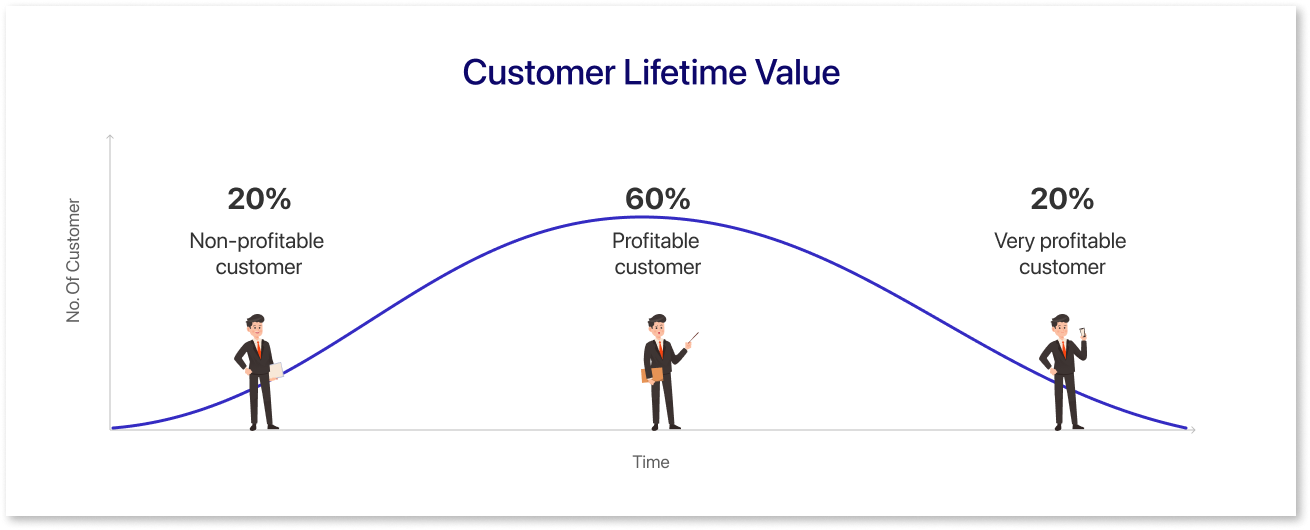
- Customer Lifetime Value measures the total value a customer brings to your business over their entire relationship with your company. By tracking CLV, you can assess the financial performance and profitability of your marketing efforts. It provides insights into the long-term revenue potential of your customers and helps you make informed decisions about resource allocation and investment in customer acquisition and retention.
- CLV allows you to segment your customer base based on their value to your business. By analyzing CLV across different customer segments, you can identify which segments are most valuable and have the highest revenue potential. This information helps you prioritize your marketing efforts and allocate resources to target and retain high-value customers.
- CLV is closely linked to customer retention. By understanding the value of a customer over their lifetime, you can identify which customers are most at risk of churning and focus on implementing effective retention strategies. By monitoring CLV and its changes over time, you can assess the impact of your retention efforts and adjust your strategies accordingly to maximize customer lifetime value.
5. Customer Satisfaction
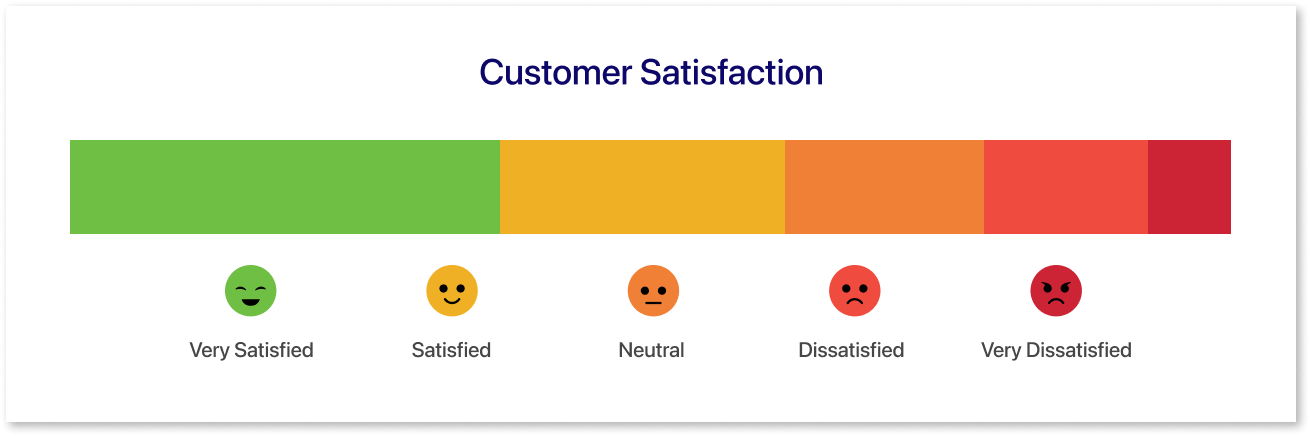
- Customer satisfaction is a vital metric that helps track the effectiveness and success of your marketing dashboard. This provides valuable feedback about how well your products, services, and marketing efforts are meeting customer expectations. By collecting and analyzing customer satisfaction data through surveys, feedback forms, or reviews, you can identify areas of improvement and make necessary adjustments to your marketing strategies.
- Satisfied customers are more likely to become loyal customers and advocates for your brand. By measuring customer satisfaction, you can track the level of loyalty and identify customers who are likely to continue doing business with you. This information helps you prioritize customer retention strategies and allocate resources to retain valuable customers.
- Customer satisfaction is closely linked to brand perception and reputation. Satisfied customers tend to have a positive perception of your brand and are more likely to speak favorably about it. By monitoring customer satisfaction, you can track changes in brand perception and reputation over time. This information helps you evaluate the impact of your marketing efforts on shaping customer perceptions.
Benefits Of Marketing Dashboards
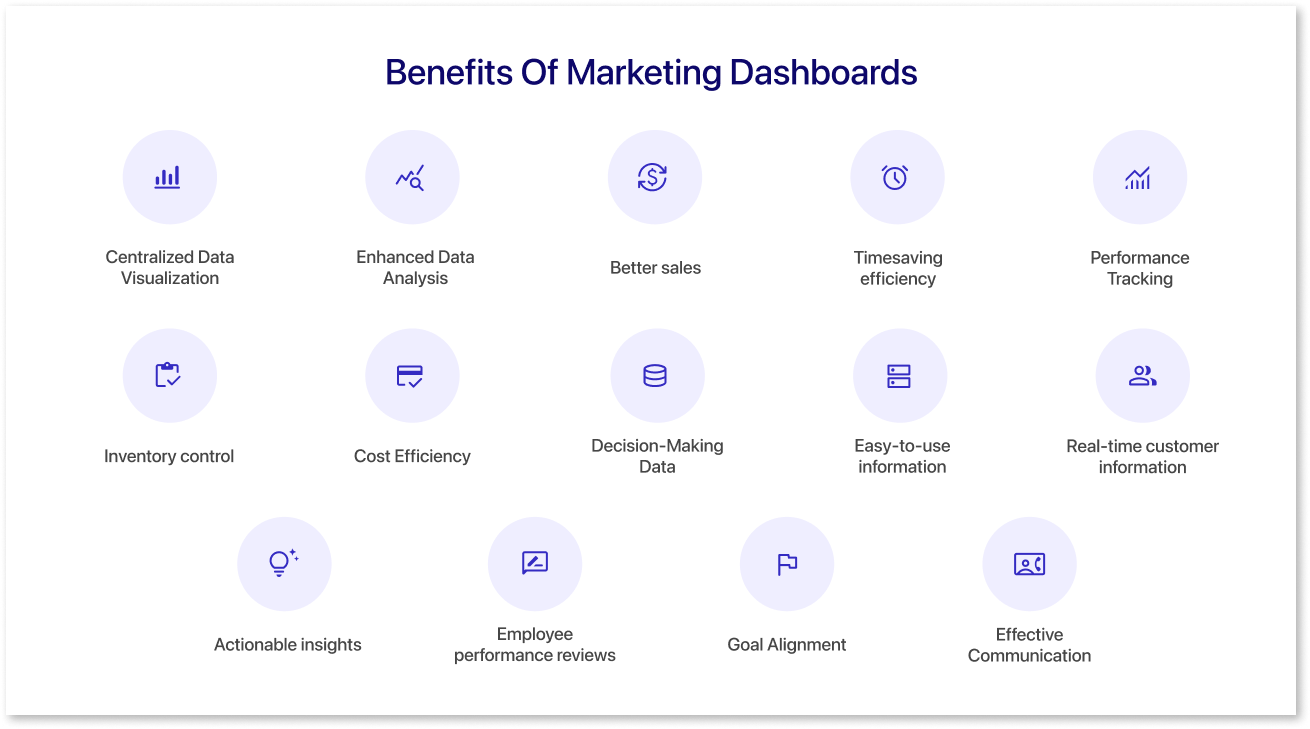
Because many marketing dashboards offer a visual summary of data analysis, they are often easy to interpret and have considerable benefits, including these nine advantages:
1. Marketing Mix Model:
The Marketing Mix Model (MMM) is a powerful tool that can contribute to the success of a marketing dashboard. MMM helps in understanding the impact and effectiveness of various marketing elements or tactics used by the company. By incorporating MMM into a marketing dashboard, you can gain valuable insights into the performance and ROI of your marketing efforts. It also helps in evaluating the effectiveness of different marketing channels, such as digital campaigns, social media, print media, etc.
2. Offer Analysis:
Offer analysis enables you to assess the performance of different offers and promotions in terms of customer response, conversion rates, and revenue generated. By incorporating offer analysis metrics into your marketing dashboard, you can identify which offers are the most effective and optimize your future promotions based on these insights. This also allows you to segment your customer base based on their response to different offers. By analyzing customer behavior and preferences, you can identify specific customer segments that respond better to certain offers.
3. A/B Testing:
A/B testing is a marketing method that compares the effectiveness of two different website versions of advertisement, email, pop-up, or landing pages. By including A/B test results in your marketing dashboard, you can track and visualize the impact of different variations of offers on key metrics such as response rates, conversions, and revenue. This allows you to make data-driven decisions and give insights on how and where to spend your marketing money.
4. Website Health:
Website health monitoring allows marketers to track the user journey within the marketing dashboard. It provides a high-level and summarized understanding of the key metrics that helps analyze the health and performance of your website. This information helps optimize the marketing dashboard's layout, content, and call-to-action elements, enhancing its effectiveness.
5. Performance Tracking:
Tracking the performance of marketing campaigns is crucial for measuring success and identifying areas for improvement. Marketing dashboards provide comprehensive performance-tracking capabilities, allowing you to monitor key metrics and KPIs in real time. From website traffic and conversion rates to social media engagement and email open rates, you can track and evaluate the performance of various channels and campaigns. By having a clear understanding of what works and what doesn't, you can allocate resources effectively, optimize your marketing strategies, and achieve better results.
6. Inventory control:
Inventory management is easier with marketing dashboards because you can measure the sales performance of individual products or stock-keeping units (SKUs). By analyzing sales data at the SKU level, businesses can identify which specific products are selling well and contributing the most to overall revenue. It enables businesses to identify the top-selling products, allocate inventory resources accordingly, and make data-driven decisions to maximize revenue.
7. Cost Efficiency and Resource Optimization:
Marketing dashboards enable you to monitor and optimize your marketing spending more effectively. By tracking the performance of different campaigns and channels, you can identify the most cost-effective strategies and allocate resources accordingly. Dashboards highlight areas of inefficiency, allowing you to eliminate wasteful spending and focus on initiatives that deliver the best returns. This cost efficiency leads to improved marketing ROI and maximizes the impact of limited resources.
8. Influential Decision-Making Data:
Marketing dashboards help you to analyze data quickly and thoroughly, whether for specific metrics to show a product's performance or for generating an overall view of the entire organization. They help make large amounts of data more understandable, and you can select statistics relevant to each business decision, helping you make informed and educated determinations.
9. Customer Journey:
Analyzing the customer journey and identifying touchpoints can be effectively done using a marketing dashboard, allowing businesses to pinpoint drop-off points and enhance those areas. The visual representation of data on a marketing dashboard enables a comprehensive view of the customer's progression and identifies specific stages or channels where customers may abandon the journey. With this knowledge, marketers can make informed decisions on optimizing those areas, such as improving website usability, streamlining the checkout process, or enhancing messaging at critical touchpoints.
10. Real-time customer information:
By capturing real-time data such as website visits, social media interactions, or email engagement, businesses can gain insights into when customers are most active and responsive. This information allows marketers to target their marketing campaigns effectively by scheduling communications and promotions during peak activity periods. By aligning marketing efforts with customer activity patterns, businesses can increase the likelihood of capturing customer attention, improving engagement rates, and driving conversions.
11. Influencer Marketing Analysis:
Analyzing influencer marketing can provide insights into how the money spent on the influencer space impacts ROI and the sentiments generated from those campaigns. To assess ROI, marketers can analyze data such as conversions, sales, website traffic, or social media engagement directly attributed to influencer campaigns. Marketing dashboards can provide visual representations of these data points, allowing marketers to observe trends, make data-driven decisions, and optimize future influencer campaigns.
12. Social Listening:
Use the social listening template to understand consumer sentiment, track brand reputation, evaluate the effectiveness of marketing campaigns, and identify emerging trends or issues. This consolidated view allows businesses to track the performance of their social media campaigns, monitor brand sentiment, and identify trends or issues promptly. These wireframes allow the ability to customize and share dashboards with relevant stakeholders, ensuring that everyone involved has access to the same information.
13. Chatbot Analysis:
Chatbot analysis can provide data on the number of interactions, session duration, and engagement rates. By monitoring these metrics, marketers can assess the effectiveness of their marketing dashboard in attracting and retaining customer attention. Through sentiment analysis and keyword extraction techniques, you can also gain insights into customer satisfaction, identify pain points, and address any issues promptly. User feedback analysis enables marketers to fine-tune their marketing dashboard and improve its overall effectiveness.
14. Email Marketing Analysis:
Email marketing tools provide businesses with a chance to connect with the target audience in a personalized way at an affordable cost. It allows you to track important performance metrics such as open rates, click-through rates, conversion rates, and unsubscribe rates. These metrics help you evaluate the effectiveness of your email campaigns and identify areas for improvement. By analyzing email marketing data, you can segment your audience based on various criteria like demographics, interests, past behavior, or engagement levels.
Conclusion
In conclusion, tracking key metrics is crucial for building a successful marketing dashboard that enables informed decision-making and drives tangible results. The five metrics discussed in this article provide valuable insights across different areas of marketing and help gauge the effectiveness of campaigns and strategies. By monitoring these marketing metrics regularly, you can identify trends, measure progress, and optimize their efforts for maximum impact. Remember, a well-designed marketing dashboard should be tailored to your specific goals and objectives, ensuring that the metrics you track align with your overall marketing strategy. Learn more about how you can use marketing dashboards effectively to align your business needs by using mokkup.ai. With a data-driven approach and a comprehensive understanding of these metrics, you can make informed decisions, allocate resources effectively, and ultimately achieve greater success in your marketing endeavors.
Prompt it. Wireframe it with Mokkup.ai.
