
In the dynamic landscape of data-driven decision-making, the terms "Metrics" and "Key Performance Indicators (KPIs)" are often used interchangeably, leading to confusion about their distinct roles and functionalities. As organizations increasingly rely on data to gauge performance and drive strategic initiatives, understanding the fundamental differences between metrics vs KPIs becomes crucial. This blog aims to unravel the differences, clarifying how these two concepts play distinct but complementary roles in assessing, measuring, and enhancing various aspects of business performance. Let's delve into the world of metrics and KPIs to demystify their definitions, purposes, and practical applications.
Table Of Contents
Defining Metrics and KPIs
Metrics and Key Performance Indicators (KPIs) are foundational performance measurement and analysis elements. Let's begin by defining each term's definitions to comprehend their distinct contributions better.
A. Metrics:
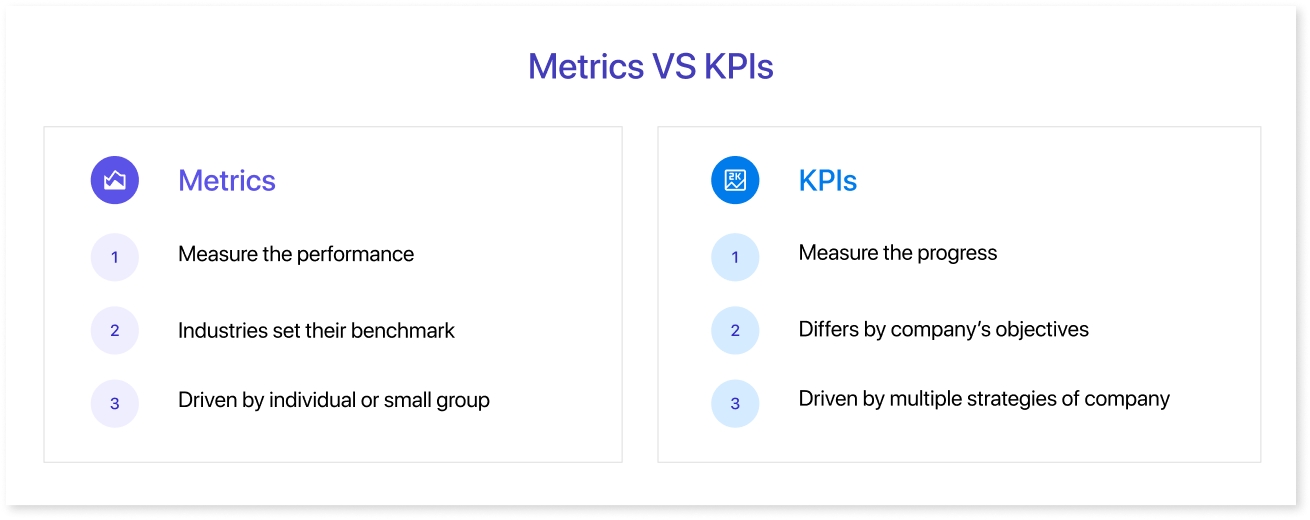
Metrics are quantifiable measures to track, assess, and analyze various aspects of an organization's performance. They provide valuable insights into specific areas, allowing businesses to monitor progress, identify trends, and evaluate the success of operational activities. Metrics can be broad and cover a wide range of data, offering a comprehensive performance overview without necessarily being tied to specific strategic objectives.
B. Key Performance Indicators (KPIs):
On the other hand, Key Performance Indicators are a subset of metrics with a more focused and strategic relevance. KPIs are specifically chosen to align with organizational goals and objectives, serving as critical signposts for success. Unlike general metrics, KPIs provide targeted insights into the performance factors that are most crucial for achieving desired outcomes. They act as actionable and measurable markers, guiding decision-makers toward areas that require attention and improvement.
KPIs vs. Metrics Examples
To further demonstrate the difference between the two terms, let’s check out some examples of both KPIs and metrics.
A. Marketing KPI and Metric Example
Did you know that marketing (alongside sales and finance) is the most monitored and reported operation for performance?
Marketers and business owners establish marketing Key Performance Indicators (KPIs) to effectively evaluate the success of their marketing strategies and assess each channel's performance.
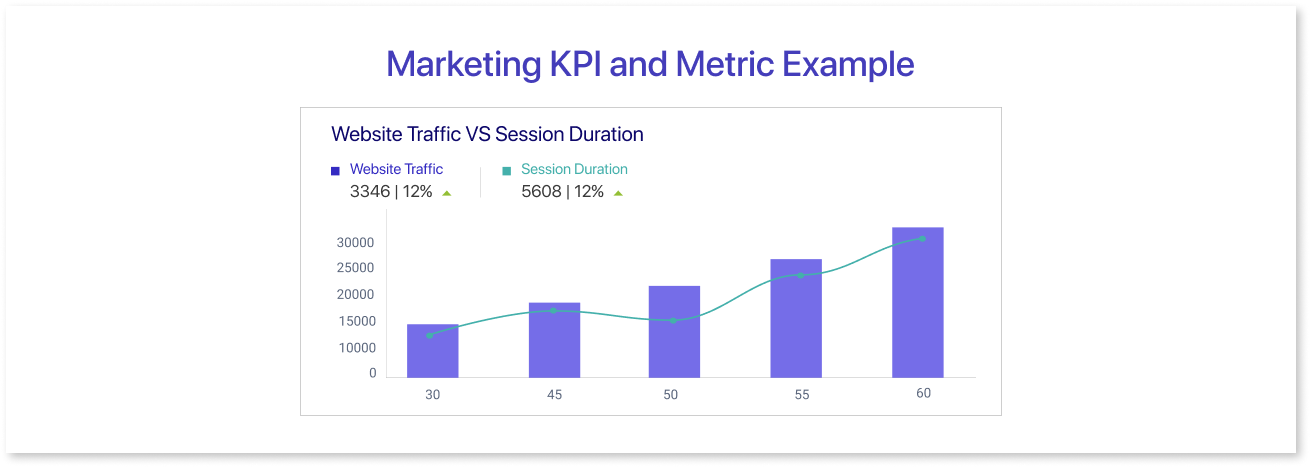
1. KPI: Website Traffic
- One widely recognized marketing KPI example is website traffic.
- Website traffic is a metric to gauge the number of visitors a website attracts. This metric allows you to analyze visitors' volume, sources, and whether they are converting into customers.
- To enhance the practicality of this KPI, you can frame it as follows: "Achieve a 20% increase in website traffic within the next three months."
- While some consider this KPI a vanity metric, given that website views are sometimes undervalued, it provides valuable insights that can be utilized to optimize marketing strategies more effectively.
2. Metric: Average Session Duration
- The metric frequently employed to assess the average time users spend on a website during a single session is known as average session duration.
- This metric is integral to monitoring the "website traffic" Key Performance Indicator (KPI).
- While monitoring progress in increasing website traffic, the average session duration provides insights into whether the attracted visitors are engaging with the content as desired.
- If the average session duration is minimal, mere increases in website traffic may not significantly contribute to conversions, emphasizing the importance of user engagement for successful outcomes.
3. KPI Dashboard Example
- How much daily traffic are you currently generating for your website? Do you know which channels are the primary sources of both the most and the highest-quality visitors? Have you identified the keywords driving organic visits to your site?
- The website traffic Key Performance Indicator (KPI) encompasses various factors that require continuous monitoring to achieve your established goals. Keeping track of metrics such as monthly trends, average bounce rate, and page performance across multiple reports can be a complex task.
- With Mokkup, you can simplify this process. Our Website Health Dashboard Wireframe consolidates all these metrics in one convenient location. This allows you to stay informed about your website traffic KPI efficiently by creating it in a BI tool using Google Analytics as your data source, providing a comprehensive overview of your website's performance.
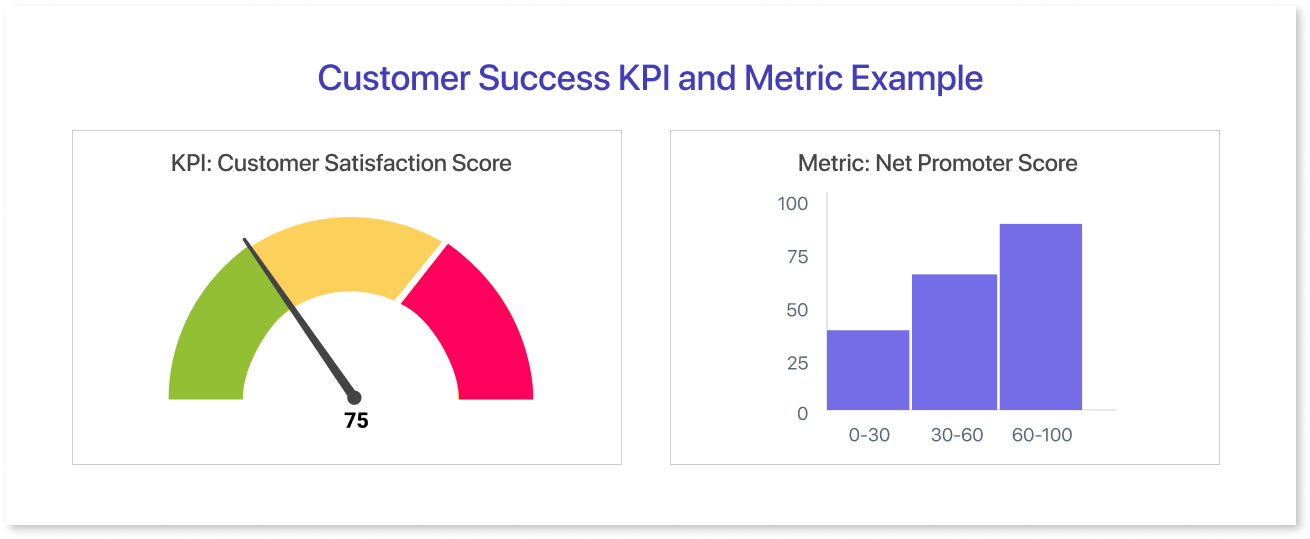
B. Customer Success KPI and Metric Example
Customer success KPIs are used to measure the effectiveness of a customer success team in ensuring customer satisfaction, retention, and overall success.
1. KPI: Customer Satisfaction Score
- The Customer Satisfaction Score serves as a Key Performance Indicator (KPI) gauging the degree of customer contentment with a product, service, or overall interaction with your business. It provides a quantifiable measure of how well a company is fulfilling the needs of its customers.
- This KPI is frequently determined through surveys, feedback forms, or other direct methods that gather customer opinions. Customers may be prompted to rate their satisfaction on a numerical scale or provide qualitative feedback.
2. Metric: Net Promoter Score
- The Net Promoter Score (NPS) is a widely used metric that measures customer loyalty and satisfaction. It gives businesses insights into the likelihood of customers recommending their product or service to others. The NPS is based on a simple survey question that asks customers to rate, on a scale of 0 to 10, how likely they are to recommend the company to a friend or colleague.
- NPS categorizes respondents into Promoters (9-10), Passives (7-8), and Detractors (0-6), representing satisfaction levels. The score, ranging from -100 to +100, is calculated by subtracting detractors from promoters. Higher NPS indicates a greater likelihood of customer advocacy and satisfaction.
- It helps identify areas for improvement by focusing on customer feedback and the factors influencing their likelihood to recommend the brand.
3. KPI Dashboard Example
- Effort score trend, customer trend, customer satisfaction score… there are so many diverse customer success metrics you should be tracking, depending on your exact KPI.
- And the best way to do it is through one comprehensive dashboard, like in the example below.
- This Customer Satisfaction Analysis Dashboard template helps you stay on top of your customer success KPIs and metrics easily by helping you track key insights.
- And the best thing is you can either use this template to replicate in a BI tool or enter your data manually in mokkup, add the metrics you want to track, and turn them into understandable visuals in just a few clicks.
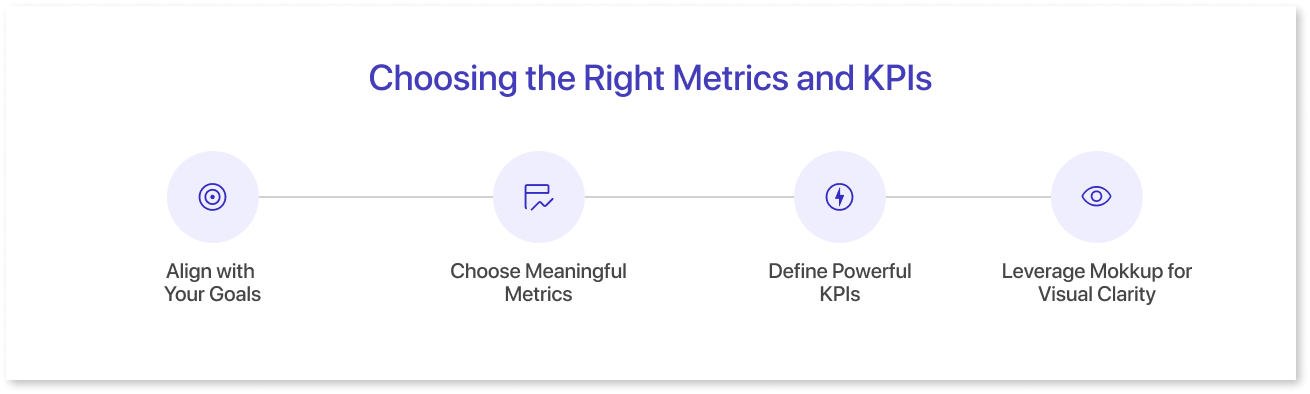
Choosing the Right Metrics and KPIs
Selecting appropriate Metrics and Key Performance Indicators (KPIs) is critical for effective performance measurement and goal alignment. Here's how you can make informed choices and enhance the process with the use of Mokkup:
Step 1: Align with Your Goals
It all begins with your goals. What do you want to achieve? Increase revenue? Improve customer satisfaction? Boost brand awareness? Clearly define your short-term and long-term goals as they will be the North Star for your metric selection.
Step 2: Choose Meaningful Metrics
Now, let's dive into the metrics examples. Remember, not all metrics are created equal. Choose ones that are:
- Relevant: Directly tied to your goals and provide valuable insights into their progress.
- Actionable: Guide decision-making and allow you to take concrete steps to improve performance.
- Measurable: Quantifiable and tracked consistently over time for accurate comparisons.
- Simple and Clear: Easy to understand and interpret by everyone involved.
Step 3: Define Powerful KPIs
KPIs (Key Performance Indicators) are the chosen few, the metrics that truly matter. They are the gauges on your dashboard, giving you a real-time picture of your progress towards your goals. Choose KPI Examples that are:
- Specific: Focus on a single, well-defined aspect of your performance.
- Time-bound: Have a target timeframe for achievement to maintain focus and urgency.
- Attainable: Challenging but achievable to motivate and track progress.
Example: Let's say your goal is to increase website traffic by 20% in the next quarter. A relevant metric could be "unique website visitors," a powerful KPI could be "average daily unique visitors increased by 5% month-over-month."
Step 4: Leverage Mokkup for Visual Clarity
Let's bring your KPI Metrics to life with Mokkup, a cloud-based dashboard wireframing tool. Here's how it can help:
- Create intuitive dashboards: Visually represent your metrics and KPIs using charts, graphs, and gauges for easy comprehension.
- Track progress over time: Showcase trends and highlight areas for improvement through pre-built templates.
- Share insights with stakeholders: Communicate your data story effectively with clear and concise dashboard wireframes.
Imagine a KPI dashboard with a traffic light system indicating if your KPIs are on track, a line graph showing website traffic trends, and a heatmap highlighting top-performing pages. Mokkup.ai makes this visual storytelling a reality.
Summing Up
While metrics and KPIs are performance measurements, they serve distinct purposes. Metrics are like scattered puzzle pieces, providing detailed insights into specific processes or activities. On the other hand, KPIs are the crucial few pieces that form the complete picture, representing key business goals and tracking progress toward achieving them. Think of metrics as the building blocks and KPIs as the finished structure, showing your business performance's how and why. Choosing the right combination is key to unlocking valuable data-driven insights for informed decision-making.
Prompt it. Wireframe it with Mokkup.ai.
