
"Understanding yourself is the beginning of all wisdom." - Aristotle
Dashboards are essential tools for visualizing and analyzing information, but not all dashboards work the same way for everyone. Different people have different preferences and ways of processing information. This blog explores how dashboards can be tailored to suit various Myers-Briggs personality types.
Table of Contents
- What Are the 4 Myers-Briggs Personality Tests?
- The 16 MBTI Personality Types
- How to Create Personalized Dashboards Based On MBTI?
- Best Practices for Designing Dashboards Tailored to MBTI Types
Understanding your personality is key to effective data visualization. This blog explores how to align dashboard designs with different Myers-Briggs types, ensuring data resonates with individual preferences. Whether detail-focused or creatively inclined, discover best practices for designing dashboards tailored to MBTI types, making your data more engaging and user-friendly.
What Are the 4 Myers-Briggs Personality Tests?
The Myers-Briggs Type Indicator (MBTI) is a popular personality assessment that helps people understand their own and others' personalities. It categorizes individuals into 16 distinct personality types based on four key dimensions.
- Extraversion (E) vs. Introversion (I)
- Sensing (S) vs. Intuition (N)
- Thinking (T) vs. Feeling (F)
- Judging (J) vs. Perceiving (P)
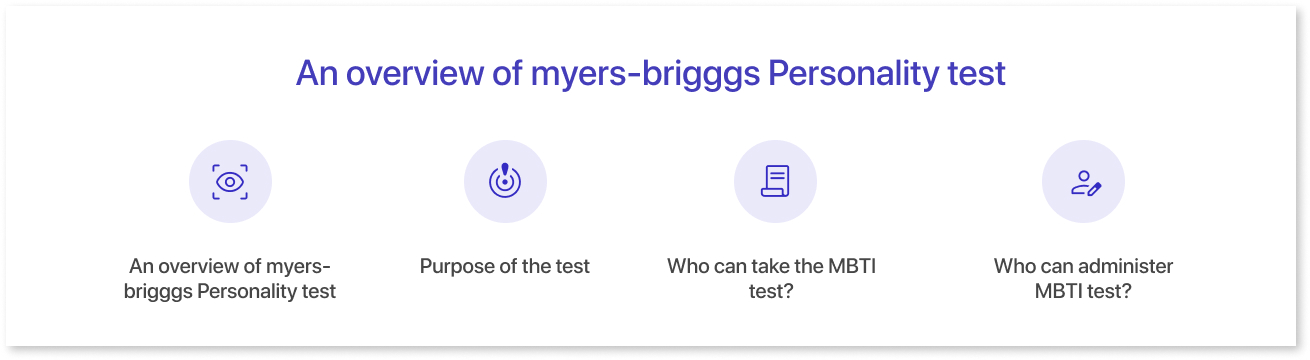
The MBTI is based on Carl Jung's theory of psychological types, which Isabel Briggs Myers and her mother, Katharine Cook Briggs, later expanded. It is widely used in personal development, career counseling, and team building.
Explanation of the eight dimensions:
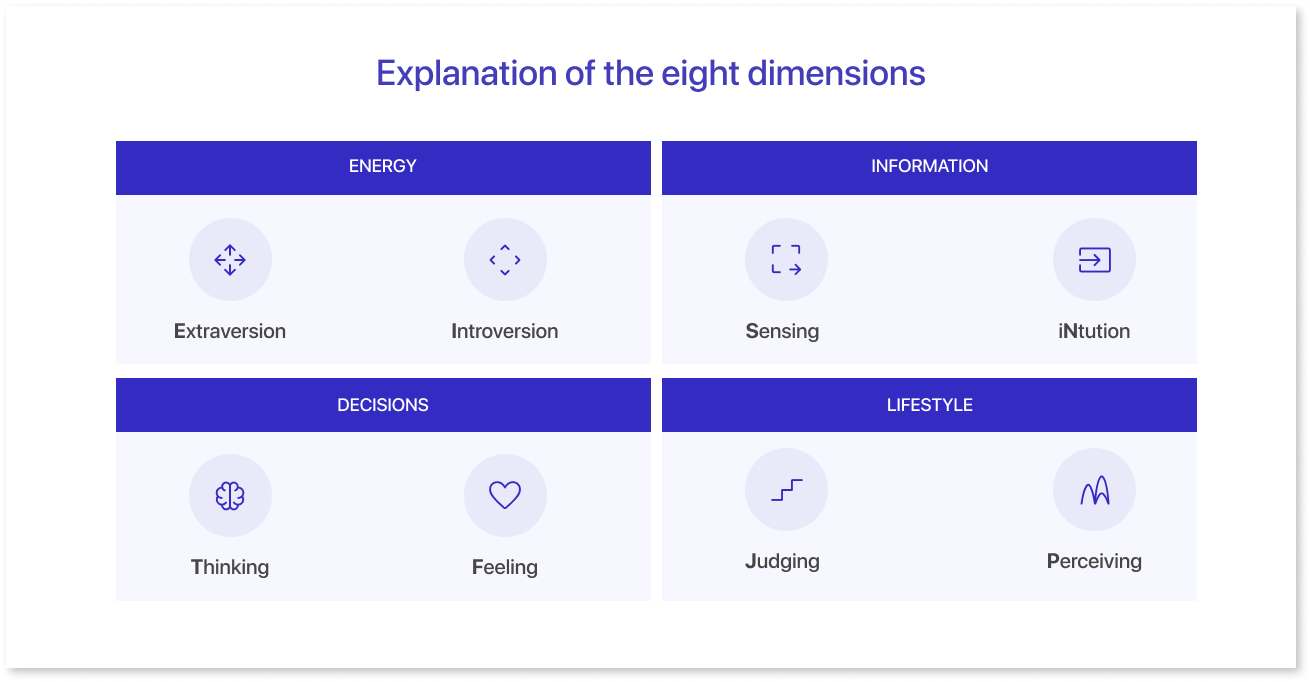
| Dimensions | Description |
| Extraversion (E) | People who are energized by interacting with others and the external world. |
| Introversion (I) | People who are energized by spending time alone and reflecting on their thoughts and experiences. |
| Sensing (S) | People who focus on concrete information and details they can see, hear, or touch. |
| Intuition (N) | People who focus on patterns, possibilities, and the big picture. |
| Thinking (T) | People who make decisions based on logic, objectivity, and impersonal criteria. |
| Feeling (F) | People who make decisions based on personal values, empathy, and the impact on others. |
| Judging (J) | People who prefer structure, organization, and planned approaches. |
| Perception (P) | People who prefer flexibility, spontaneity, and open-ended approaches. |
The 16 MBTI Personality Types
The most common Myers Briggs Type Indicator (MBTI) categorizes people into 16 personality types. Each type is a unique combination of dimensions. These combinations help us understand how people gather information, make decisions, and interact with the world.
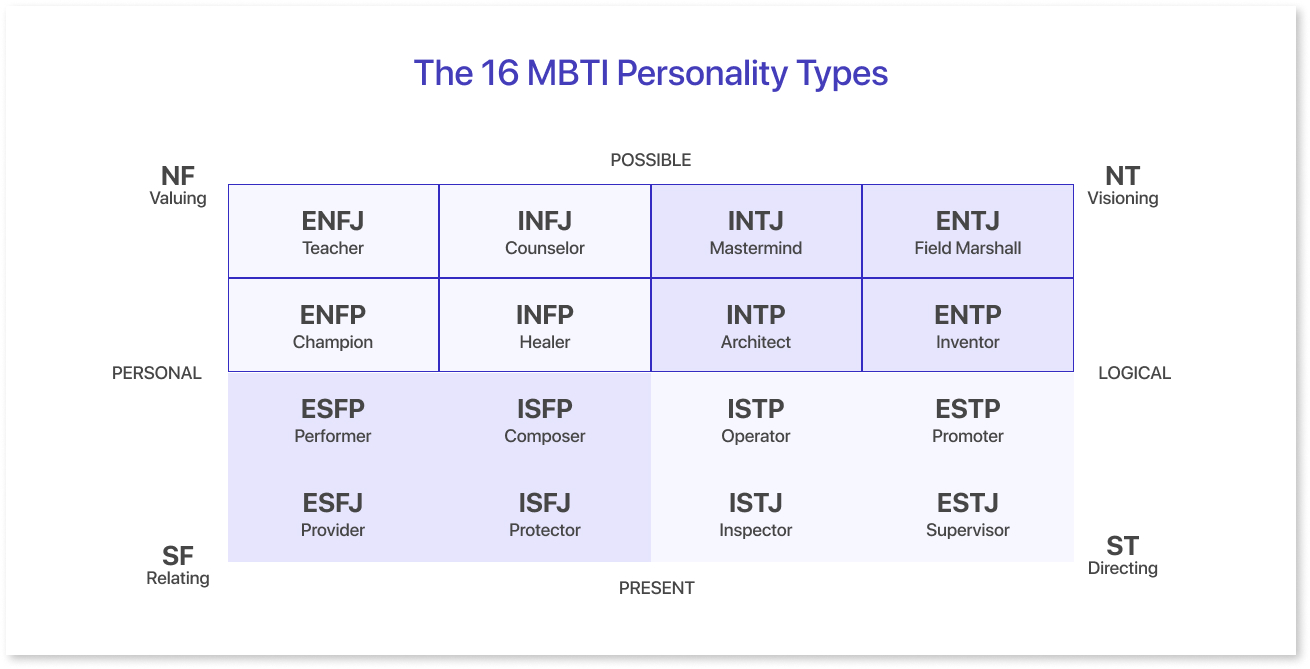
Here is a brief overview of each type and how it can be useful for creating effective dashboards:
- ISTJ (Introversion, Sensing, Thinking, Judging): Practical, detail-oriented, and organized. Dashboards for ISTJs should be clear, concise, and structured, with reliable data.
- ISFJ (Introversion, Sensing, Feeling, Judging): Supportive, meticulous, and traditional. Dashboards for ISFJs should include well-organized information focusing on details and user-friendly ux design.
- INFJ (Introversion, Intuition, Feeling, Judging): Insightful, creative, and idealistic. Dashboards for INFJs should highlight patterns and trends and provide a holistic view of the data.
- INTJ (Introversion, Intuition, Thinking, Judging): Strategic, analytical, and independent. Dashboards for INTJs should offer valuable insights, logical structure, and strategic information.
- ISTP (Introversion, Sensing, Thinking, Perception): Observant, problem-solving, and flexible. Dashboards for ISTPs should be interactive and adaptable, allowing for data exploration.
- ISFP (Introversion, Sensing, Feeling, Perception): Artistic, sensitive, and spontaneous. Dashboards for ISFPs should be visually appealing, focusing on immediate and concrete data.
- INFP (Introversion, Intuition, Feeling, Perception): Imaginative, empathetic, and open-minded. Dashboards for INFPs should be flexible, allowing for customization and creative exploration of data.
- INTP (Introversion, Intuition, Thinking, Perception): Innovative, curious, and logical. Dashboards for INTPs should provide deep data analysis and opportunities for exploration and hypothesis testing.
- ESTP (Extraversion, Sensing, Thinking, Perception): Energetic, pragmatic, and spontaneous. Dashboards for ESTPs should be interactive, with real-time data and opportunities for quick decision-making.
- ESFP (Extraversion, Sensing, Feeling, Perception): Sociable, fun-loving, and spontaneous. Dashboards for ESFPs should be engaging, colorful, and easy to navigate, with immediate access to key data points.
- ENFP (Extraversion, Intuition, Feeling, Perception): Enthusiastic, creative, and open-minded. Dashboards for ENFPs should be flexible, visually appealing, and allow for exploration of possibilities.
- ENTP (Extraversion, Intuition, Thinking, Perception): Inventive, curious, and strategic. Dashboards for ENTPs should offer in-depth analysis, interactive features, and opportunities for innovative insights.
- ESTJ (Extraversion, Sensing, Thinking, Judging): Practical, efficient, and organized. Dashboards for ESTJs should be structured, reliable, and focused on clear, actionable data.
- ESFJ (Extraversion, Sensing, Feeling, Judging): Warm, caring, and organized. Dashboards for ESFJs should be user-friendly, with well-organized information and a focus on people-related data.
- ENFJ (Extraversion, Intuition, Feeling, Judging): Charismatic, insightful, and organized. Dashboards for ENFJs should highlight patterns and trends, focusing on the big picture and user engagement.
- ENTJ (Extraversion, Intuition, Thinking, Judging): Strategic, logical, and assertive. Dashboards for ENTJs should provide strategic insights, clear structure, and opportunities for decision-making based on comprehensive data.
How to Create Personalized Dashboards Based On MBTI?
Tailoring dashboard design to different personality types can greatly enhance their usability. Each person interacts with data in unique ways, and these differences are often influenced by their personality.
For instance, analytical thinkers might prefer detailed charts and data-heavy visuals. While more intuitive types might favor simplified, big-picture overviews. Understanding these preferences allows for creating dashboards that cater to a wider audience, making data more accessible and engaging for everyone. Dashboards become more user-friendly by incorporating elements that resonate with different personalities, such as interactive features for the curious or concise summaries for the time-pressed.
Tailoring Dashboards to Specific Personality Types
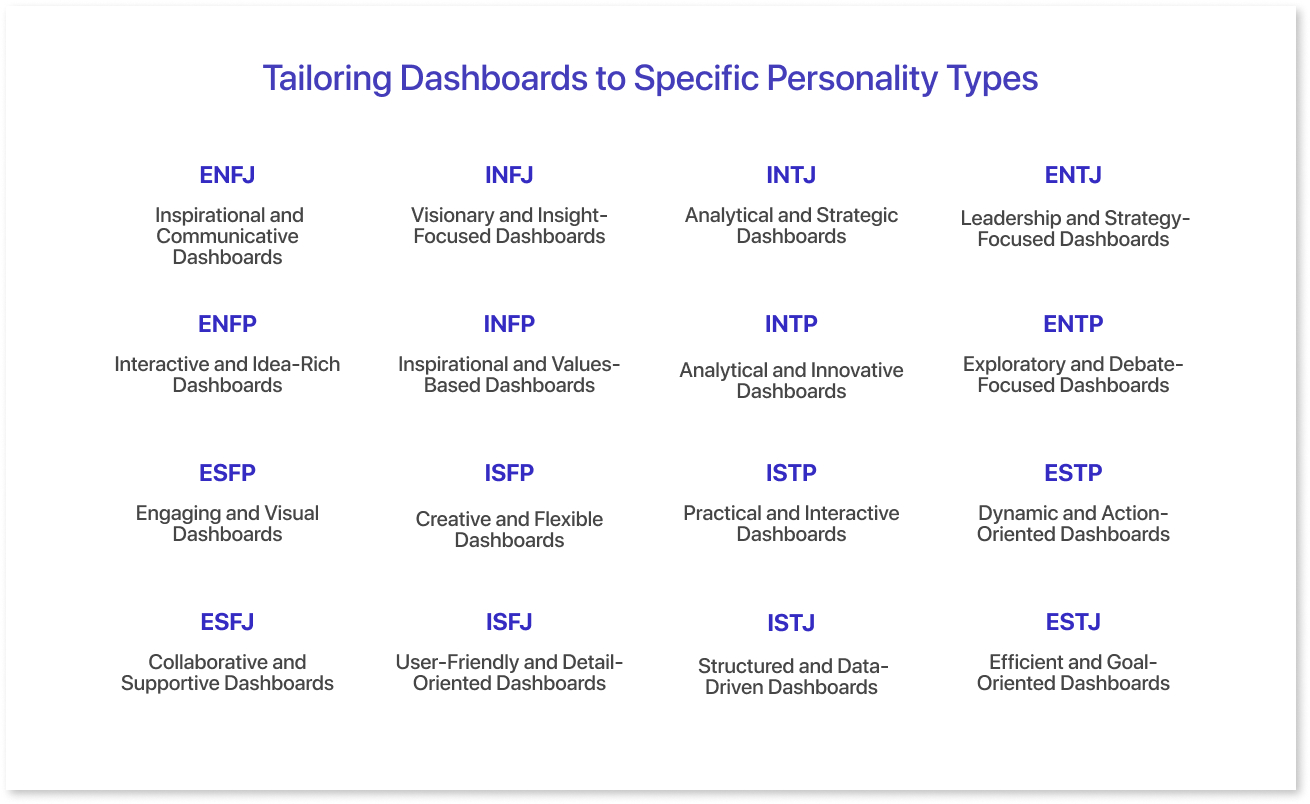
- ISTJ: Structured and Data-Driven Dashboards - A financial dashboard with organized sections for budget tracking, expense reports, and financial forecasts.
- ISFJ: User-Friendly and Detail-Oriented Dashboards - A customer service dashboard with detailed customer interaction logs, feedback summaries, and easy navigation.
- INFJ: Visionary and Insight-Focused Dashboards - A project planning dashboard with long-term vision charts, goal-tracking, and insight reports on progress.
- INTJ: Analytical and Strategic Dashboards - A business strategy dashboard with competitive analysis, market trend graphs, and strategic planning tools.
- ISTP: Practical and Interactive Dashboards - An engineering dashboard with interactive schematics, real-time data feeds, and practical tools for troubleshooting.
- ISFP: Creative and Flexible Dashboards - A marketing campaign dashboard with customizable templates, creative performance metrics, and flexible design options.
- INFP: Inspirational and Values-Based Dashboards - A non-profit impact dashboard with inspirational stories, value alignment metrics, and donor engagement visuals.
- INTP: Analytical and Innovative Dashboards - A research dashboard with innovative data visualization tools, hypothesis testing sections, and analytical reports.
- ESTP: Dynamic and Action-Oriented Dashboards - A sales performance dashboard with real-time sales tracking, dynamic goal-setting.
- ESFP: Engaging and Visual Dashboards - An event planning dashboard with colorful visual timelines, engagement metrics, and interactive planning tools.
- ENFP: Interactive and Idea-Rich Dashboards - A brainstorming dashboard with idea clouds, interactive mind maps, and collaborative voting features.
- ENTP: Exploratory and Debate-Focused Dashboards - A debate dashboard with argument mapping, interactive discussion forums, and exploratory data analysis.
- ESTJ: Efficient and Goal-Oriented Dashboards - An operational efficiency dashboard with goal tracking, productivity metrics, and streamlined task management.
- ESFJ: Collaborative and Supportive Dashboards - A team collaboration dashboard with shared calendars, support ticket tracking, and team feedback sections.
- ENFJ: Inspirational and Communicative Dashboards - A leadership communication dashboard with inspirational messaging tools, team engagement metrics, and communication tracking.
- ENTJ: Leadership and Strategy-Focused Dashboards - A corporate strategy dashboard with leadership KPIs, strategic initiative tracking, and performance reviews.
Best Practices for Designing Dashboards Tailored to MBTI Types
Creating effective dashboards for different Myers-Briggs personality types involves tailoring the layout, wide range of color schemes, visual elements, data presentation, and interactivity to suit each type's preferences. Here are some best practices for designing dashboards for each personality type:
| MBTI Type | Layout | Color Scheme | Visual Elements | Pro Tip |
| ISTJ | Clean and organized with clear sections. | Neutral and professional colors. | Simple charts and graphs. | Focus on precise and detailed data. Ensure the dashboard is reliable and easy to navigate. |
| ISFJ | Structured and user-friendly. | Soft, calming colors. | Clear and detailed visuals. | Emphasize data accuracy and provide a logical flow of information. Include helpful annotations. |
| INFJ | Intuitive and holistic. | Warm and inspirational colors. | Infographics and trend lines | Highlight patterns and trends. Make the dashboard visually appealing and thought-provoking. |
| INTJ | Strategic and logical. | Darker, sophisticated colors. | Complex charts and data models. | Provide deep insights and strategic information. Ensure the dashboard is well-structured and analytical. |
| ISTP | Flexible and dynamic. | Bold and contrasting colors. | Interactive graphs and tables. | Allows for data exploration and alteration. Keep the dashboard adaptable and engaging. |
| ISFP | Simple and aesthetically pleasing. | Natural and soothing colors. | High-quality images and simple charts. | Focus on visual appeal and concrete data. Make the dashboard user-friendly and visually delightful. |
| INFP | Creative and flexible. | Bright and imaginative colors. | Infographics and creative visuals. | Encourage exploration and customization. Make the dashboard inspiring and open-ended. |
| INTP | Logical and exploratory. | Cool-toned colors. | Detailed charts and graphs. | Provide opportunities for deep data analysis. Ensure the dashboard is interactive and data-rich. |
| ESTP | Engaging and interactive. | Vibrant and energetic colors. | Real-time data and interactive visuals. | Focus on quick data access and interactivity. Make the dashboard dynamic and action-oriented. |
| ESFP | Fun and lively. | Bright and cheerful colors. | Colorful charts and engaging visuals. | Ensure easy navigation and immediate access to key data. Make the dashboard enjoyable and visually engaging. |
| ENFP | Open and flexible. | Bold and imaginative colors. | Creative and varied visuals. | Allow for exploration and creativity. Make the dashboard visually stimulating and versatile. |
| ENTP | Innovative and strategic. | Bright and contrasting colors. | Complex visuals and interactive elements. | Encourage innovative insights and strategic thinking. Make the dashboard highly interactive and exploratory. |
| ESTJ | Structured and efficient. | Neutral and professional colors. | Clear charts and tables. | Focus on actionable data and reliability. Make the dashboard organized and easy to interpret. |
| ESFJ | Organized and user-friendly. | Warm and welcoming colors. | Clear visuals and detailed information. | Ensure the dashboard is accessible and easy to use. Emphasize clarity and detail. |
| ENFJ | Inspirational and clear. | Warm and bright colors. | Trend lines and infographics. | Highlight patterns and trends. Make the dashboard engaging and easy to understand. |
| ENTJ | Strategic and organized. | Strong and professional colors. | Detailed charts and strategic visuals. | Provide comprehensive data and strategic insights. Ensure the dashboard is clear and decisive. |
Final Thoughts
Understanding MBTI personality test within a dashboard design ensures more intuitive and user-centric design interfaces that cater to diverse cognitive preferences. By considering personality types, you can create dashboards that truly resonate with your audience. Start refining your dashboard designs with Mokkup.ai today and see the difference personalized dashboards can make.
Prompt it. Wireframe it with Mokkup.ai.
