
What is a Water Treatment & Purification Executive Dashboard?
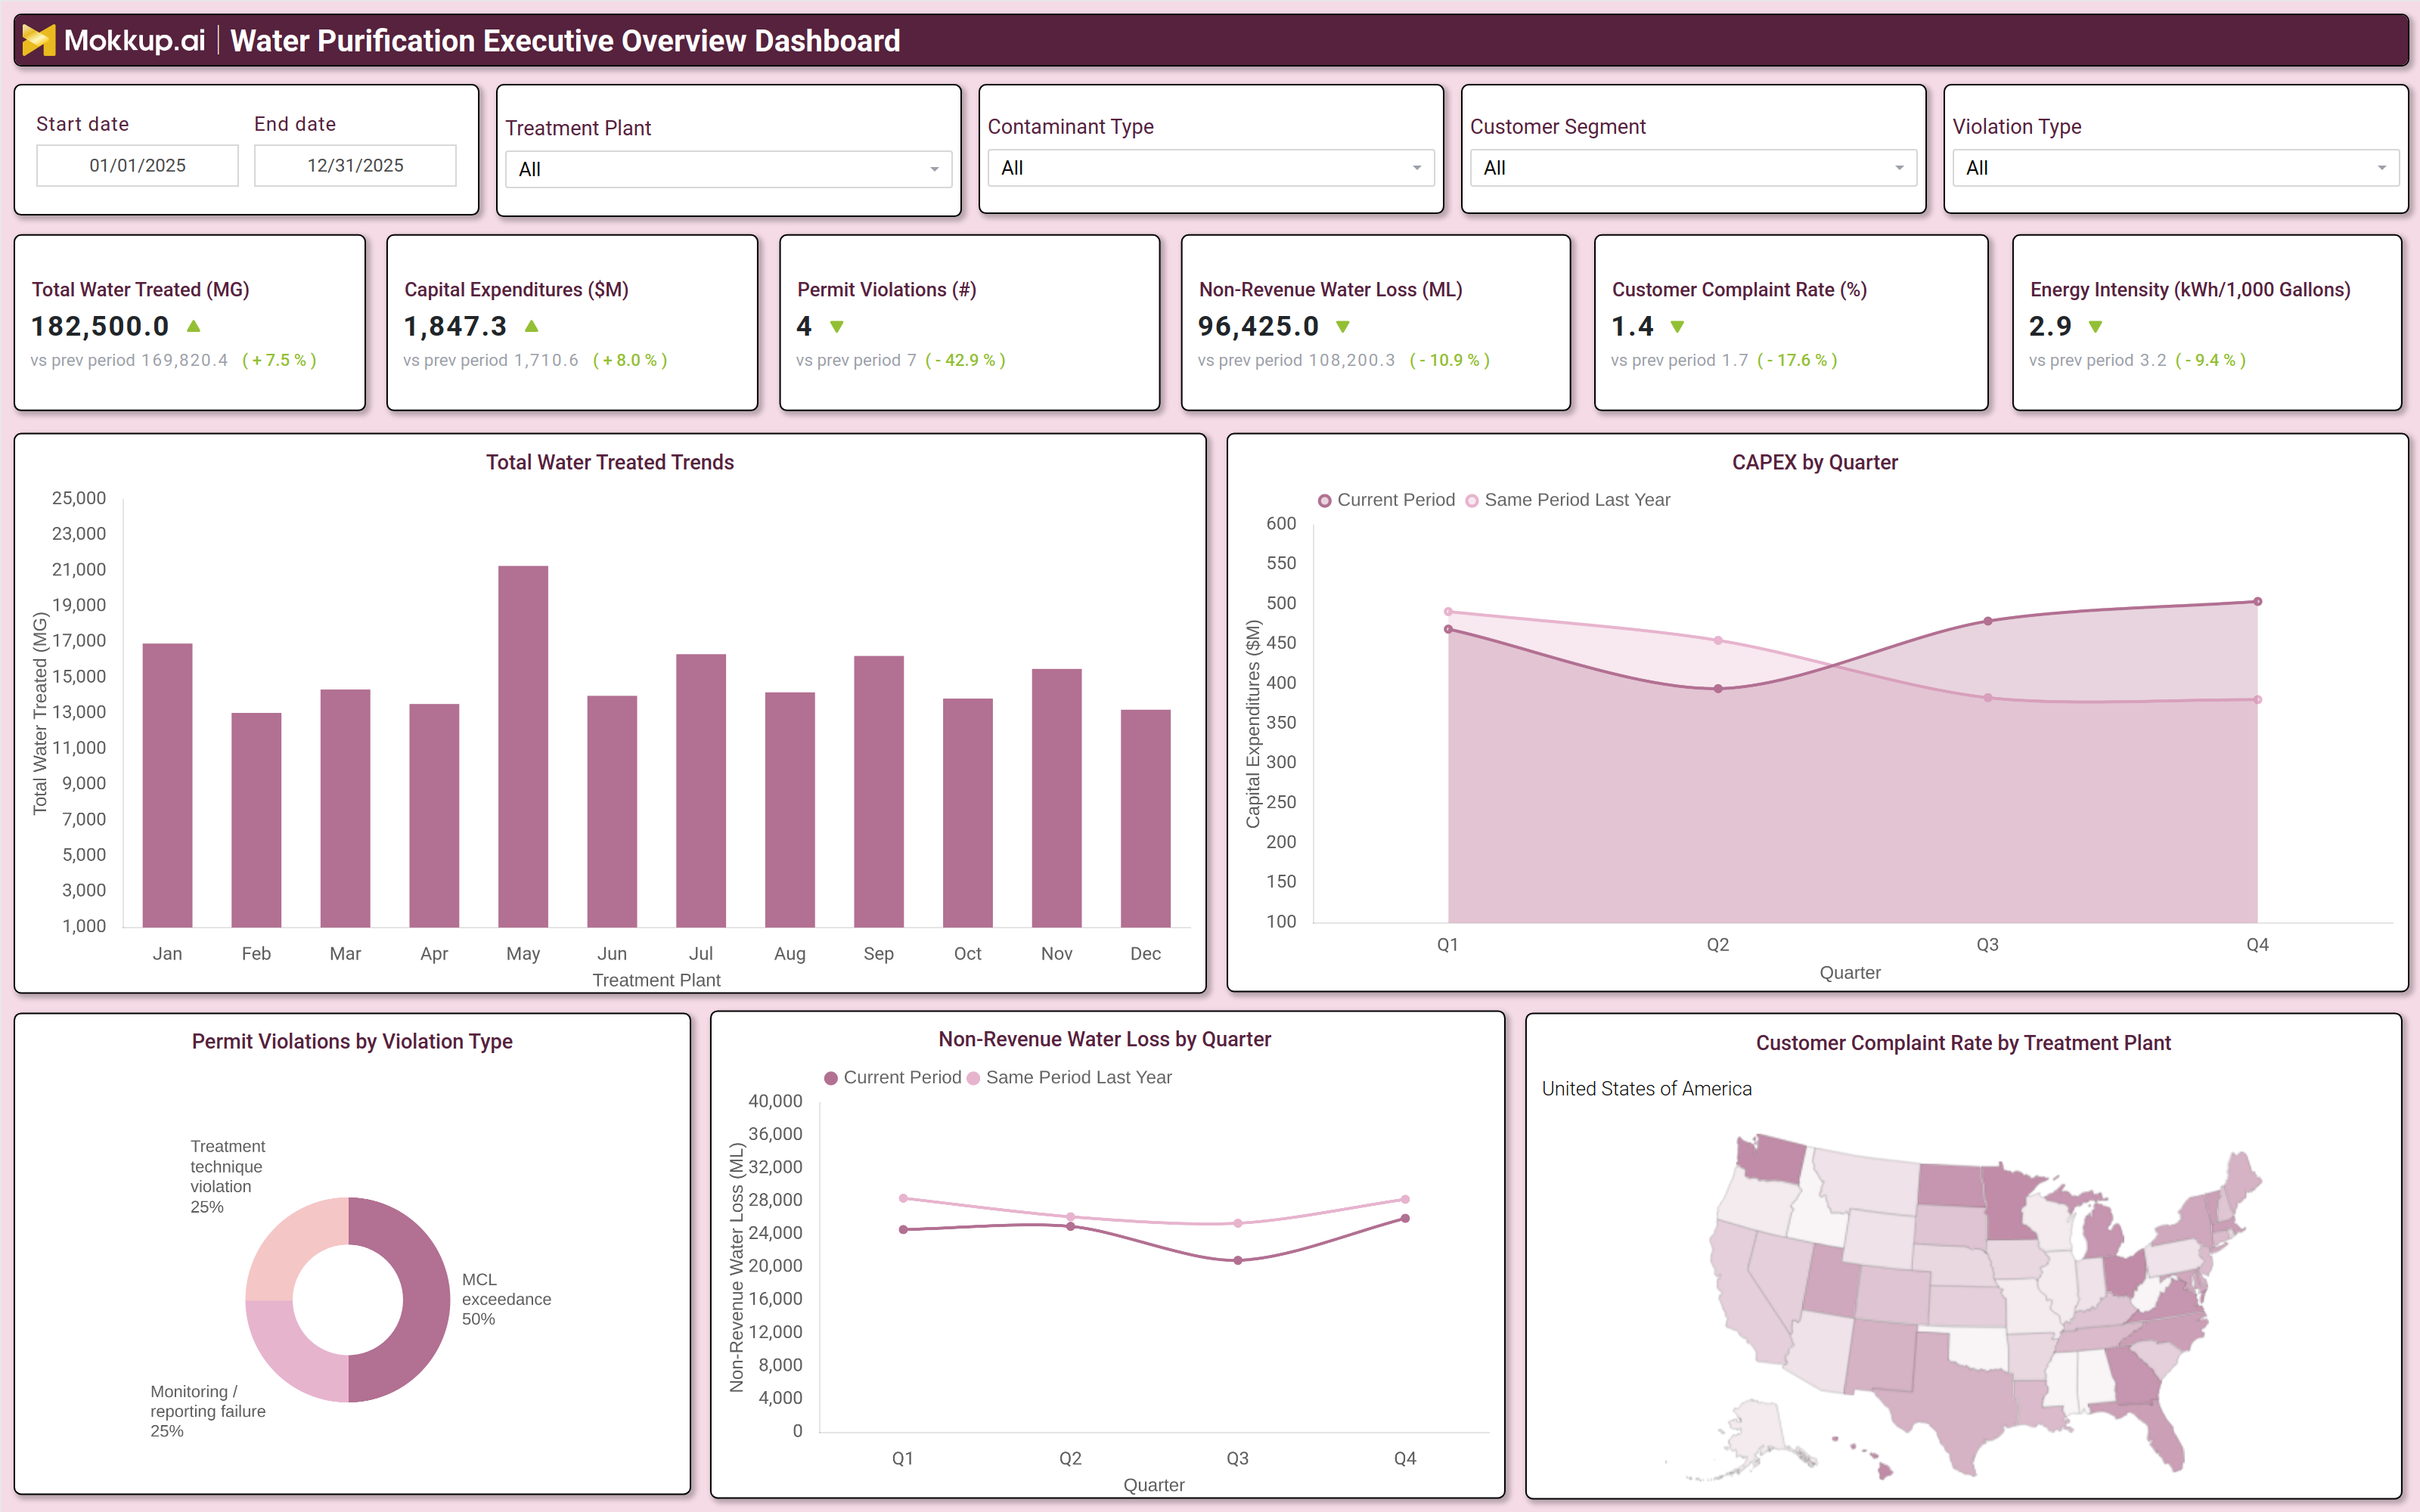
A water treatment executive performance dashboard gives utility directors, operations managers, and compliance teams a unified view of how treatment plants are performing across throughput, capital investment, regulatory compliance, and customer service quality. It tracks KPIs, including total water treated, permit violations, non-revenue water loss, and customer complaint rate along side energy intensity water treatment benchmarking metrics that reveal how efficiently each facility is converting inputs into safe, delivered water.
Capital expenditure trends round out the picture, allowing leadership to monitor whether infrastructure investment is keeping pace with operational demands. Municipal utilities, regional water authorities, and multisite treatment operators use this template to align executive oversight with operational realities across their full facility portfolio.
How to Create a Water Treatment & Purification Executive Dashboard
You don’t need to build your report from scratch, just start with a ready-to-use Water Purification Executive Overview dashboard template from Mokkup. Add in your data and export it however you like. Here’s how to do it:
1. Create or Log in to Your Mokkup Account
Start by signing up on Mokkup.ai using your email. If you already have an account, just log in, and you'll be good to go.
2. Choose and Customize Your Dashboard Template
Find the Water Purification Executive Overview Dashboard Dashboard template in the Templates section. Use the drag and drop editor to adjust KPIs, edit filters, or add elements based on your data.
3. Export to Your BI Tool
Once your dashboard wireframe is ready, use the BI Tool Export feature to send it directly to Power BI or Tableau for further analysis and enhancements. You can also download the dashboard as a PDF, PNG, or JPEG, embed it on a platform, or invite your team to collaborate.
Note: This is a Pro template. You'll need a Pro subscription on Mokkup to use and customize this dashboard wireframe. Upgrade anytime to unlock full access.
Water Purification Executive Overview Dashboard Example
Executive teams use this dashboard to monitor treatment throughput, compliance status, water loss, and service quality across all facilities. KPI tiles provide a quick snapshot of operational performance, while Treatment Plant and Violation Type filters help narrow analysis to specific facilities or compliance issues. Compliance teams use the violation breakdown to identify whether MCL exceedances, monitoring failures, or treatment technique violations are driving current risks and prioritize corrective actions before audits.
Capital planning teams review quarterly CAPEX trends against prior-year performance to guide infrastructure investment and project scheduling decisions. At the same time, operations teams track non-revenue water loss to measure distribution efficiency and leakage reduction progress. Regional managers and customer service teams use the complaint rate map to identify high-risk service areas and prioritize targeted quality improvement initiatives
How to Analyze Data in a Water Treatment & Purification Executive Dashboard
Here is how you can analyze data from this dashboard:
- Filter by Treatment Plant: Compare individual facility performance against portfolio averages.
- Track Water Treatment Trends: Review throughput trends to identify spikes or declines in production.
- Monitor Permit Violations: Use the KPI tile to assess whether compliance performance is improving.
- Analyze Water Loss: Compare quarterly non-revenue water loss against prior-year performance.
- Review Customer Complaints: Use the geographic map to identify plants with higher complaint rates.
- Identify Violation Drivers: Analyze violation types to pinpoint key compliance risks.
- Focus on High-Risk Categories: Filter by violation type to prioritize audit and remediation efforts.
- Measure Energy Efficiency: Track energy intensity trends to benchmark treatment efficiency.
Benefits of a Water Treatment & Purification Executive Dashboard
The following are the benefits of using this dashboard:
- Centralized Executive Visibility: Combines throughput, compliance, water loss, and CAPEX metrics in one view.
- Comprehensive Compliance Monitoring: Tracks permit violations across plants and contaminant categories.
- Reduced Reporting Effort: Prebuilt KPIs and charts simplify executive and regulatory reporting.
- Better Investment Planning: Supports plant-level CAPEX analysis and infrastructure decisions.
- Targeted Remediation Insights: Highlights violation categories for compliance prioritization.
- Regulatory Alignment: Helps teams maintain compliance without rebuilding reports each cycle.
- Shared Operational View: Aligns operations, compliance, and leadership teams around performance metrics.
KPIs to Track in a Water Treatment & Purification Executive Dashboard
The following key KPIs can be tracked by using this dashboard:
- Total Water Treated (MG): Central to any water treatment executive performance dashboard measures total volume of water processed across all treatment plants in the reporting period, the baseline against which all efficiency metrics are calculated.
- Capital Expenditures ($M): Tracks total infrastructure investment deployed across the facility portfolio essential for capital expenditure water utility management and quarterly spend versus plan comparison.
- Permit Violations (#): Counts the total number of regulatory permit violations recorded as the primary indicator for permit violations water treatment monitoring and compliance risk assessment.
- Non-Revenue Water Loss (ML): Measures the volume of treated water lost before billing due to leakage, metering errors, or unauthorized use the key metric for non revenue water loss quarterly tracking and distribution system performance.
- Customer Complaint Rate (%): Evaluates the share of service interactions resulting in a customer complaint rate water treatment concern directly tied to service quality benchmarking and plant level improvement programs.
- Energy Intensity (kWh/1,000 Gallons): Tracks energy consumed per thousand gallons of water treated supporting energy intensity water treatment benchmarking across facilities and identifying where process efficiency gains are available.
Frequently Asked Questions
Q1. What teams use a Water Treatment & Purification Executive Dashboard?
This dashboard is used by utility directors, operations managers, regulatory compliance officers, capital planning teams, and customer service leadership at municipal water utilities and multi site treatment authorities.
Q2. How does this dashboard improve regulatory compliance and audit readiness?
By surfacing permit violation counts and violation type breakdowns alongside trend data, compliance teams can identify which regulatory categories pose the greatest risk, prioritize remediation actions, and arrive at audit reviews with documented evidence of improvement over time.
Q3. Can this dashboard track capital expenditure performance against prior year benchmarks?
Yes, the CAPEX by Quarter area chart compares current period capital expenditure against the same period last year, enabling capital planning teams to assess spending pace, flag under or over deployment, and adjust project timelines accordingly.