What is a Water Supply Distribution Pressure & Supply Reliability Dashboard?
A Water Supply Distribution Pressure & Supply Reliability Dashboard is an operational analytics solution used by water utilities to monitor network pressure stability, supply continuity, water loss, service complaints, and restoration performance across water distribution systems. This dashboard helps utilities maintain stable water pressure, reduce supply disruptions, and improve customer service reliability. A water supply distribution pressure monitoring dashboard provides real-time visibility into network performance and operational risks across multiple supply regions and distribution segments. The dashboard combines pressure monitoring, supply reliability tracking, complaint analysis, outage restoration metrics, and distribution demand analytics into a centralized platform. Utilities use this solution to identify pressure fluctuation incidents, monitor non-revenue water losses, improve restoration response times, and optimize distribution network performance. A water supply reliability performance analytics dashboard supports proactive infrastructure management and helps maintain consistent water delivery across residential, commercial, industrial, and institutional supply networks.
How to Create a Water Supply Distribution Pressure & Supply Reliability Dashboard
You don't need to build your report from scratch, just start with a ready-to-use dashboard template from Mokkup. Add in your data and export it however you like. Here's how to do it:
1. Create or Log in to Your Mokkup Account
Start by signing up on Mokkup.ai using your email. If you already have an account, just log in, and you'll be good to go.
2. Choose and Customize Your Dashboard Template
Find the Water Supply Distribution Pressure & Supply Reliability Dashboard template in the Templates section. Use the drag-and-drop editor to adjust KPIs, edit filters, or add elements based on your data.
3. Export to Your BI Tool
Once your dashboard wireframe is ready, use the BI Tool Export feature to send it directly to Power BI or Tableau for further analysis and enhancements. You can also download the dashboard as a PDF, PNG, or JPEG, embed it on a platform, or invite your team to collaborate.
Note: This is a Pro template. You'll need a Pro subscription on Mokkup to use and customize this dashboard wireframe. Upgrade anytime to unlock full access.
Water Supply Distribution Pressure & Supply Reliability Dashboard Example
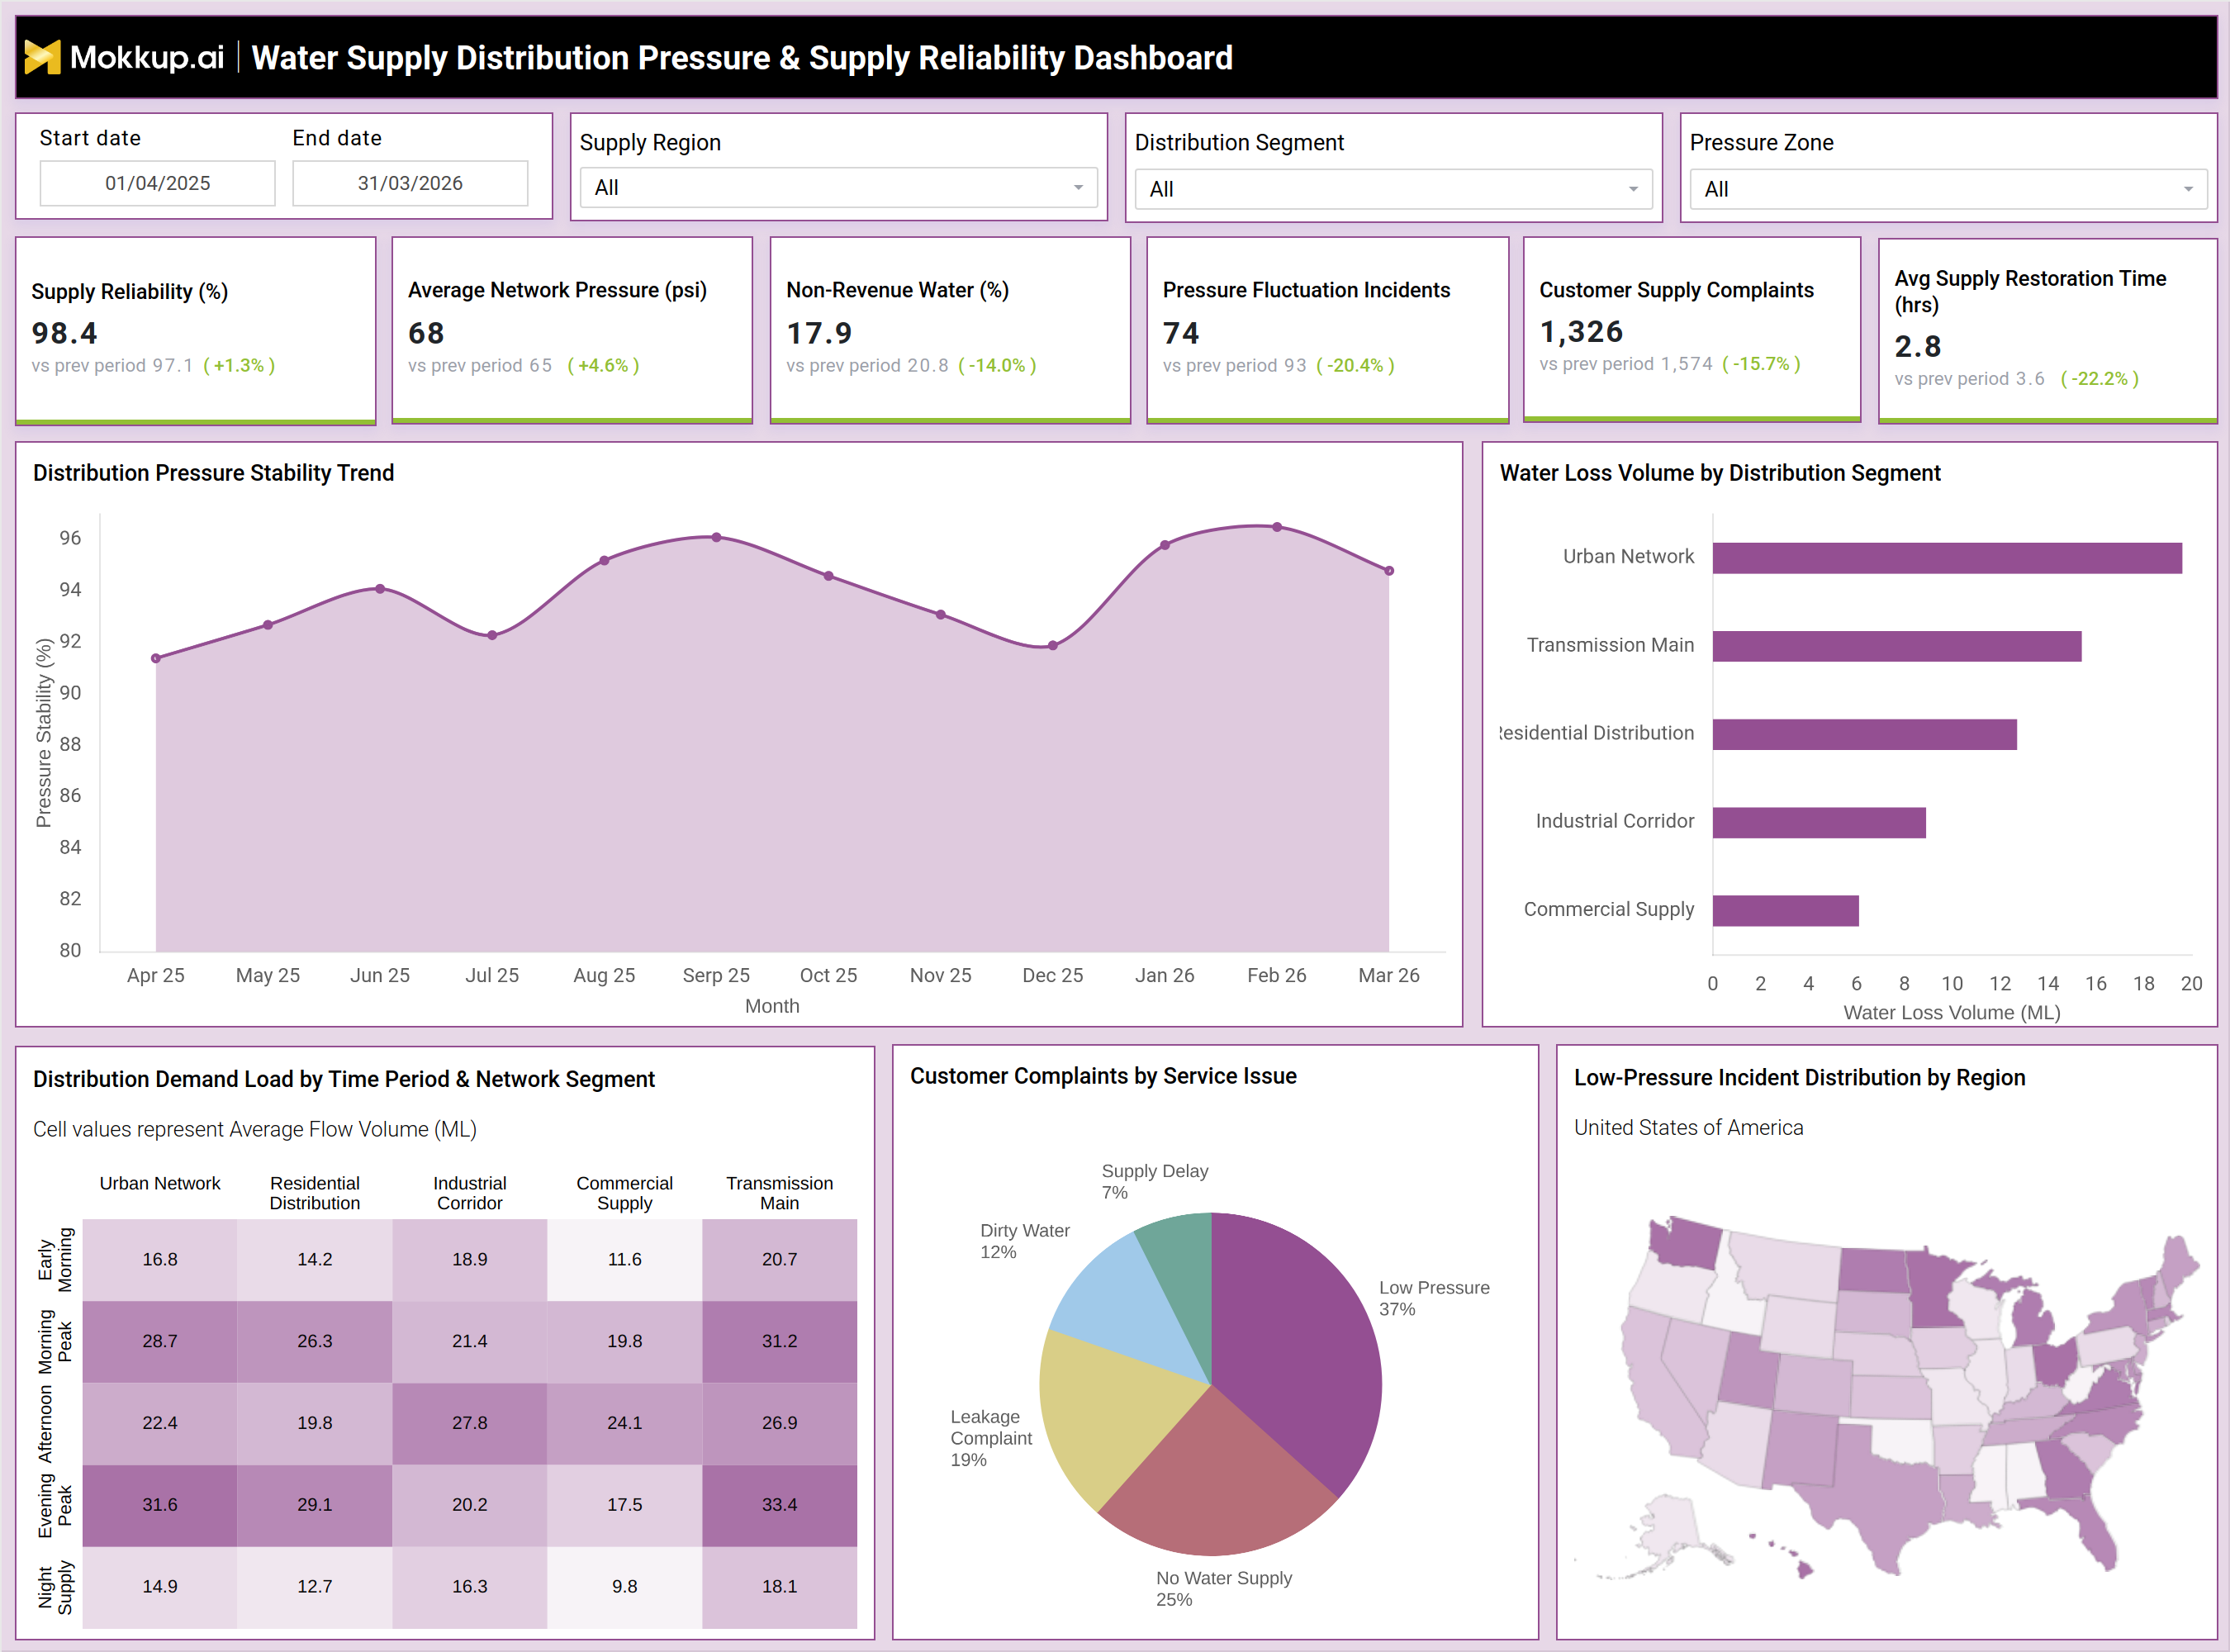
The dashboard example above demonstrates how water utilities can monitor pressure stability and supply reliability across distribution networks. The KPI section highlights Supply Reliability (%), Average Network Pressure (psi), Non-Revenue Water, Pressure Fluctuation Incidents, Customer Supply Complaints, and Average Supply Restoration Time (hrs). These metrics provide a high-level operational overview of network performance and service continuity. The Distribution Pressure Stability Trend visual tracks pressure consistency across the network over time and helps utilities identify instability periods that may affect customer supply reliability.
The Water Loss Volume by Distribution Segment chart compares water loss across Urban Network, transmission mains, residential distribution, industrial corridors, and commercial supply systems. This helps operators identify segments contributing to high non-revenue water losses. The dashboard also includes Distribution Demand Load by Time Period & Network Segment, which helps utilities analyze demand fluctuations during peak and non-peak periods. The Customer Complaints by Service Issue chart categorizes complaints such as low pressure, no water supply, leakage complaints, dirty water, and supply delays. A regional low-pressure incident distribution map helps identify geographic areas experiencing recurring pressure instability. This water distribution pressure and supply reliability dashboard improves operational monitoring, service reliability management, and distribution efficiency planning.
How to Analyze Data in Water Supply Distribution Pressure & Supply Reliability Dashboard
Here is how you can analyze data from this dashboard:
- Monitor Supply Reliability (%): Evaluate the continuity and consistency of water supply across different regions to ensure reliable service delivery.
- Track Average Network Pressure (psi): Monitor water pressure levels across distribution zones to maintain stable and efficient network performance.
- Analyze Non-Revenue Water (%): Identify water losses caused by leaks, theft, or inefficiencies that impact operational efficiency and revenue.
- Review Pressure Fluctuation Incidents: Detect network instability and operational risks by tracking pressure fluctuation events across the system.
- Compare Customer Supply Complaints: Analyze complaints by issue type to identify recurring service quality problems and improve customer satisfaction.
- Monitor Average Supply Restoration Time (hrs): Evaluate outage response efficiency by measuring the time required to restore water supply after disruptions.
- Analyze Pressure Stability Trends: Identify seasonal or operational fluctuations in network pressure to support proactive infrastructure management.
- Compare Water Loss Volume Across Distribution Segments: Detect high-loss areas within the network to prioritize maintenance and leakage reduction efforts.
- Review Demand Load Heatmaps: Understand peak water usage patterns across network segments to improve capacity planning and distribution management.
- Monitor Regional Low-Pressure Incident Distribution: Track low-pressure incidents geographically to prioritize infrastructure upgrades and operational improvements.
Benefits of Water Supply Distribution Pressure & Supply Reliability Dashboard
The following are the benefits of using this dashboard:
- Improves Visibility into Network Performance: Provides comprehensive insights into water distribution operations to improve monitoring and system management.
- Maintains Stable Water Pressure and Supply Continuity: Helps utilities ensure consistent water pressure and uninterrupted supply across distribution zones.
- Reduces Non-Revenue Water Losses: Supports the identification and reduction of water losses caused by leaks, theft, or operational inefficiencies.
- Improves Outage Restoration and Operational Efficiency: Enhances response times and operational workflows during supply disruptions and maintenance activities.
- Enhances Customer Service Reliability: Improves complaint tracking and service quality management to deliver a more reliable customer experience.
- Enables Proactive Pressure Monitoring: Detects pressure fluctuation incidents early to prevent network instability and infrastructure issues.
- Supports Infrastructure Planning and Optimization: Provides actionable insights for improving distribution infrastructure planning and network optimization strategies.
- Improves Operational Decision-Making: Uses real-time network analytics to support faster and more informed operational decisions.
- Identifies Recurring Regional Supply Issues: Helps utilities pinpoint geographic areas experiencing repeated supply reliability or pressure-related problems.
- Supports Efficient Demand and Capacity Management: Optimizes supply zone planning by analyzing water demand patterns and network capacity utilization.
KPIs to Track in Water Supply Distribution Pressure & Supply Reliability Dashboard
The following key KPIs can be tracked by using this dashboard:
- Supply Reliability (%): Measures continuity and reliability of water supply services.
- Average Network Pressure (psi): Tracks average water pressure across the distribution network.
- Non-Revenue Water (%): Measures water losses within the supply and distribution system.
- Pressure Fluctuation Incidents: Tracks incidents related to unstable distribution pressure.
- Customer Supply Complaints: Measures customer complaints related to water supply services.
- Avg Supply Restoration Time (hrs): Tracks average time required to restore interrupted water supply.
Frequently Asked Questions
1. Why is a water supply reliability dashboard important?
A water utility pressure management analytics dashboard helps utilities maintain stable pressure, improve supply continuity, reduce water loss, and enhance customer service reliability.
2. What operational areas does this dashboard monitor?
The dashboard monitors pressure stability, network reliability, non-revenue water, customer complaints, outage restoration, and regional pressure incidents.
3. How does the dashboard help reduce water loss?
It identifies high-loss distribution segments and monitors non-revenue water trends, helping utilities improve leak detection and infrastructure maintenance.