
What is a Water Recycling Safety & Chemical Handling Dashboard?
A water recycling safety & chemical handling dashboard is an analytics tool designed to track chemical safety, compliance, and operational risks in wastewater treatment and water reuse facilities. It consolidates data from chemical storage systems, safety incident reports, training records, and spill logs into a single interface. This dashboard enables facility managers, safety officers, and utility leaders to monitor chemical exposure risks, track compliance with OSHA and EPA regulations, and optimize chemical usage. By providing visibility into safety metrics, it helps prevent accidents, reduce chemical waste, and improve workforce training effectiveness.
How to Create a Water Recycling Safety & Chemical Handling Dashboard
You don’t need to build your report from scratch, just start with a ready-to-use dashboard template from Mokkup. Add in your data and export it however you like. Here’s how to do it:
1. Create or Log in to Your Mokkup Account
Start by signing up on Mokkup.ai using your email. If you already have an account, just log in, and you’ll be good to go.
2. Choose and Customize Your Dashboard Template
Find the Water Recycling Safety & Chemical Handling Dashboard template in the Templates section. Use the drag and drop editor to adjust KPIs, edit filters, or add elements based on your data.
3. Export to Your BI Tool
Once your dashboard wireframe is ready, use the BI Tool Export feature to send it directly to Power BI or Tableau for further analysis and enhancements. You can also download the dashboard as a PDF, PNG, or JPEG, embed it on a platform, or invite your team to collaborate.
Note: This is a Pro template. You’ll need a Pro subscription on Mokkup to use and customize this dashboard wireframe. Upgrade anytime to unlock full access.
Water Recycling Safety & Chemical Handling Dashboard Example
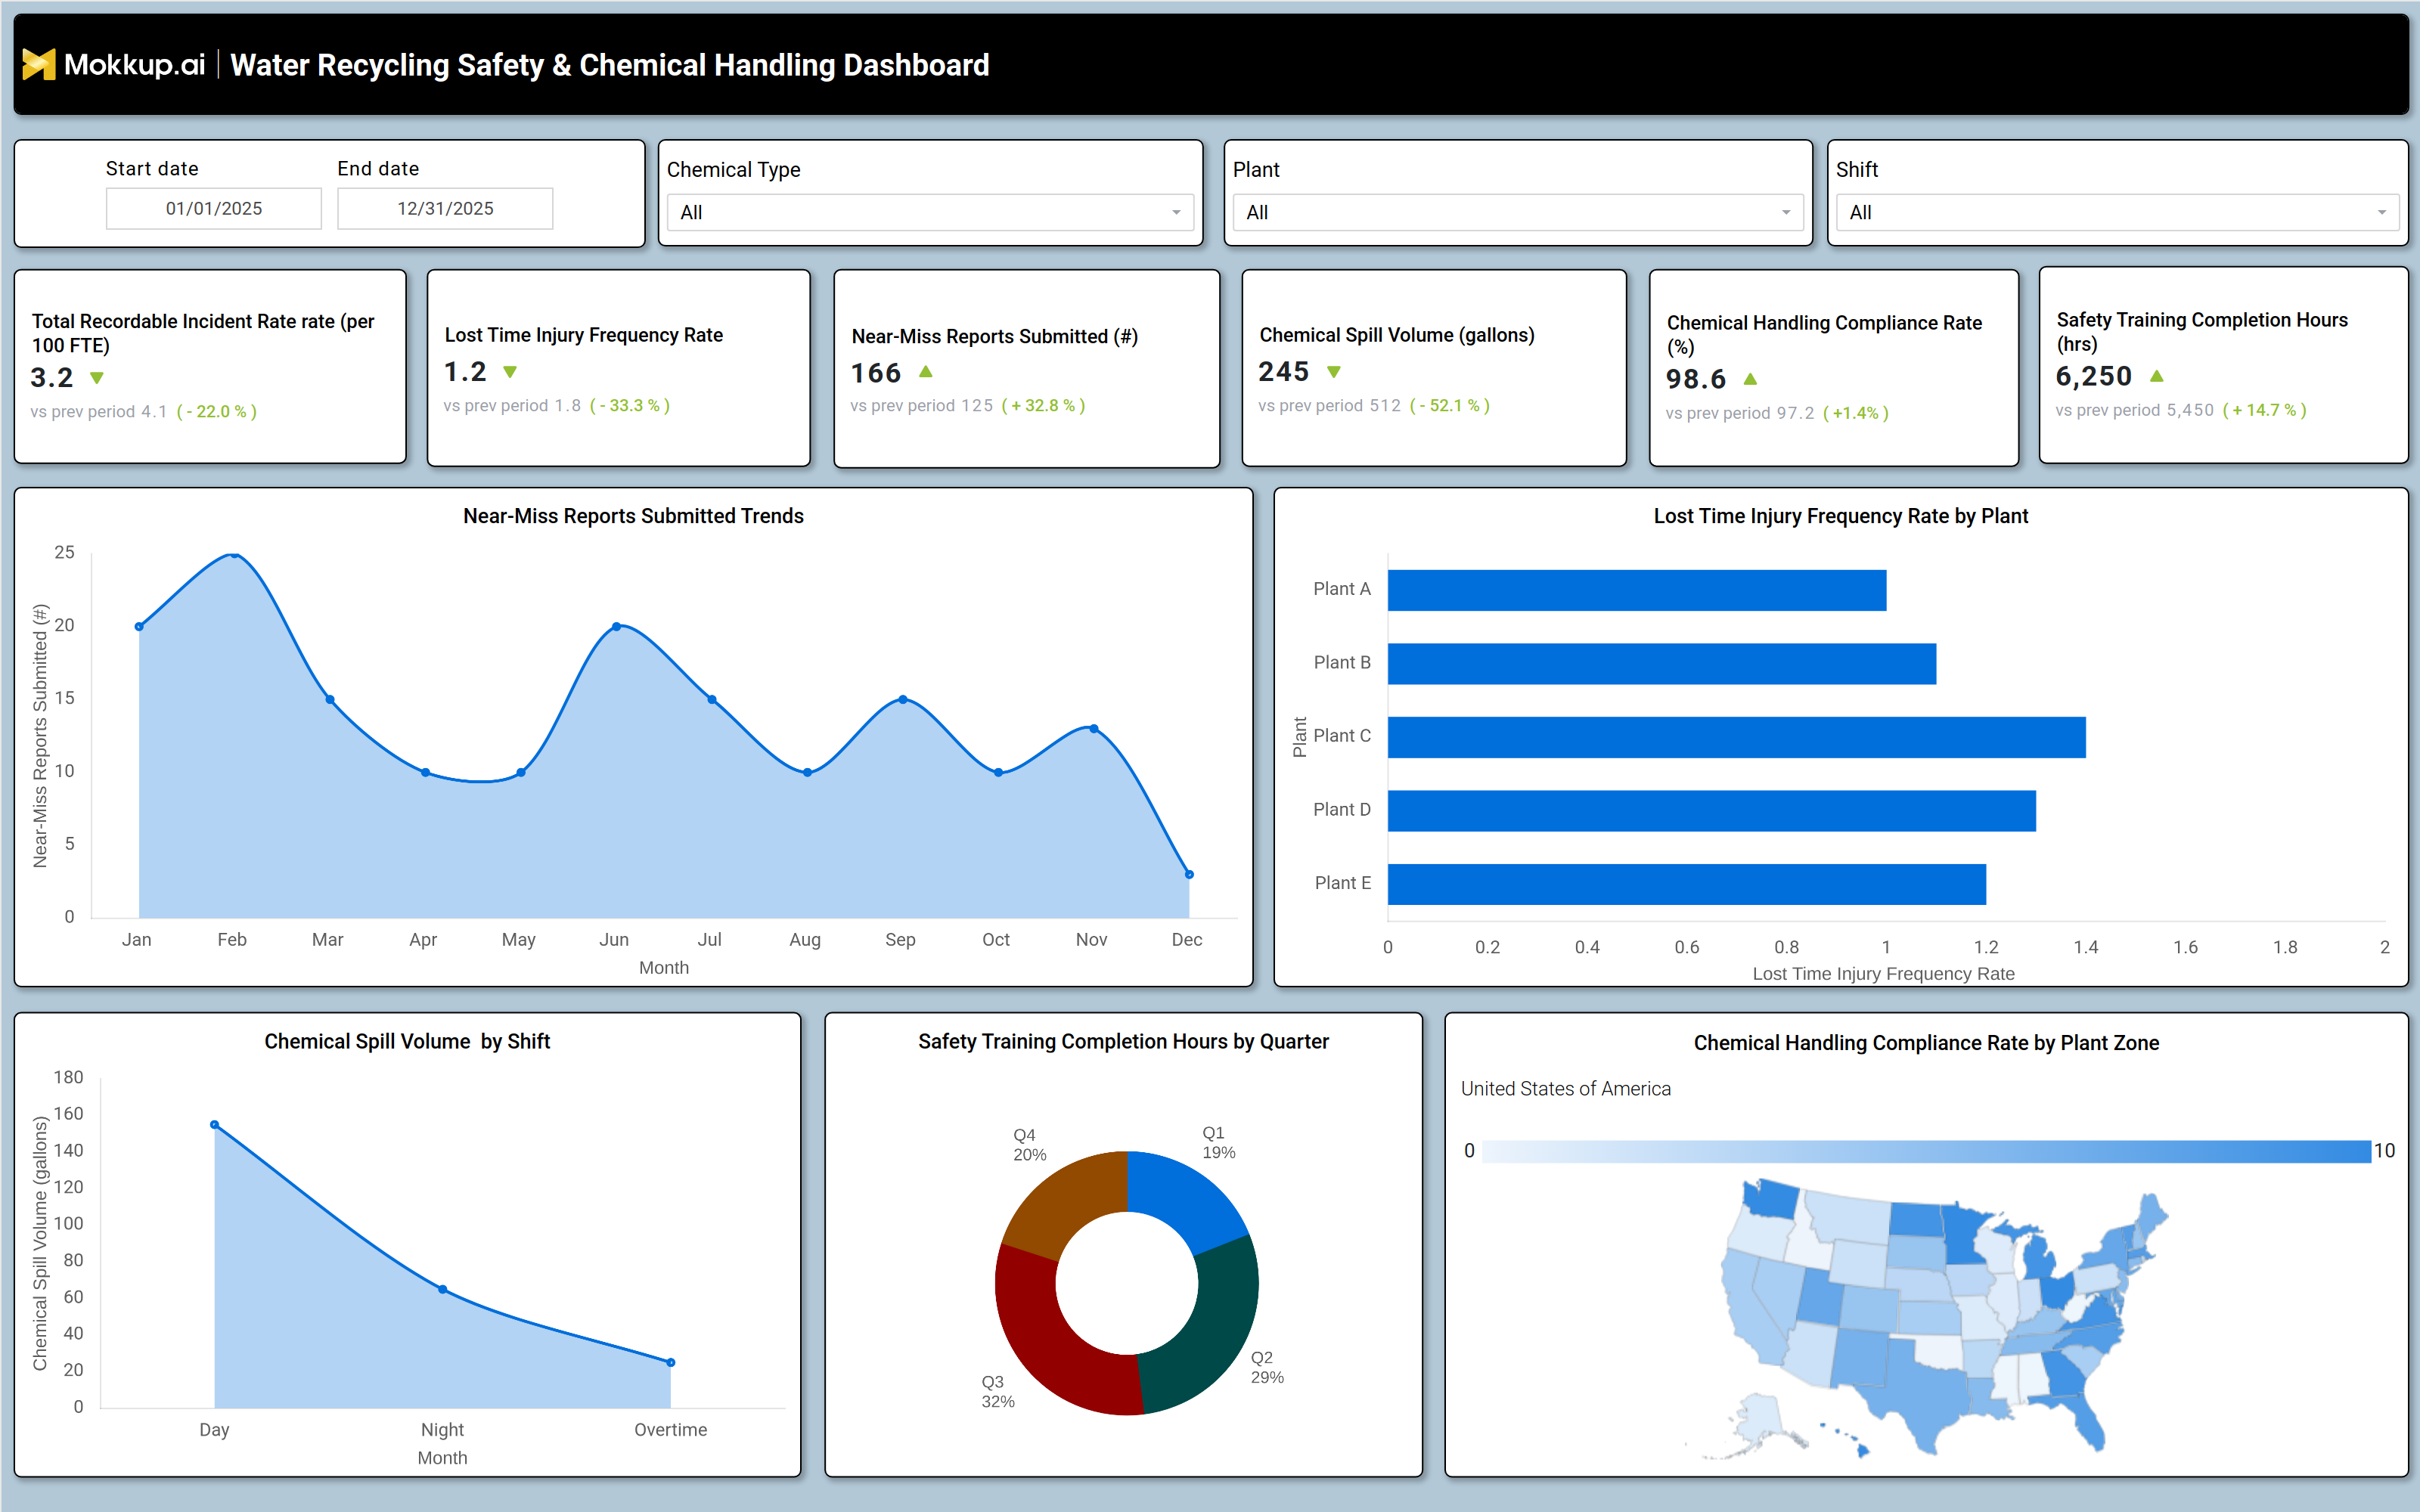
A typical water recycling safety & chemical handling dashboard includes interactive filters for date ranges, chemical types, plant locations, and work shifts. Key performance tiles display metrics such as Total Recordable Incident Rate (TRIR), Lost Time Injury Frequency Rate (LTIFR), nearmiss reports, chemical spill volume, chemical handling compliance rate, and safety training completion hours. Trend charts show monthly or quarterly changes in nearmiss incidents, while bar graphs compare lost time injury rates across different plants. A shift based analysis highlights chemical spill volumes during day, night, and overtime shifts. Additionally, a geographic heatmap visualizes compliance rates by plant zone, helping utilities identify high risk locations. Together, these components create a comprehensive wastewater treatment chemical handling safety tool that supports data driven decision making.
How to Analyze Data in a Water Recycling Safety & Chemical Handling Dashboard
Here is how you can analyze data from this dashboard:
- Review Total Recordable Incident Rate (TRIR) to assess overall safety performance and compare it against industry benchmarks.
- Monitor Lost Time Injury Frequency Rate (LTIFR) to identify trends in severe workplace injuries and implement corrective actions.
- Track nearmiss reports to detect recurring safety hazards before they result in incidents.
- Analyze chemical spill volumes by shift to determine if fatigue or workload contributes to accidents.
- Evaluate chemical handling compliance rates to ensure adherence to safety protocols and regulatory standards.
- Compare safety training completion hours across departments to identify gaps in workforce preparedness.
- Use geographic compliance heatmaps to pinpoint plants with lower safety performance and prioritize interventions.
- Assess trends in incident rates over time to measure the effectiveness of safety programs.
Benefits of a Water Recycling Safety & Chemical Handling Dashboard
The following are the benefits of using this safety training completion dashboard:
- Enhances chemical safety monitoring by tracking incidents, spills, and compliance in real time.
- Reduces workplace accidents through proactive risk identification and nearmiss reporting.
- Improves regulatory compliance by ensuring adherence to OSHA, EPA, and local water safety standards.
- Optimizes chemical usage by identifying waste and inefficiencies in storage and handling.
- Supports workforce training by tracking safety certification and training completion rates.
- Lowers operational risks by providing data driven insights for incident prevention.
- Streamlines reporting for audits and regulatory submissions with automated data collection.
- Boosts operational efficiency by reducing downtime caused by chemical related incidents.
KPIs to Track in a Water Recycling Safety & Chemical Handling Dashboard
The following key KPIs can be tracked by using this near‑miss tracking dashboard:
- Total Recordable Incident Rate (TRIR) (per 100 FTE): Measures the number of workplace injuries and illnesses per 100 full time employees.
- Lost Time Injury Frequency Rate (LTIFR) (per 200k hours): Tracks the number of losttime injuries per 200,000 work hours.
- Near Miss Reports Submitted (#): Counts safety incidents that could have resulted in harm but were prevented.
- Chemical Spill Volume (gallons): Monitors the total volume of chemical spills to assess containment effectiveness.
- Chemical Handling Compliance Rate (%): Evaluates adherence to safety protocols during chemical storage and usage.
- Safety Training Completion Hours (hrs): Tracks the total hours of safety training completed by employees.
Frequently Asked Questions
1. What is a wastewater treatment safety dashboard used for?
It helps wastewater treatment facilities track chemical safety incidents, compliance rates, and training effectiveness to prevent accidents and ensure regulatory adherence.
2. What data sources feed into this chemical handling compliance dashboard?
Chemical inventory systems, safety incident logs, training records, spill reports, and compliance tracking software.
3. Who should use a water recycling safety dashboard?
Facility managers, safety officers, environmental compliance teams, and utility executives responsible for chemical handling and workplace safety.