
What is a Water Recycling & Reuse Treatment Process Performance Dashboard?
The Water Recycling & Reuse Treatment Process Performance Dashboard is a purpose-built analytical tool designed for water utilities, municipal treatment facilities, and environmental operations teams that manage reclaimed water systems. It consolidates operational data across the full treatment cycle—from raw influent processing through advanced treatment stages to final reuse—into a single, structured view. The dashboard tracks how efficiently each treatment stage performs, how much water is successfully recovered and reclaimed, and where operational costs and chemical inputs are being consumed. It is built for teams that need to monitor compliance thresholds, manage treatment throughput, and keep process interruptions from eroding operational output.
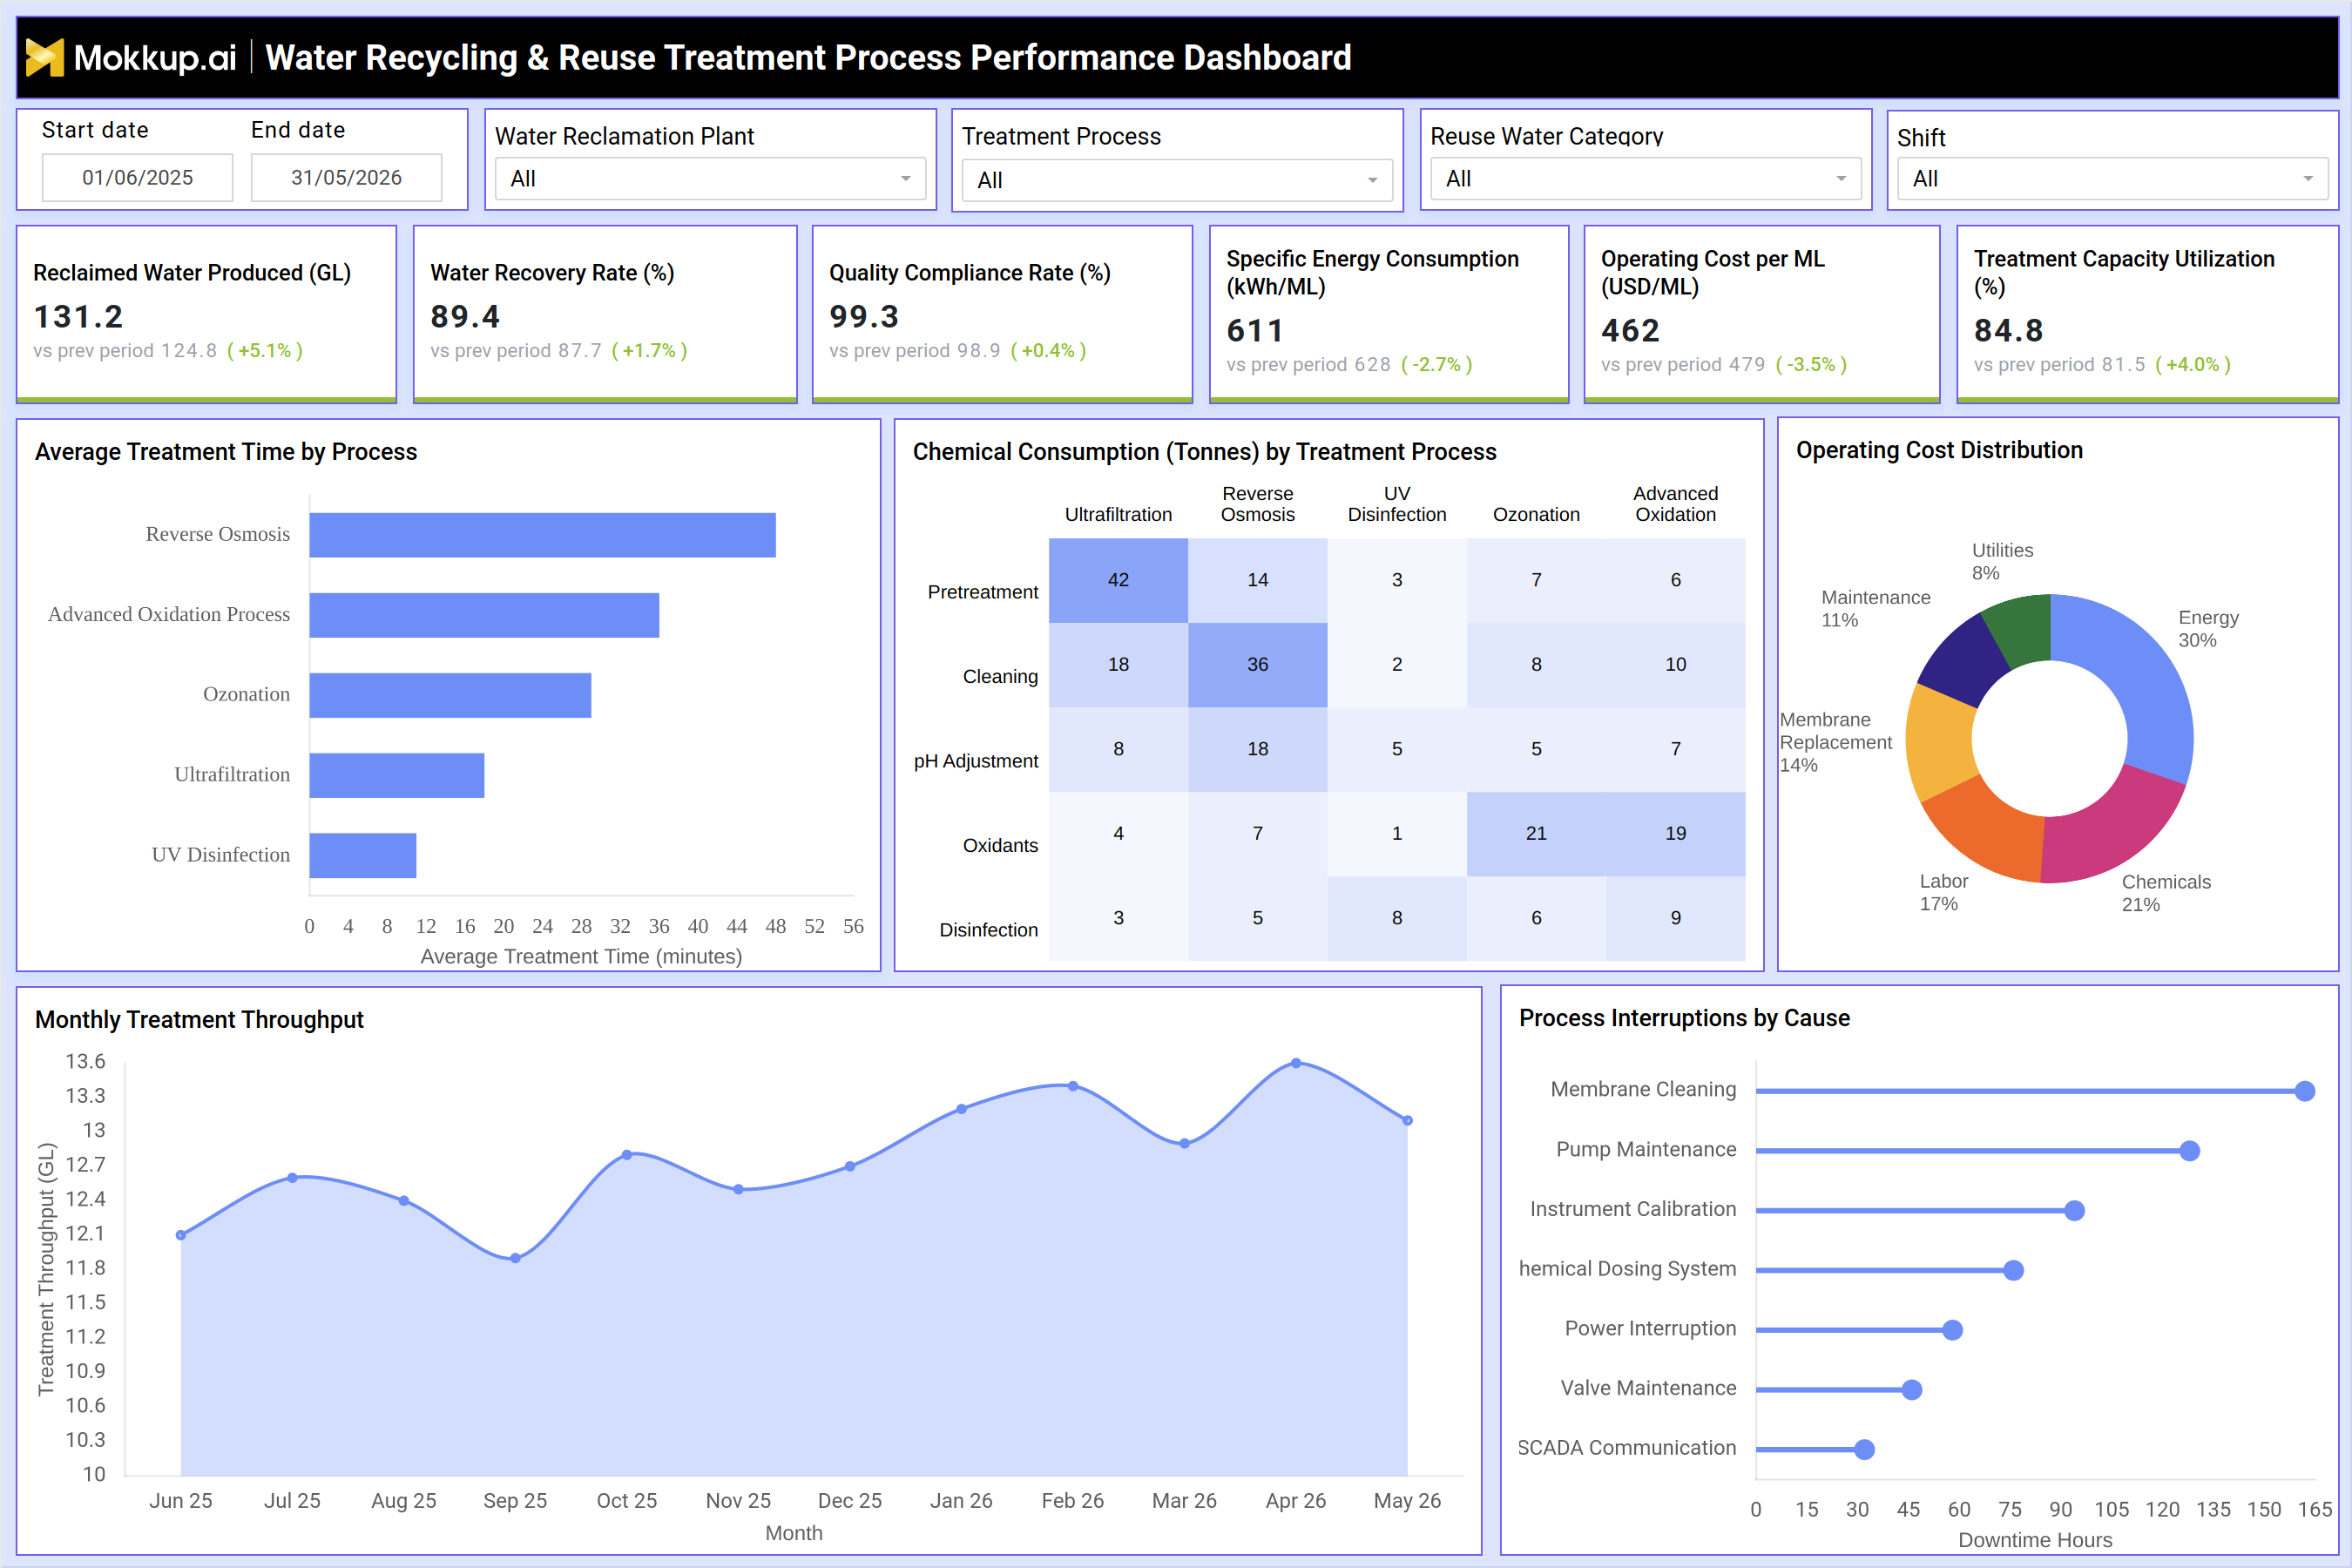
This water recycling treatment process performance dashboard brings together six critical KPI tiles, five distinct chart visualizations, and a suite of filters—including plant, treatment process, reuse water category, and shift—enabling operational leads to interrogate performance across any combination of site and process parameters. The result is a clear operational picture that supports both day-to-day process management and longer-term capacity planning for water reclamation plant monitoring.
How to Create a Water Recycling & Reuse Treatment Process Performance Dashboard
You don't need to build your report from scratch; just start with a ready-to-use dashboard template from Mokkup. Add in your data and export it however you like. Here's how to do it:
1. Create or Log in to Your Mokkup Account
Start by signing up on Mokkup.ai using your email. If you already have an account, just log in, and you'll be good to go.
2. Choose and Customize Your Dashboard Template
Find the Water Recycling & Reuse Treatment Process Performance Dashboard template in the Templates section. Use the drag-and-drop editor to adjust KPIs, edit filters, or add elements based on your data.
3. Export to Your BI Tool
Once your dashboard wireframe is ready, use the BI Tool Export feature to send it directly to Power BI or Tableau for further analysis and enhancements. You can also download the dashboard as a PDF, PNG, or JPEG, embed it on a platform, or invite your team to collaborate.
Note: This is a Pro template. You'll need a Pro subscription on Mokkup to use and customize this dashboard wireframe. Upgrade anytime to unlock full access.
Water Recycling & Reuse Treatment Process Performance Dashboard Example
Plant managers and process engineers at water reclamation facilities open this dashboard when they need to answer a fundamental operational question: is the treatment system performing at the level required to meet recovery targets, compliance standards, and cost constraints? Rather than pulling data from separate SCADA exports or spreadsheet logs, the team uses this water reuse treatment efficiency tracking view to get an immediate read on how the overall facility is operating across the selected period, plant, and shift. With the full single-screen layout in view, operations teams can compare treatment throughput trends month over month, identify which treatment processes consume the most time and chemical inputs, and prioritize maintenance interventions based on which interruption causes are driving the most downtime.
The chemical consumption matrix lets process engineers track input usage across all five treatment stages and all five process types simultaneously, while the operating cost distribution donut allows finance and operations leads to compare cost categories and spot where expenditure is concentrated, supporting decisions around water reclamation plant monitoring and resource allocation. The overall outcome of working with this water recycling treatment process performance dashboard is that treatment teams shift from reactive to structured management. By tracking treatment capacity utilization water dashboard metrics alongside interruption patterns and chemical usage, facilities can plan preventive maintenance more precisely, reduce unplanned downtime, and maintain quality compliance — all while keeping operating costs within acceptable thresholds for the reporting period.
How to Analyze Data in a Water Recycling & Reuse Treatment Process Performance Dashboard
Here is how you can analyze data from this water reclamation plant monitoring dashboard:
- Use the date range and plant filters together to isolate performance data for a specific reclamation site and period
- Track the Reclaimed Water Produced and Water Recovery Rate KPIs to assess volumetric output against recovery targets
- Compare month-over-month throughput in the Monthly Treatment Throughput chart to identify seasonal dips or sustained underperformance
- Use the Average Treatment Time by Process bar chart to identify which stages create the longest processing delays
- Analyze the Chemical Consumption matrix to pinpoint which treatment process and chemical activity combination drives the highest input volumes
- Review the Operating Cost Distribution donut to compare cost category weightings: Energy, Chemicals, Labor, Membrane Replacement, Maintenance, utilities.
- Identify the top interruption causes in the Process Interruptions by Cause chart to prioritize maintenance scheduling.
- Filter by Treatment Process and Shift to isolate performance differences across operational windows for water reuse treatment efficiency tracking
- Monitor Quality Compliance Rate and Specific Energy Consumption together to balance output quality against energy efficiency.
Benefits of a Water Recycling & Reuse Treatment Process Performance Dashboard
The following are the benefits of using this dashboard:
- Consolidates all treatment process metrics into one structured view, reducing time spent gathering data from multiple sources
- Supports chemical consumption water treatment analytics by mapping input volumes across every process stage and activity type
- Enables finance and operations teams to compare cost category breakdowns and track where operating spend is concentrated
- Helps maintenance planners prioritize interventions by showing which interruption causes generate the most downtime hours
- Provides a clear treatment capacity utilization water dashboard view for capacity planning and infrastructure investment decisions
- Strengthens compliance reporting by surfacing quality compliance rates alongside period-over-period comparisons
- Allows shift-level and plant-level filtering so site managers can isolate performance to specific operational contexts
- Supports water reclamation plant monitoring across multiple facilities from a single configurable template.
KPIs to Track in a Water Recycling & Reuse Treatment Process Performance Dashboard
The following key KPIs can be tracked by using this Water recovery rate dashboard for utilities dashboard:
- Reclaimed Water Produced (GL): Total volume of treated water successfully reclaimed and available for reuse during the selected period
- Water Recovery Rate (%): The proportion of input water that is successfully recovered through the treatment process, a core metric in water reuse treatment efficiency tracking
- Quality Compliance Rate (%): Percentage of treated water batches or outputs that meet defined water quality standards — tracks regulatory and operational compliance
- Specific Energy Consumption (kWh/ML): Energy used per megaliter of water treated, tracks operational energy efficiency across treatment stages
- Operating Cost per ML (USD/ML): Total operating expenditure per megaliter of water produced, covering labor, chemicals, energy, and maintenance costs
- Treatment Capacity Utilization (%): The share of total treatment capacity actively being used, an indicator of throughput efficiency and headroom for additional load.
Frequently Asked Questions
1. What types of teams use the Water Recycling & Reuse Treatment Process Performance Dashboard?
This dashboard is used by plant managers, process engineers, environmental compliance officers, and operations leads at water reclamation and reuse facilities. It is also relevant to utility finance teams that need to track operating costs per unit of water produced.
2. How does this dashboard support chemical consumption water treatment analytics?
The Chemical Consumption matrix cross-references five chemical activity types against five treatment processes, giving teams a structured breakdown of where inputs are being used most heavily. This allows process engineers to identify high-consumption combinations and evaluate whether usage aligns with treatment outcomes.
3. Can this dashboard be filtered by individual treatment plant or shift?
Yes. The dashboard includes filter controls for Water Reclamation Plant, Treatment Process, Reuse Water Category, and Shift, making it straightforward to narrow the view to a specific site, operational window, or process type for targeted analysis.