
What is a Water Recycling Reuse & Expansion Dashboard?
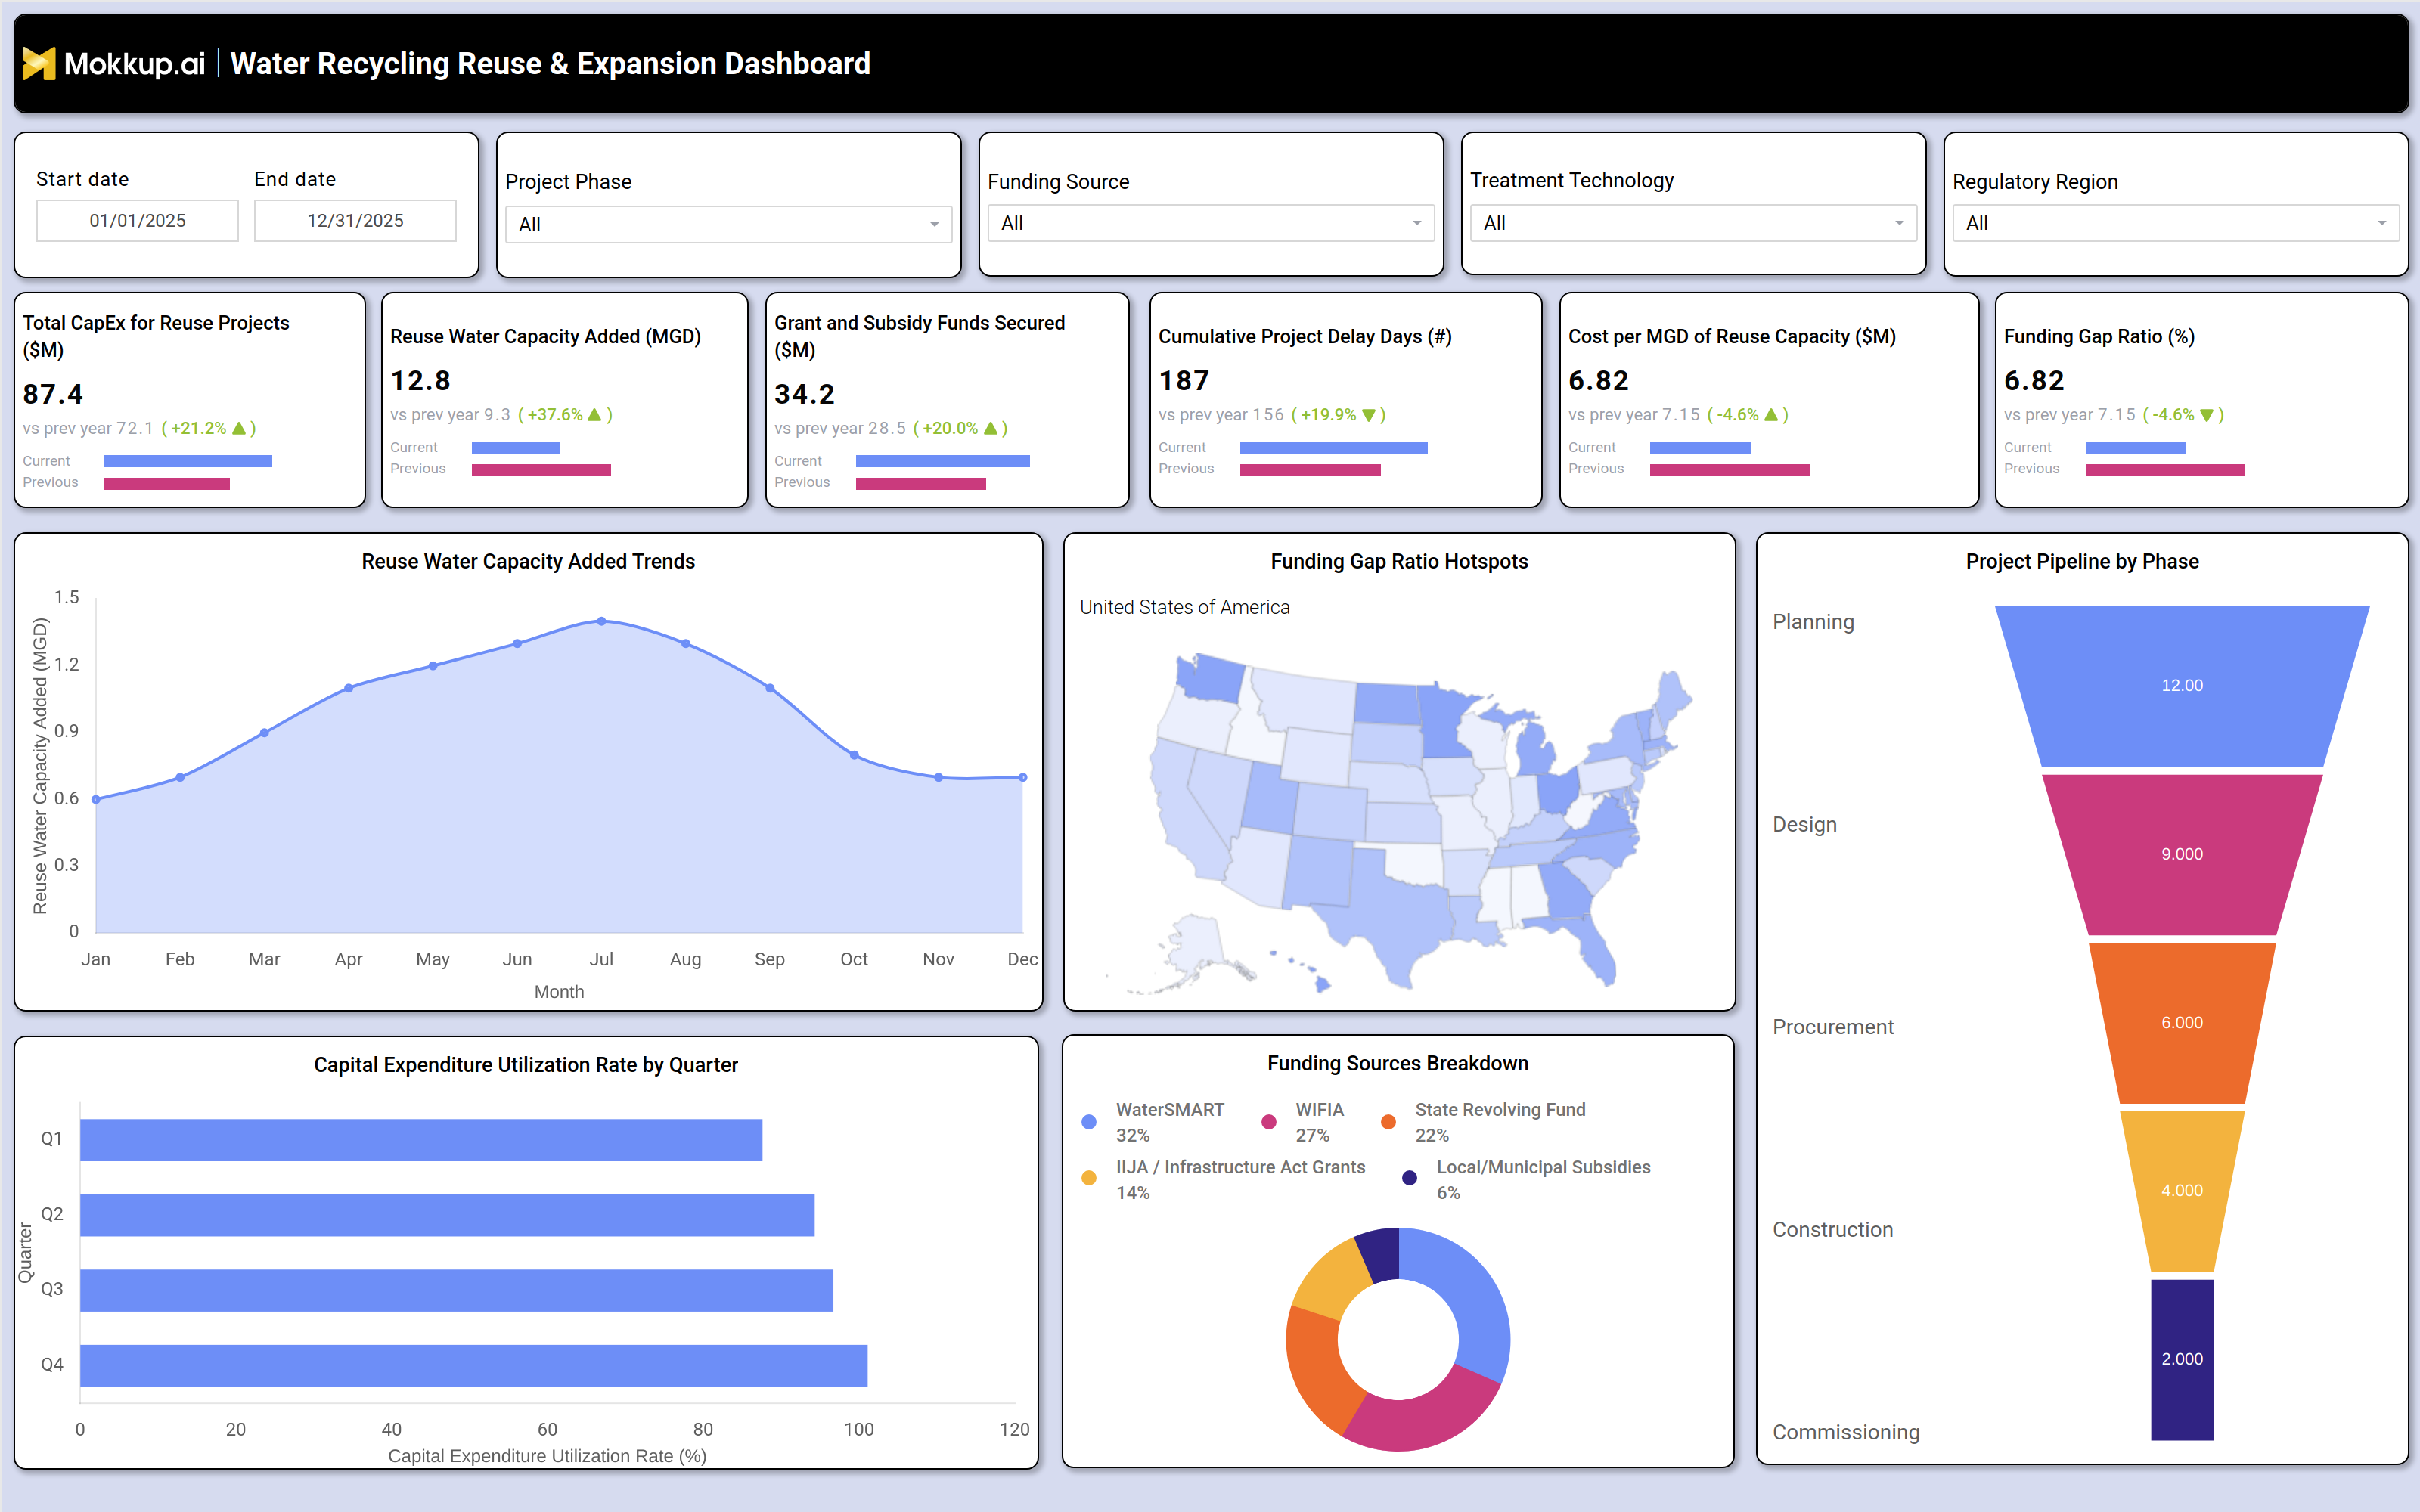
The Water Recycling Reuse & Expansion Dashboard is a purpose-built reporting template for utility finance and engineering teams that need visibility into capital spending, funding sources, and delivery timelines across water reclamation projects. It brings CapEx tracking, grant and subsidy inflows, and reuse capacity growth into a single view, so teams responsible for water reuse project capital expenditure tracking dashboard reporting are not reconciling numbers across separate spreadsheets. The dashboard can be filtered by project phase, funding source, treatment technology, and regulatory region, which lets it adapt to how a reuse program is structured, whether work is state-funded, federally backed through programs like WIFIA, or supported through local subsidies. A date range filter narrows the view to a specific reporting period, while the KPI row surfaces capital deployed, capacity added, grants secured, delay days, and the funding gap ratio at a glance. Because every element ties back to actual reuse project activity, the Water Recycling Reuse & Expansion Dashboard also functions as a reuse water capacity expansion planning dashboard for utilities scaling their water reclamation programs.
How to Create a Water Recycling Reuse & Expansion Dashboard
You don't need to build your report from scratch; just start with a ready-to-use dashboard template from Mokkup. Add in your data and export it however you like. Here's how to do it:
1. Create or Log in to Your Mokkup Account
Start by signing up on Mokkup.ai using your email. If you already have an account, just log in, and you'll be good to go.
2. Choose and Customize Your Dashboard Template
Find the Water Recycling Reuse & Expansion Dashboard template in the Templates section. Use the drag-and-drop editor to adjust KPIs, edit filters, or add elements based on your data.
3. Export to Your BI Tool
Once your dashboard wireframe is ready, use the BI Tool Export feature to send it directly to Power BI or Tableau for further analysis and enhancements. You can also download the dashboard as a PDF, PNG, or JPEG, embed it on a platform, or invite your team to collaborate.
Note: This is a Pro template. You'll need a Pro subscription on Mokkup to use and customize this dashboard wireframe. Upgrade anytime to unlock full access.
Water Recycling Reuse & Expansion Dashboard Example
A capital planning manager at a water utility opens the Water Recycling Reuse & Expansion Dashboard ahead of a budget review to understand how reuse project spending compares with what was approved for the year and whether secured funding is keeping pace with construction needs. Before recommending new project approvals, the manager filters by project phase and funding source to separate work still in planning or design from projects already under construction.Within this single view, planners can run a funding gap ratio analysis for water recycling projects to identify which regions carry the widest shortfall and prioritize outreach for additional grants before that gap stalls construction.
Engineering leads can track how quickly reuse capacity is being added each month and compare that pace against the prior year to flag any slowdown early. Finance teams can compare capital deployment across quarters to catch underspending or overspending before it turns into a budget variance, and program leads can see how many projects sit in each phase of the pipeline, from initial planning through commissioning, to know exactly where bottlenecks are forming.The overall outcome is a water reuse program that can defend its funding requests with evidence, catch delivery risk before it becomes a missed milestone, and keep every expansion project moving through its phases without losing sight of cost per unit of reuse capacity delivered.
How to Analyze Data in a Water Recycling Reuse & Expansion Dashboard
Here is how you can analyze data from this dashboard:
- Filter by Project Phase to isolate planning, design, procurement, construction, or commissioning work.
- Use the Funding Source filter to compare performance across WaterSMART, WIFIA, State Revolving Fund, IIJA grants, and local subsidies.
- Apply the Treatment Technology filter to review CapEx and capacity outcomes by technology type.
- Narrow results by Regulatory Region to spot compliance-driven funding or delay patterns.
- Set the Start and End date range to review CapEx and capacity trends for a specific period.
- Review the Reuse Water Capacity Added Trends chart to spot seasonal growth patterns.
- Check the Funding Gap Ratio Hotspots map to locate states with the largest funding shortfalls.
- Compare quarterly bars in the Capital Expenditure Utilization Rate chart to catch spending pace issues.
- Use the Project Pipeline by Phase funnel to see where projects are concentrated or stalling.
- Cross-check the Funding Sources Breakdown donut to confirm reliance on a single funding channel.
Benefits of a Water Recycling Reuse & Expansion Dashboard
The following are the benefits of using this dashboard:
- Centralizes CapEx, funding, and capacity data into one water reuse project capital expenditure tracking dashboard.
- Reduces manual reconciliation between finance, engineering, and grants teams.
- Surfaces a funding gap ratio analysis for water recycling projects before shortfalls delay construction.
- Improves visibility into project pipeline by phase water recycling dashboard reporting for leadership reviews.
- Supports faster grant and subsidy funds tracking dashboard reporting for compliance and audit needs.
- Gives finance teams a clear capital expenditure utilization rate water utilities can benchmark every quarter.
- Acts as a single reuse water capacity expansion planning dashboard for tracking growth across treatment technologies.
- Enables region-level comparison to prioritize funding applications where gaps are largest.
KPIs to Track in a Water Recycling Reuse & Expansion Dashboard
The following key KPIs can be tracked by using this dashboard:
- Total CapEx for Reuse Projects ($M) - total capital spent to date on approved water reuse and expansion projects.
- Reuse Water Capacity Added (MGD) - additional reuse capacity brought online, measured in million gallons per day.
- Grant and Subsidy Funds Secured ($M) - confirmed funding value tracked through the grant and subsidy funds tracking dashboard for active reuse projects.
- Cumulative Project Delay Days (count) - total days of schedule slippage accumulated across all reuse projects in the pipeline.
- Cost per MGD of Reuse Capacity ($M) - capital cost required to deliver each additional unit of reuse water capacity.
- Funding Gap Ratio (%) - share of project cost not yet covered by secured funding, the core metric behind funding gap ratio analysis for water recycling projects.
- Capital Expenditure Utilization Rate (%) - percentage of approved capital deployed each quarter, a key capital expenditure utilization rate water utilities use for budget discipline.
Frequently Asked Questions
1. What does the Water Recycling Reuse & Expansion Dashboard track?
It tracks CapEx, reuse water capacity added, funding sources, project delay days, and cost per unit of capacity across water reclamation projects. It also groups projects by phase so teams can see where investment and construction activity are concentrated.
2. Who should use this reuse water capacity expansion planning dashboard?
Utility finance teams, engineering leads, and program managers overseeing water reuse and expansion projects benefit most. Anyone accountable for capital budgets, grant compliance, or project pipeline by phase water recycling dashboard reporting will find it useful.
3. Can I customize this dashboard for my own data?
Yes. The Water Recycling Reuse & Expansion Dashboard template on Mokkup lets you edit KPIs, filters, and chart data, then export to Power BI, Tableau, or as an image file. This makes it a flexible water reuse project capital expenditure tracking dashboard for any utility's specific data set.