
What is a Water Recycling Executive Performance Dashboard?
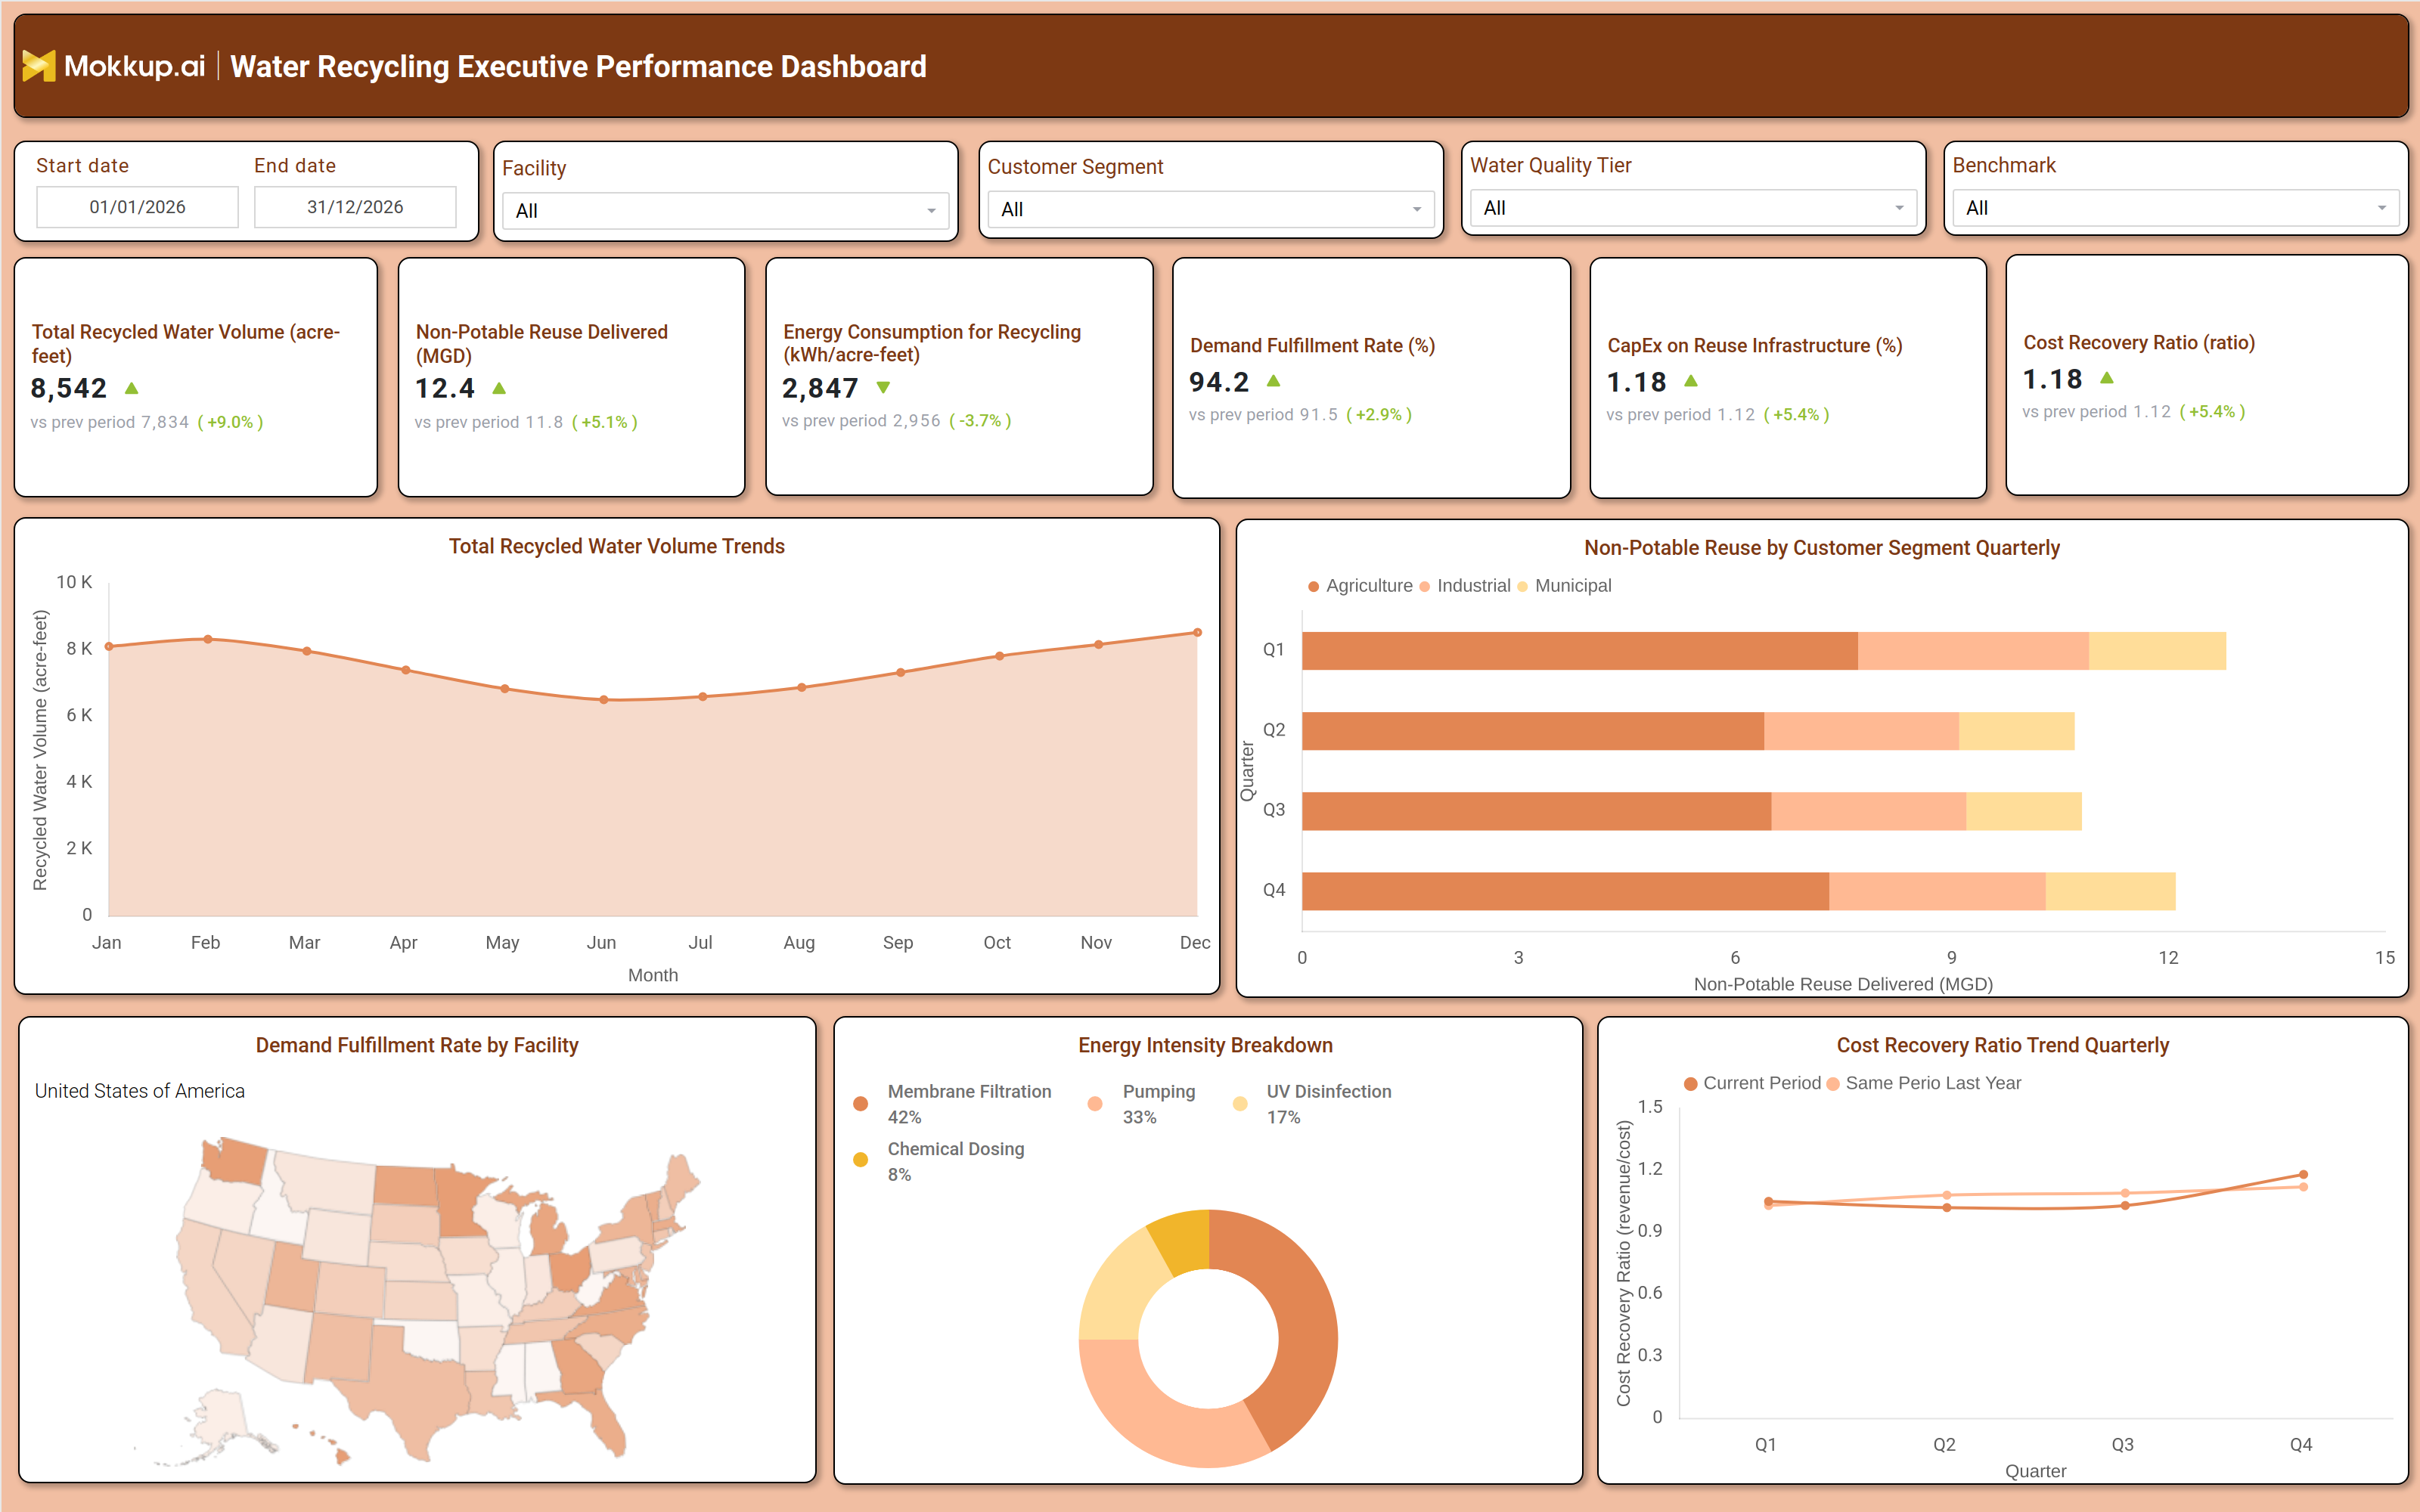
The Water Recycling Executive Performance Dashboard is a water recycling executive dashboard built for utility leaders and operations executives who need a single view of recycled water output, reuse delivery, and infrastructure spend. Instead of pulling data from multiple systems, executives can review recycled water volume, non-potable reuse tracking, and cost recovery in one wireframe. The dashboard consolidates facility-level performance, customer-segment demand, and quarterly financial ratios, enabling leadership teams to align production capacity with reuse commitments. Filters for facility, customer segment, water quality tier, and benchmark period let users narrow the view to a specific plant or comparison window without losing sight of enterprise-wide demand fulfillment rate and water utility performance. Built on the Mokkup.ai platform, this dashboard wireframe is designed for utilities managing recycled water programs for agricultural, industrial, and municipal customers, providing decision-makers with a consistent reference point before every planning or leadership review.
How to Create a Water Recycling Executive Performance Dashboard
You don't need to build your report from scratch, just start with a ready-to-use dashboard template from Mokkup. Add in your data and export it however you like. Here's how to do it:
1. Create or Log in to Your Mokkup Account
Start by signing up on Mokkup.ai using your email. If you already have an account, just log in, and you'll be good to go.
2. Choose and Customize Your Dashboard Template
Find the Water Recycling Executive Performance Dashboard template in the Templates section. Use the drag-and-drop editor to adjust KPIs, edit filters, or add elements based on your data.
3. Export to Your BI Tool
Once your dashboard wireframe is ready, use the BI Tool Export feature to send it directly to Power BI or Tableau for further analysis and enhancements. You can also download the dashboard as a PDF, PNG, or JPEG, embed it on a platform, or invite your team to collaborate.
Note: This is a Pro template. You'll need a Pro subscription on Mokkup to use and customize this dashboard wireframe. Upgrade anytime to unlock full access.
Water Recycling Executive Performance Dashboard Example
A utility executive typically opens this water recycling executive dashboard before a quarterly leadership review, looking to understand whether recycled water production is keeping pace with reuse commitments across facilities. The landing view surfaces how total recycled water output has moved over recent months, letting leaders spot whether volume is trending upward or falling behind seasonal expectations. From there, the executive can review non-potable reuse tracking across agriculture, industrial, and municipal segments to see which customer group is driving demand and whether allocation needs to shift. Moving through the dashboard, planners can perform a recycled water volume trend analysis alongside facility-level demand fulfillment to identify which plants are consistently meeting targets and which need operational attention.
Operations teams can assess where power consumption is concentrated across treatment stages, so efficiency projects get prioritized where they matter most. Finance leaders can review capital spend against infrastructure targets and judge whether cost recovery is improving or lagging relative to the prior year, all from filters that let them isolate a single facility, quality tier, or benchmark window. Because every element sits on one wireframe, executives can move from a high-level volume check to a facility-specific or segment-specific question without switching tools. The outcome is a dashboard that helps leadership teams align production, spend, and reuse delivery decisions around one shared source of truth, supporting faster and more confident planning conversations across finance, operations, and customer teams.
How to Analyze Data in a Water Recycling Executive Performance Dashboard
Here is how you can analyze data from this dashboard:
- Track seasonal demand: Compare monthly recycled water volume trends to identify seasonal dips before they affect delivery commitments.
- Evaluate facility performance: Analyze recycled water volume trends alongside facility-level demand fulfillment to identify underperforming plants.
- Monitor customer demand: Track non-potable water reuse by customer segment to understand shifts in agricultural, industrial, or municipal demand.
- Filter quality benchmarks: Use the water quality tier and benchmark filters to evaluate performance for a specific standard or comparison period.
- Analyze energy consumption: Review the energy intensity breakdown to determine which treatment stage uses the most power.
- Measure cost recovery: Monitor cost recovery ratio trends quarter over quarter to ensure reuse revenue keeps pace with operational costs.
Benefits of a Water Recycling Executive Performance Dashboard
The following are the benefits of using this dashboard:
- Centralize reuse operations: Combine recycled water production, reuse delivery, and cost data into a single executive dashboard.
- Link financial and operational performance: Track the water reuse cost recovery ratio alongside reuse volume to measure financial sustainability.
- Accelerate reporting: Eliminate manual data consolidation across facilities during quarterly reviews.
- Improve energy efficiency: Monitor the energy intensity breakdown to identify opportunities for targeted efficiency investments.
- Support capacity planning: Balance customer segment demand against facility capacity to improve budget planning.
- Align operational decisions: Give operations and finance teams a shared view for evaluating infrastructure spending.
KPIs to Track in a Water Recycling Executive Performance Dashboard
The following key KPIs can be tracked by using this dashboard:
- Total Recycled Water Volume (acre-feet): Measures overall recycled water output produced across facilities.
- Non-Potable Reuse Delivered (MGD): Tracks the volume of reuse water delivered to non-potable customers.
- Energy Consumption for Recycling (kWh/acre-feet): Measures power used per unit of water recycled, feeding the energy intensity breakdown.
- Demand Fulfillment Rate (%): Shows how well recycled water supply meets customer demand at the facility level, a core demand fulfillment rate water utility indicator.
- CapEx on Reuse Infrastructure (%): Tracks capital spend directed toward reuse infrastructure relative to plan.
- Cost Recovery Ratio (ratio): Reflects a water reuse cost recovery ratio measuring revenue generated against program cost.
Frequently Asked Questions
1. What is the Water Recycling Executive Performance Dashboard used for?
It gives utility executives a consolidated view of recycled water volume, reuse delivery, and cost recovery in one wireframe. Teams use it to review demand fulfillment rate water utility performance and reuse spend ahead of leadership reviews.
2. Which industries use this dashboard template?
Water utilities and municipal water recycling programs managing agriculture, industrial, and municipal reuse customers use this dashboard. It suits organizations tracking recycled water production alongside infrastructure investment.
3. Can I customize the KPIs and filters in this dashboard?
Yes. The Mokkup.ai drag-and-drop editor lets you adjust KPI tiles, filters, and chart layouts to match your own recycled water data before exporting to Power BI or Tableau.