What is a Wastewater Treatment Sludge Handling Dashboard?
A wastewater treatment sludge handling dashboard is a data-driven analytics tool designed to monitor, track, and optimize sludge management processes in treatment facilities. It consolidates key performance metrics such as sludge volume, dewatering efficiency, polymer consumption, energy use, and disposal methods into a single interface. By providing sludge handling optimization tools for water utilities, this dashboard helps operators identify inefficiencies, reduce operational costs, and ensure compliance with environmental regulations. Whether managing industrial or municipal wastewater, this automated sludge management dashboard enables utilities to make informed decisions on resource allocation, process improvements, and sustainability initiatives.
How to Create a Wastewater Treatment Sludge Handling Dashboard
You don’t need to build your report from scratch; just start with a ready-to-use dashboard template from Mokkup. Add in your data and export it however you like. Here’s how to do it:
1. Create or Log in to Your Mokkup Account
Start by signing up on Mokkup.ai using your email. If you already have an account, just log in, and you’ll be good to go.
2. Choose and Customize Your Dashboard Template
Find the Wastewater Treatment Sludge Handling Dashboard template in the Templates section. Use the drag and drop editor to adjust KPIs, edit filters, or add elements based on your data.
3. Export to Your BI Tool
Once your dashboard wireframe is ready, use the BI Tool Export feature to send it directly to Power BI or Tableau for further analysis and enhancements. You can also download the dashboard as a PDF, PNG, or JPEG, embed it on a platform, or invite your team to collaborate.
Note: This is a Pro template. You’ll need a Pro subscription on Mokkup to use and customize this dashboard wireframe. Upgrade anytime to unlock full access.
Wastewater Treatment Sludge Handling Dashboard Example
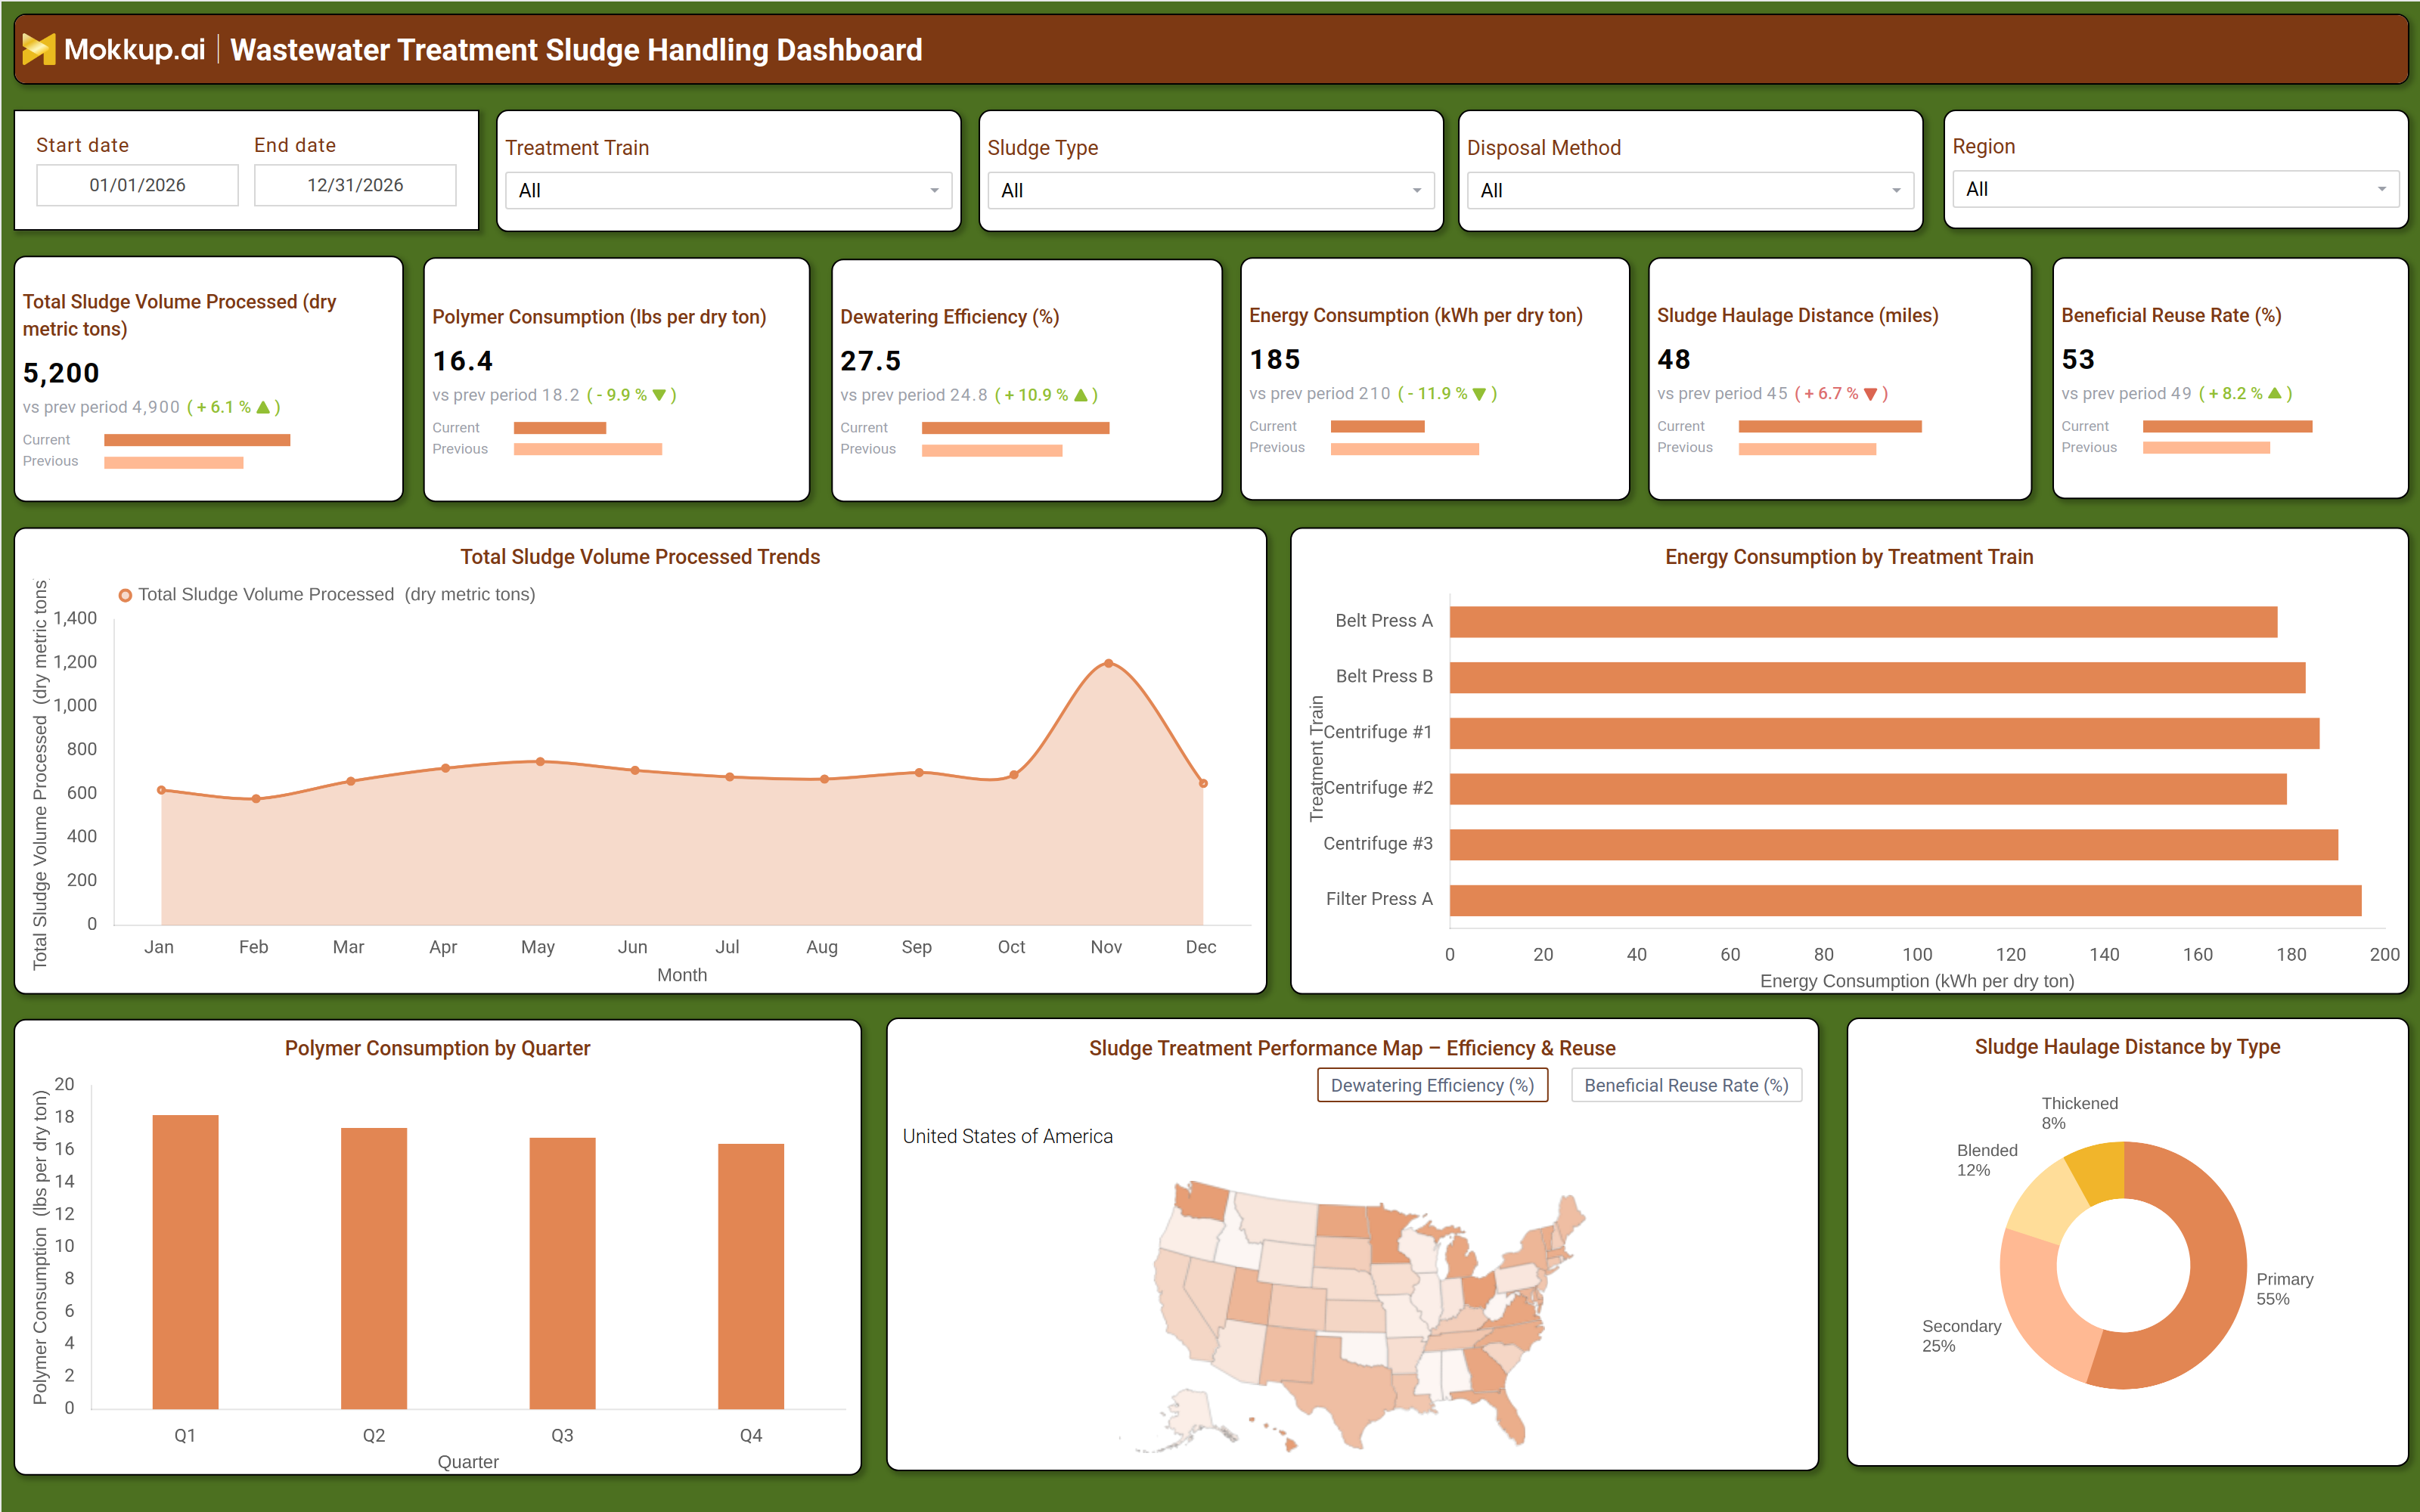
A typical wastewater treatment sludge monitoring dashboard includes interactive filters for date ranges, treatment trains, sludge types, disposal methods, and regions. Key performance tiles display metrics like total sludge volume processed (dry metric tons), polymer consumption (lbs per dry ton), dewatering efficiency (%), energy consumption (kWh per dry ton), sludge haulage distance (miles), and beneficial reuse rate (%). Trend charts show monthly or quarterly variations in sludge volume, polymer use, and energy consumption, while bar graphs compare performance across different treatment trains. A sludge treatment performance map visualizes dewatering efficiency and reuse rates by region, and a pie chart breaks down haulage distances by sludge type. Together, these components form a data-driven sludge tracking solution that helps utilities improve operational efficiency and reduce waste.
How to Analyze Data in a Wastewater Treatment Sludge Handling Dashboard
Here is how you can analyze data from this dewatering efficiency monitoring dashboard:
- Monitor total sludge volume processed to assess treatment capacity and seasonal variations.
- Track polymer consumption trends to optimize chemical usage and reduce costs.
- Evaluate dewatering efficiency to identify underperforming treatment trains.
- Compare energy consumption across different sludge handling methods to improve sustainability.
- Analyze sludge haulage distances to minimize transportation costs and carbon footprint.
- Review beneficial reuse rates to maximize resource recovery and compliance with circular economy goals.
- Use regional performance maps to identify high efficiency treatment plants and replicate best practices.
- Compare current data with historical trends to detect improvements or declines in sludge management.
Benefits of a Wastewater Treatment Sludge Handling Dashboard
The following are the benefits of using this beneficial reuse rate dashboard:
- Enhances operational efficiency by providing wastewater sludge volume analysis and reporting tools.
- Reduces chemical and energy costs through optimized polymer and power consumption tracking.
- Improves compliance with environmental regulations by monitoring disposal methods and reuse rates.
- Supports data-driven decision-making for process improvements and resource allocation.
- Minimizes transportation costs by analyzing sludge haulage distances and optimizing logistics.
- Increases sustainability by identifying opportunities for beneficial reuse of sludge.
- Provides insights into treatment performance for faster corrective actions.
KPIs to Track in a Wastewater Treatment Sludge Handling Dashboard
The following key KPIs can be tracked by using this dashboard:
- Total Sludge Volume Processed (dry metric tons): Measures the amount of sludge treated over a specific period.
- Polymer Consumption (lbs per dry ton): Tracks chemical usage efficiency in dewatering processes.
- Dewatering Efficiency (%): Indicates how effectively water is removed from sludge.
- Energy Consumption (kWh per dry ton): Monitors power usage for cost and sustainability optimization.
- Sludge Haulage Distance (miles): Measures transportation efficiency and associated costs.
- Beneficial Reuse Rate (%): Tracks the percentage of sludge repurposed for agriculture, energy, or construction.
Frequently Asked Questions
1. What is a Sludge Haulage optimization dashboard used for?
A sludge handling dashboard helps wastewater treatment plants monitor sludge volume, dewatering efficiency, chemical usage, and disposal methods to improve operational efficiency and compliance.
2. What data sources feed into this Wastewater Sludge Handling dashboard?
Data is sourced from SCADA systems, laboratory reports, energy meters, and disposal logs to provide a comprehensive view of sludge management.
3. Who should use a Polymer Consumption Tracking dashboard?
Plant operators, environmental engineers, utility managers, and compliance officers benefit from this cloud-based sludge management system.