
What is a Wastewater Treatment SCADA & Automation Dashboard?
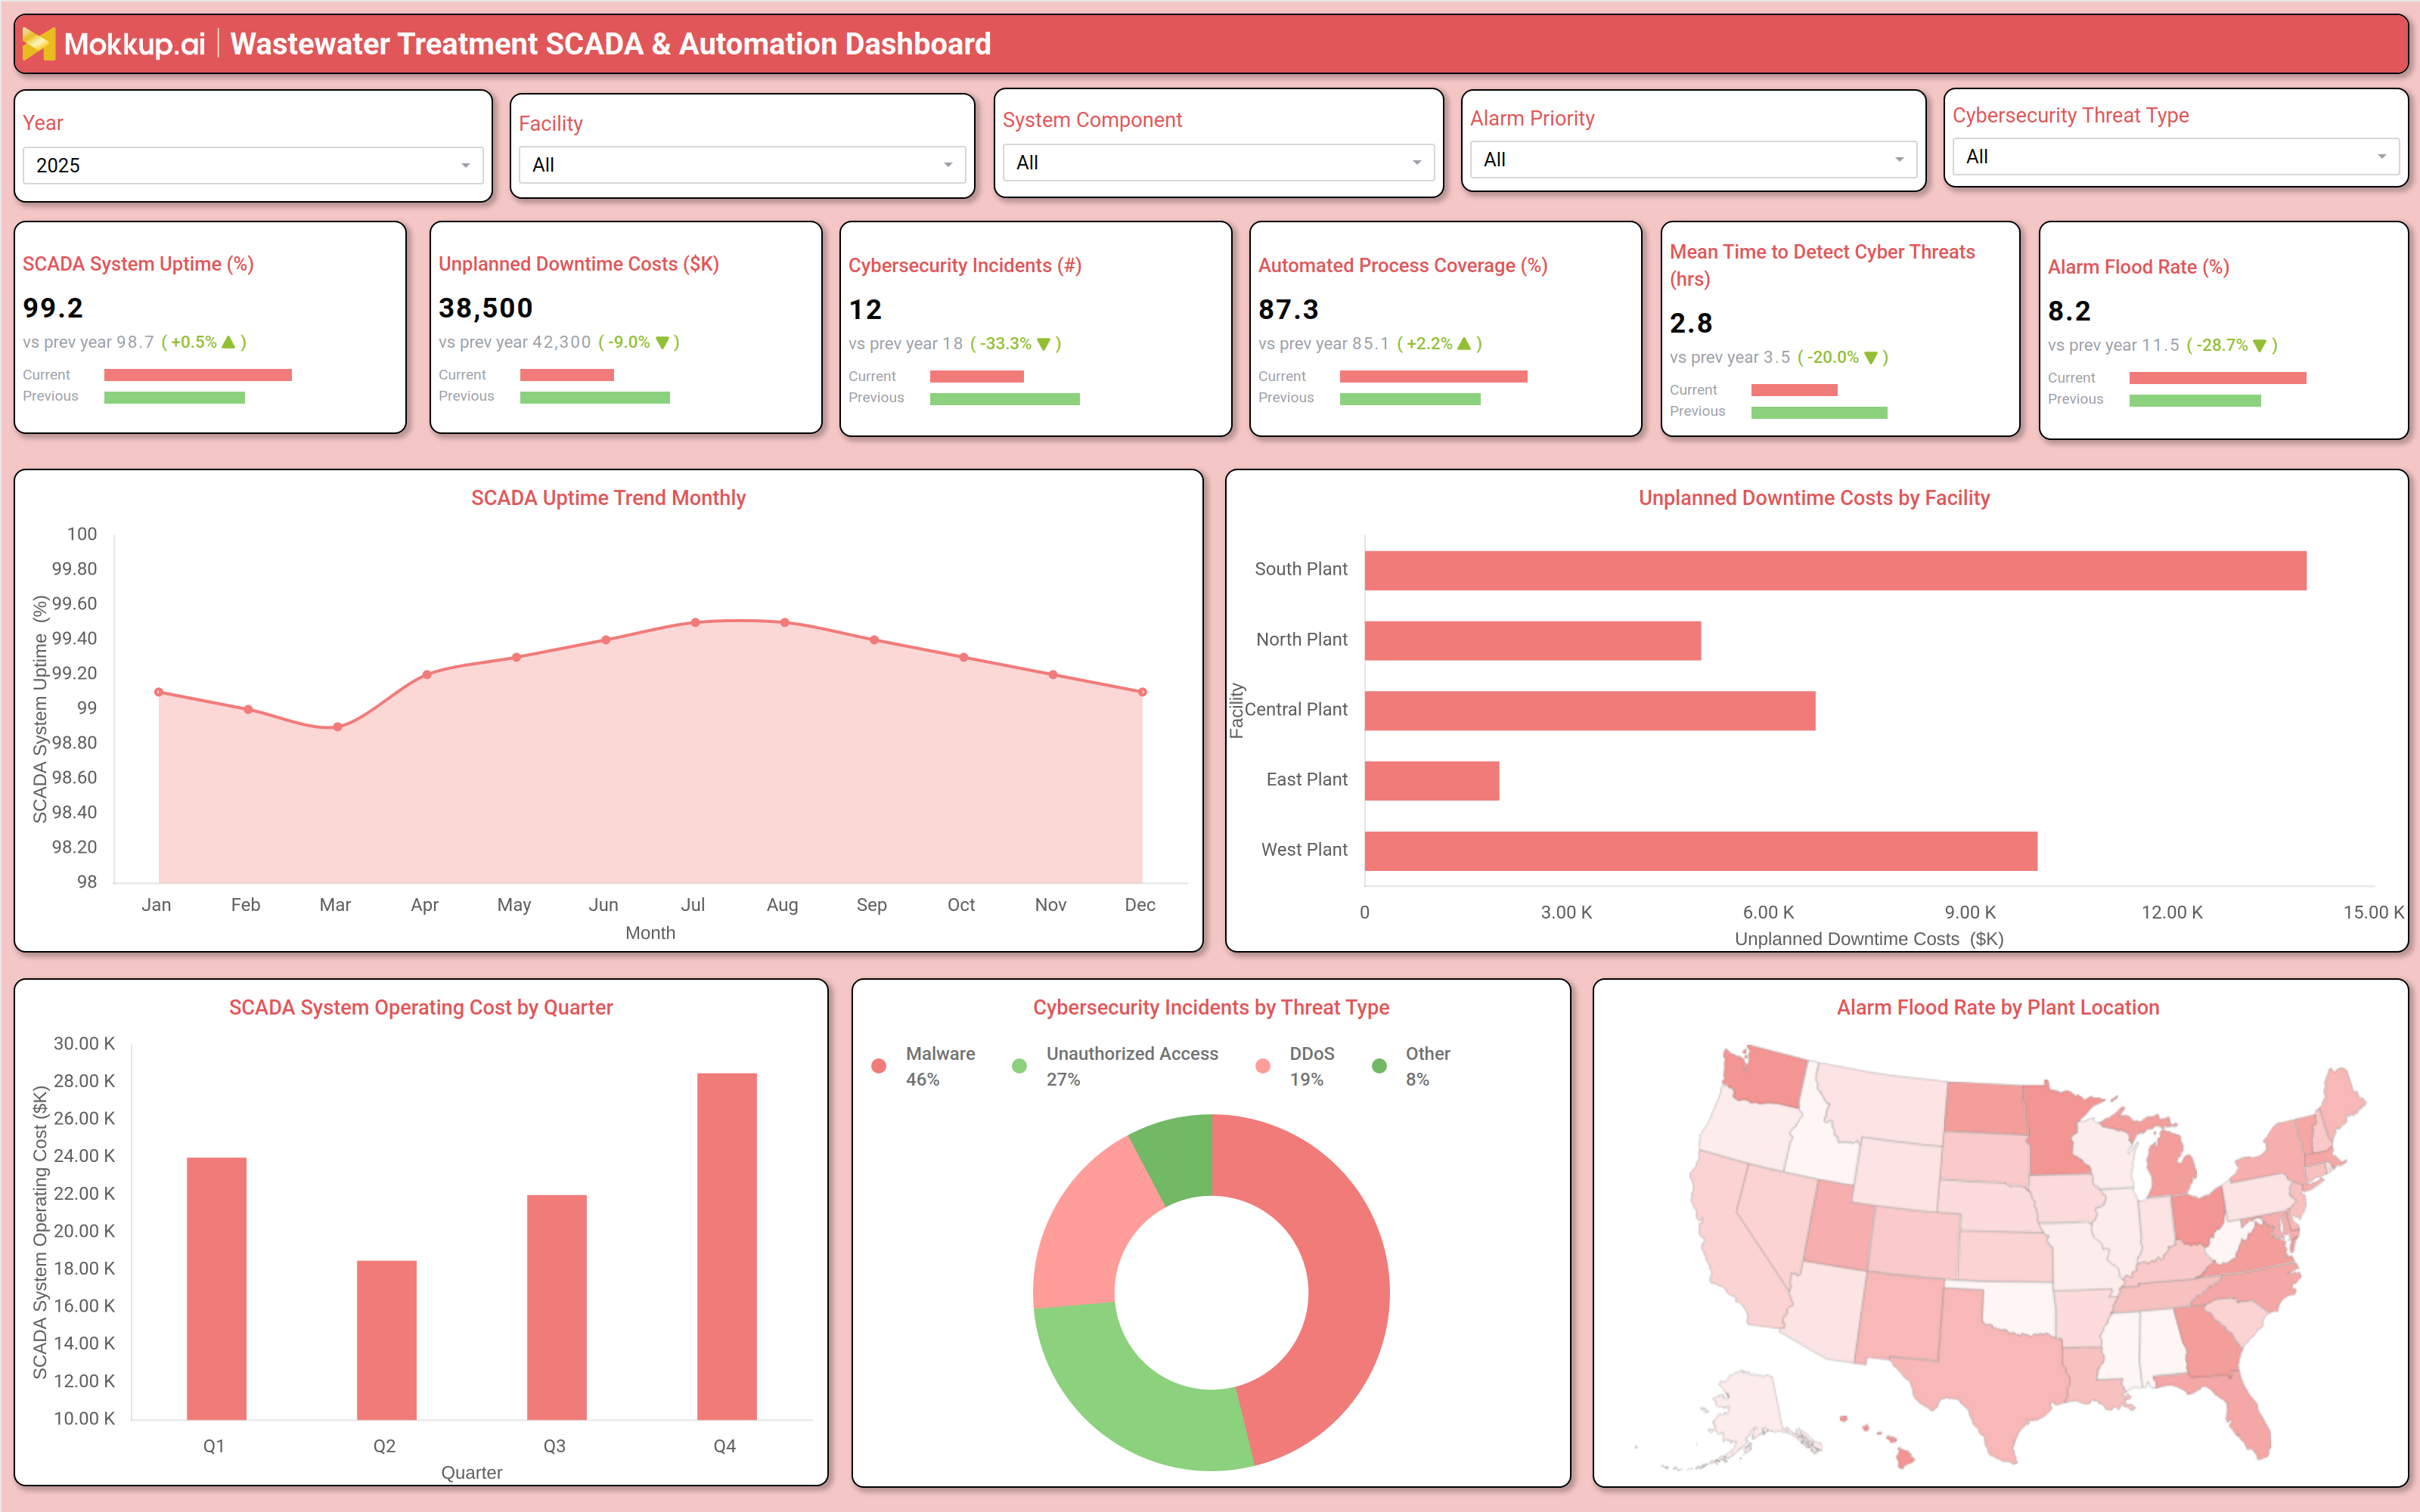
The Wastewater Treatment SCADA & Automation Dashboard is a structured operational intelligence template designed for water utility teams, plant managers, and OT engineers who need a centralized view of supervisory control and data acquisition performance across treatment facilities. This wastewater treatment SCADA dashboard template brings together critical metrics covering system uptime, unplanned downtime costs, cybersecurity incidents, automated process coverage, alarm flood rates, and mean time to detect cyber threats.
By consolidating these indicators into a single interface, operations teams can assess how reliably SCADA infrastructure is performing and where attention is needed most. The dashboard supports filtering by year, facility, system component, alarm priority, and cybersecurity threat type, allowing analysts to slice data precisely and focus on the variables that matter. Whether the goal is to ensure continuous treatment operations, reduce exposure to cyber threats, or contain escalating maintenance costs, this dashboard gives decision-makers the visibility they need without wading through disconnected data sources.
How to Create a Wastewater Treatment SCADA & Automation Dashboard
You don't need to build your report from scratch; just start with a ready-to-use dashboard template from Mokkup. Add in your data and export it however you like. Here's how to do it:
1. Create or Log in to Your Mokkup Account
Start by signing up on Mokkup.ai using your email. If you already have an account, just log in, and you'll be good to go.
2. Choose and Customize Your Dashboard Template
Find the Wastewater Treatment SCADA & Automation Dashboard template in the Templates section. Use the drag-and-drop editor to adjust KPIs, edit filters, or add elements based on your data.
3. Export to Your BI Tool
Once your dashboard wireframe is ready, use the BI Tool Export feature to send it directly to Power BI or Tableau for further analysis and enhancements. You can also download the dashboard as a PDF, PNG, or JPEG, embed it on a platform, or invite your team to collaborate.
Note: This is a Pro template. You'll need a Pro subscription on Mokkup to use and customize this dashboard wireframe. Upgrade anytime to unlock full access.
Wastewater Treatment SCADA & Automation Dashboard Example
A wastewater plant operations manager opens this dashboard at the start of a shift to get an immediate read on whether SCADA infrastructure is running within acceptable parameters across all facilities. The uptime trend view over the month helps the team understand whether system stability is improving or if recent dips in availability correlate with specific components or locations. SCADA system uptime monitoring for wastewater plants is most valuable when it surfaces patterns rather than just point-in-time readings, and this view makes that possible. When unplanned downtime costs spike at a particular facility, the horizontal bar chart by plant location puts the comparison in plain view. Teams can instantly identify which plant is generating the most cost pressure and cross-reference that against the alarm priority filter to determine whether underlying alerts went unaddressed. This kind of unplanned downtime cost analysis at a water treatment facility reduces the time it takes to go from awareness to action.
On the cybersecurity side, the dashboard supports wastewater plant cybersecurity incident tracking by breaking down incidents by threat type, including malware, unauthorized access, DDoS, and other categories. The mean time to detect cyber threats KPI tells security teams whether their detection capabilities are keeping pace with the threat environment. When detection time trends upward, it signals the need to review monitoring configurations or escalate to the OT security team before a threat materializes into a service disruption. The alarm flood rate monitoring view across plant locations gives supervisors a geographic lens into where alarm saturation is building.
How to Analyze Data in a Wastewater Treatment SCADA & Automation Dashboard
Here is how you can analyze data from this dashboard:
- Use the Year and Facility filters to isolate performance data for a specific plant and time period
- Monitor the SCADA Uptime Trend Monthly chart to identify stability dips across the calendar year
- Compare Unplanned Downtime Costs by Facility to determine which plants drive the highest operational cost pressure
- Filter by Cybersecurity Threat Type to drill into malware, unauthorized access, DDoS, or other incident categories
- Track Mean Time to Detect Cyber Threats to evaluate the responsiveness of OT security monitoring
- Use the Alarm Priority filter alongside the Alarm Flood Rate by Plant Location to pinpoint facilities with critical alarm overload
- Review SCADA System Operating Cost by Quarter to understand seasonal or operational cost trends
- Cross-reference Automated Process Coverage with downtime data to identify automation gaps driving manual intervention
Benefits of a Wastewater Treatment SCADA & Automation Dashboard
The following are the benefits of using this dashboard:
- Centralizes SCADA performance, cybersecurity, and cost data into one accessible view for operations teams
- Reduces time spent diagnosing unplanned downtime by surfacing facility-level cost comparisons instantly
- Improves OT cybersecurity posture by tracking incident volume, threat type breakdown, and detection response time
- Helps plant managers prioritize alarm response using alarm flood rate and alarm priority filters together
- Supports budget planning by providing a quarterly view of SCADA system operating costs
- Enables data-driven decisions on automation investment by tracking how much of the process is under automated coverage
- Flexible filtering by system component and facility ensures the dashboard scales across multi-plant utility networks
KPIs to Track in a Wastewater Treatment SCADA & Automation Dashboard
The following key KPIs can be tracked by using this dashboard built for unplanned downtime cost analysis of a water treatment facility and automated process coverage of wastewater operations:
- SCADA System Uptime (%): Measures the percentage of time SCADA infrastructure is operational and available; high uptime is critical for continuous treatment compliance
- Unplanned Downtime Costs ($K): Tracks the financial impact of unexpected system or equipment failures across treatment facilities
- Cybersecurity Incidents (#): Counts the number of confirmed OT and SCADA cybersecurity events within a reporting period
- Automated Process Coverage (%): Indicates the proportion of treatment processes operating under SCADA automation versus manual oversight; supports tracking of automated process coverage in wastewater operations
- Mean Time to Detect Cyber Threats (hrs): Measures how quickly the security team identifies a cybersecurity threat after it occurs; lower values indicate stronger detection capability
- Alarm Flood Rate (%): Tracks the frequency of alarm events relative to operational thresholds; elevated rates indicate control logic issues or equipment degradation
Frequently Asked Questions
1. Who should use the Wastewater Treatment SCADA & Automation Dashboard?
This dashboard is built for plant operations managers, OT engineers, utility IT/security teams, and infrastructure planners responsible for monitoring treatment facility performance. It is also useful for senior leadership who need a consolidated view of system reliability and operational costs.
2. Can this dashboard be customized for a specific plant or facility network?
Yes. The template supports filtering by facility, system component, alarm priority, and cybersecurity threat type, making it straightforward to adapt the view for a single plant or a network of facilities. In Mokkup, additional KPI tiles or chart sections can be added or removed using the drag-and-drop editor.
3. Does this dashboard help with regulatory compliance reporting for wastewater operations?
While the dashboard does not generate compliance reports directly, the visibility it provides into SCADA uptime, automated process coverage, and incident tracking gives compliance teams the operational data they need to support audit responses and regulatory submissions.