
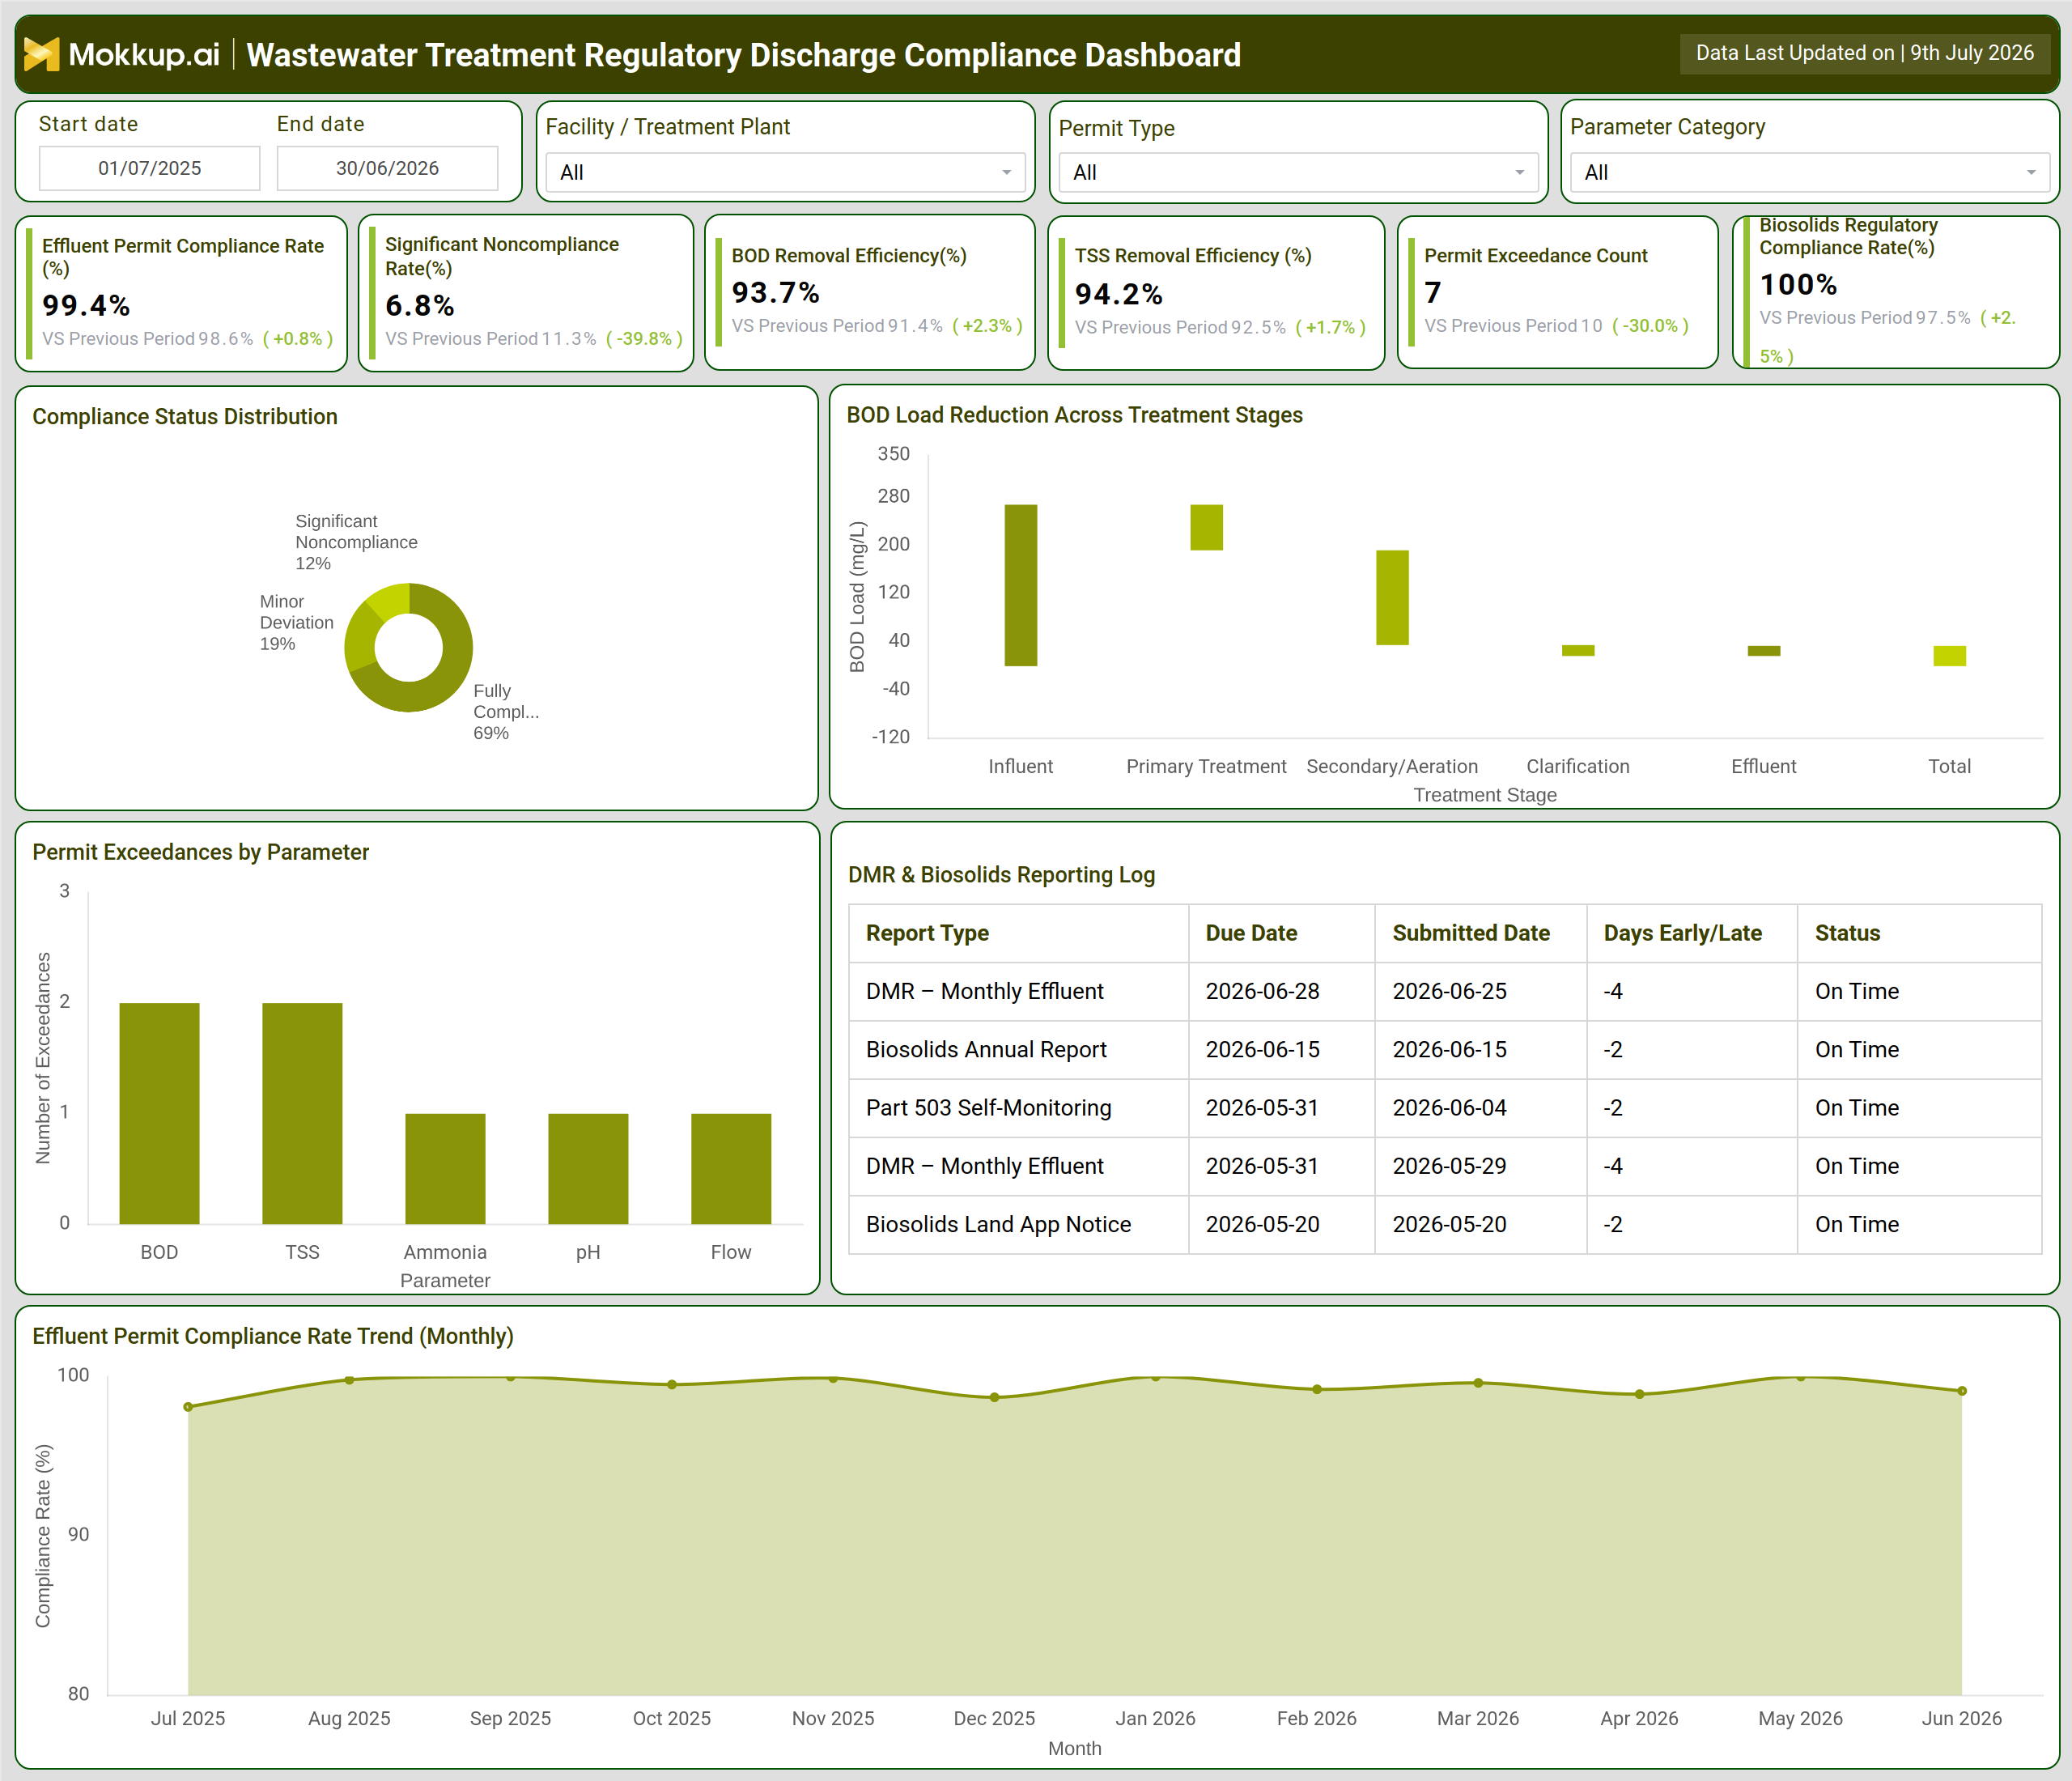
What is a Wastewater Treatment Regulatory Discharge Compliance Dashboard?
The Wastewater Treatment Regulatory Discharge Compliance Dashboard is a wastewater treatment regulatory discharge compliance dashboard designed for compliance officers, plant managers, and environmental engineers who need one consolidated view of permit performance across a treatment facility. It functions as an effluent permit compliance rate tracking tool, pulling discharge quality, biosolids reporting, and permit exceedance data into a single workspace instead of scattered spreadsheets and quarterly compliance binders. Regulatory teams often treat it as an NPDES discharge monitoring report dashboard because it keeps every DMR, biosolids annual report, and Part 503 self-monitoring filing visible alongside permit compliance trends. Filters for facility, permit type, and parameter category let users narrow the view to a specific treatment plant or pollutant of concern, while the date range control supports both monthly reviews and full annual permit cycles.
How to Create a Wastewater Treatment Regulatory Discharge Compliance Dashboard
You don’t need to build your report from scratch; just start with a ready-to-use dashboard template from Mokkup. Add in your data and export it however you like. Here’s how to do it:
1. Create or Log in to Your Mokkup Account
Start by signing up on Mokkup.ai using your email. If you already have an account, just log in, and you'll be good to go.
2. Choose and Customize Your Dashboard Template
Find the Wastewater Treatment Regulatory Discharge Compliance Dashboard template in the Templates section. Use the drag-and-drop editor to adjust KPIs, edit filters, or add elements based on your data.
3. Export to Your BI Tool
Once your dashboard wireframe is ready, use the BI Tool Export feature to send it directly to Power BI or Tableau for further analysis and enhancements. You can also download the dashboard as a PDF, PNG, or JPEG, embed it on a platform, or invite your team to collaborate.
Note: This is a Pro template. You'll need a Pro subscription on Mokkup to use and customize this dashboard wireframe. Upgrade anytime to unlock full access.
Wastewater Treatment Regulatory Discharge Compliance Dashboard Example
A wastewater treatment compliance officer typically opens this dashboard ahead of a regulatory review or when preparing a discharge monitoring report submission, looking to confirm the facility is holding steady against its permit conditions before an inspector or auditor asks. The question driving that visit is simple: is the plant fully compliant right now, and if not, where is the risk concentrated?
From the top of the dashboard, the compliance team can gauge overall permit standing and immediately spot whether noncompliance events are trending up or down compared to the prior period. If the significant non-compliance rate ticks upward, the team can drill into which specific parameter, whether BOD, TSS, ammonia, pH, or flow, is driving the exceedance and prioritize corrective action before the next reporting cycle. Plant engineers can compare BOD load reduction across each treatment stage, from influent through clarification, to identify which stage of the process is underperforming and pull removal efficiency back into range.
Over time, tracking the compliance rate trend month over month helps the team recognize seasonal patterns, such as periods when influent load rises, and effluent quality comes under more pressure, so mitigation steps can be planned in advance rather than reacted to after a violation is logged. Altogether, the dashboard doubles as a permit exceedance tracking wastewater treatment plant tool that keeps the facility audit-ready, catches risk before a violation is logged, and gives the team a defensible compliance record to present to regulators without a last-minute scramble.
How to Analyze Data in a Wastewater Treatment Regulatory Discharge Compliance Dashboard
Here is how you can analyze data from this dashboard:
- Use this effluent permit compliance rate tracking tool to confirm overall permit standing before filing monthly reports.
- Filter by facility, permit type, or parameter category to isolate the compliance view relevant to a specific site or pollutant.
- Compare the significant noncompliance rate against the previous period to confirm whether corrective actions are working.
- Track BOD and TSS removal efficiency to support BOD removal efficiency trend analysis that wastewater engineers use when adjusting aeration or clarification stages.
- Review the compliance status distribution donut to see the split between fully compliant, minor deviation, and significant noncompliance events.
- Use the BOD load reduction waterfall to pinpoint which treatment stage, from influent to effluent, is removing the least load.
- Break down permit exceedances by parameter (BOD, TSS, ammonia, pH, flow) to prioritize which pollutant needs corrective action first.
- Rely on this NPDES discharge monitoring report dashboard to confirm every DMR, biosolids annual report, and Part 503 filing was submitted before its due date.
- Monitor the monthly effluent permit compliance rate trend to catch seasonal dips before they turn into permit exceedances.
Benefits of a Wastewater Treatment Regulatory Discharge Compliance Dashboard
The following are the benefits of using this dashboard:
- Centralizes effluent, biosolids, and discharge monitoring compliance data in a single wastewater treatment regulatory discharge compliance dashboard.
- Reduces the manual effort of reconciling lab results, DMR logs, and permit conditions across spreadsheets.
- Supports permit exceedance tracking wastewater treatment plant teams need before enforcement action is triggered.
- Improves audit readiness with a documented history of compliance status and reporting timeliness.
- Gives plant managers a facility-level and parameter-level view without switching between reporting tools.
- Helps compliance teams demonstrate a defensible record during regulatory inspections and audits.
KPIs to Track in a Wastewater Treatment Regulatory Discharge Compliance Dashboard
The following key KPIs can be tracked by using this dashboard:
- Effluent Permit Compliance Rate (%) - measures the share of monitoring results that meet permit discharge limits.
- Significant Noncompliance Rate (%) - tracks the percentage of results classified as significant non compliance under permit thresholds.
- BOD Removal Efficiency (%) - shows how effectively the treatment process reduces biochemical oxygen demand from influent to effluent, supporting BOD removal efficiency trend analysis wastewater engineers use to validate treatment changes.
- TSS Removal Efficiency (%) - measures the reduction in total suspended solids achieved through the treatment train.
- Permit Exceedance Count - counts the number of permit limit violations recorded in the selected period.
- Biosolids Regulatory Compliance Rate (%) - tracks adherence to biosolids handling, reporting, and land application requirements.
Frequently Asked Questions
1. What is a Wastewater Treatment Regulatory Discharge Compliance Dashboard used for?
It is used to monitor effluent permit compliance, treatment efficiency, and discharge monitoring report submissions in one workspace. Compliance officers and plant managers rely on this effluent permit compliance rate tracking tool, which doubles as a biosolids regulatory compliance monitoring dashboard, to catch permit exceedances early and stay prepared for regulatory audits.
2. Which KPIs matter most on this dashboard?
Effluent permit compliance rate, significant noncompliance rate, and permit exceedance count show overall permit standing. BOD removal efficiency, TSS removal efficiency, and biosolids regulatory compliance rate confirm that the treatment process and biosolids handling are performing as required.
3. Can this dashboard be customized for a specific treatment facility?
Yes. The Mokkup template supports filtering by facility, permit type, and parameter category, and every KPI, filter, and chart can be adjusted with your own data using the drag-and-drop editor.