
What is a Wastewater Treatment Quality Lab Testing Dashboard?
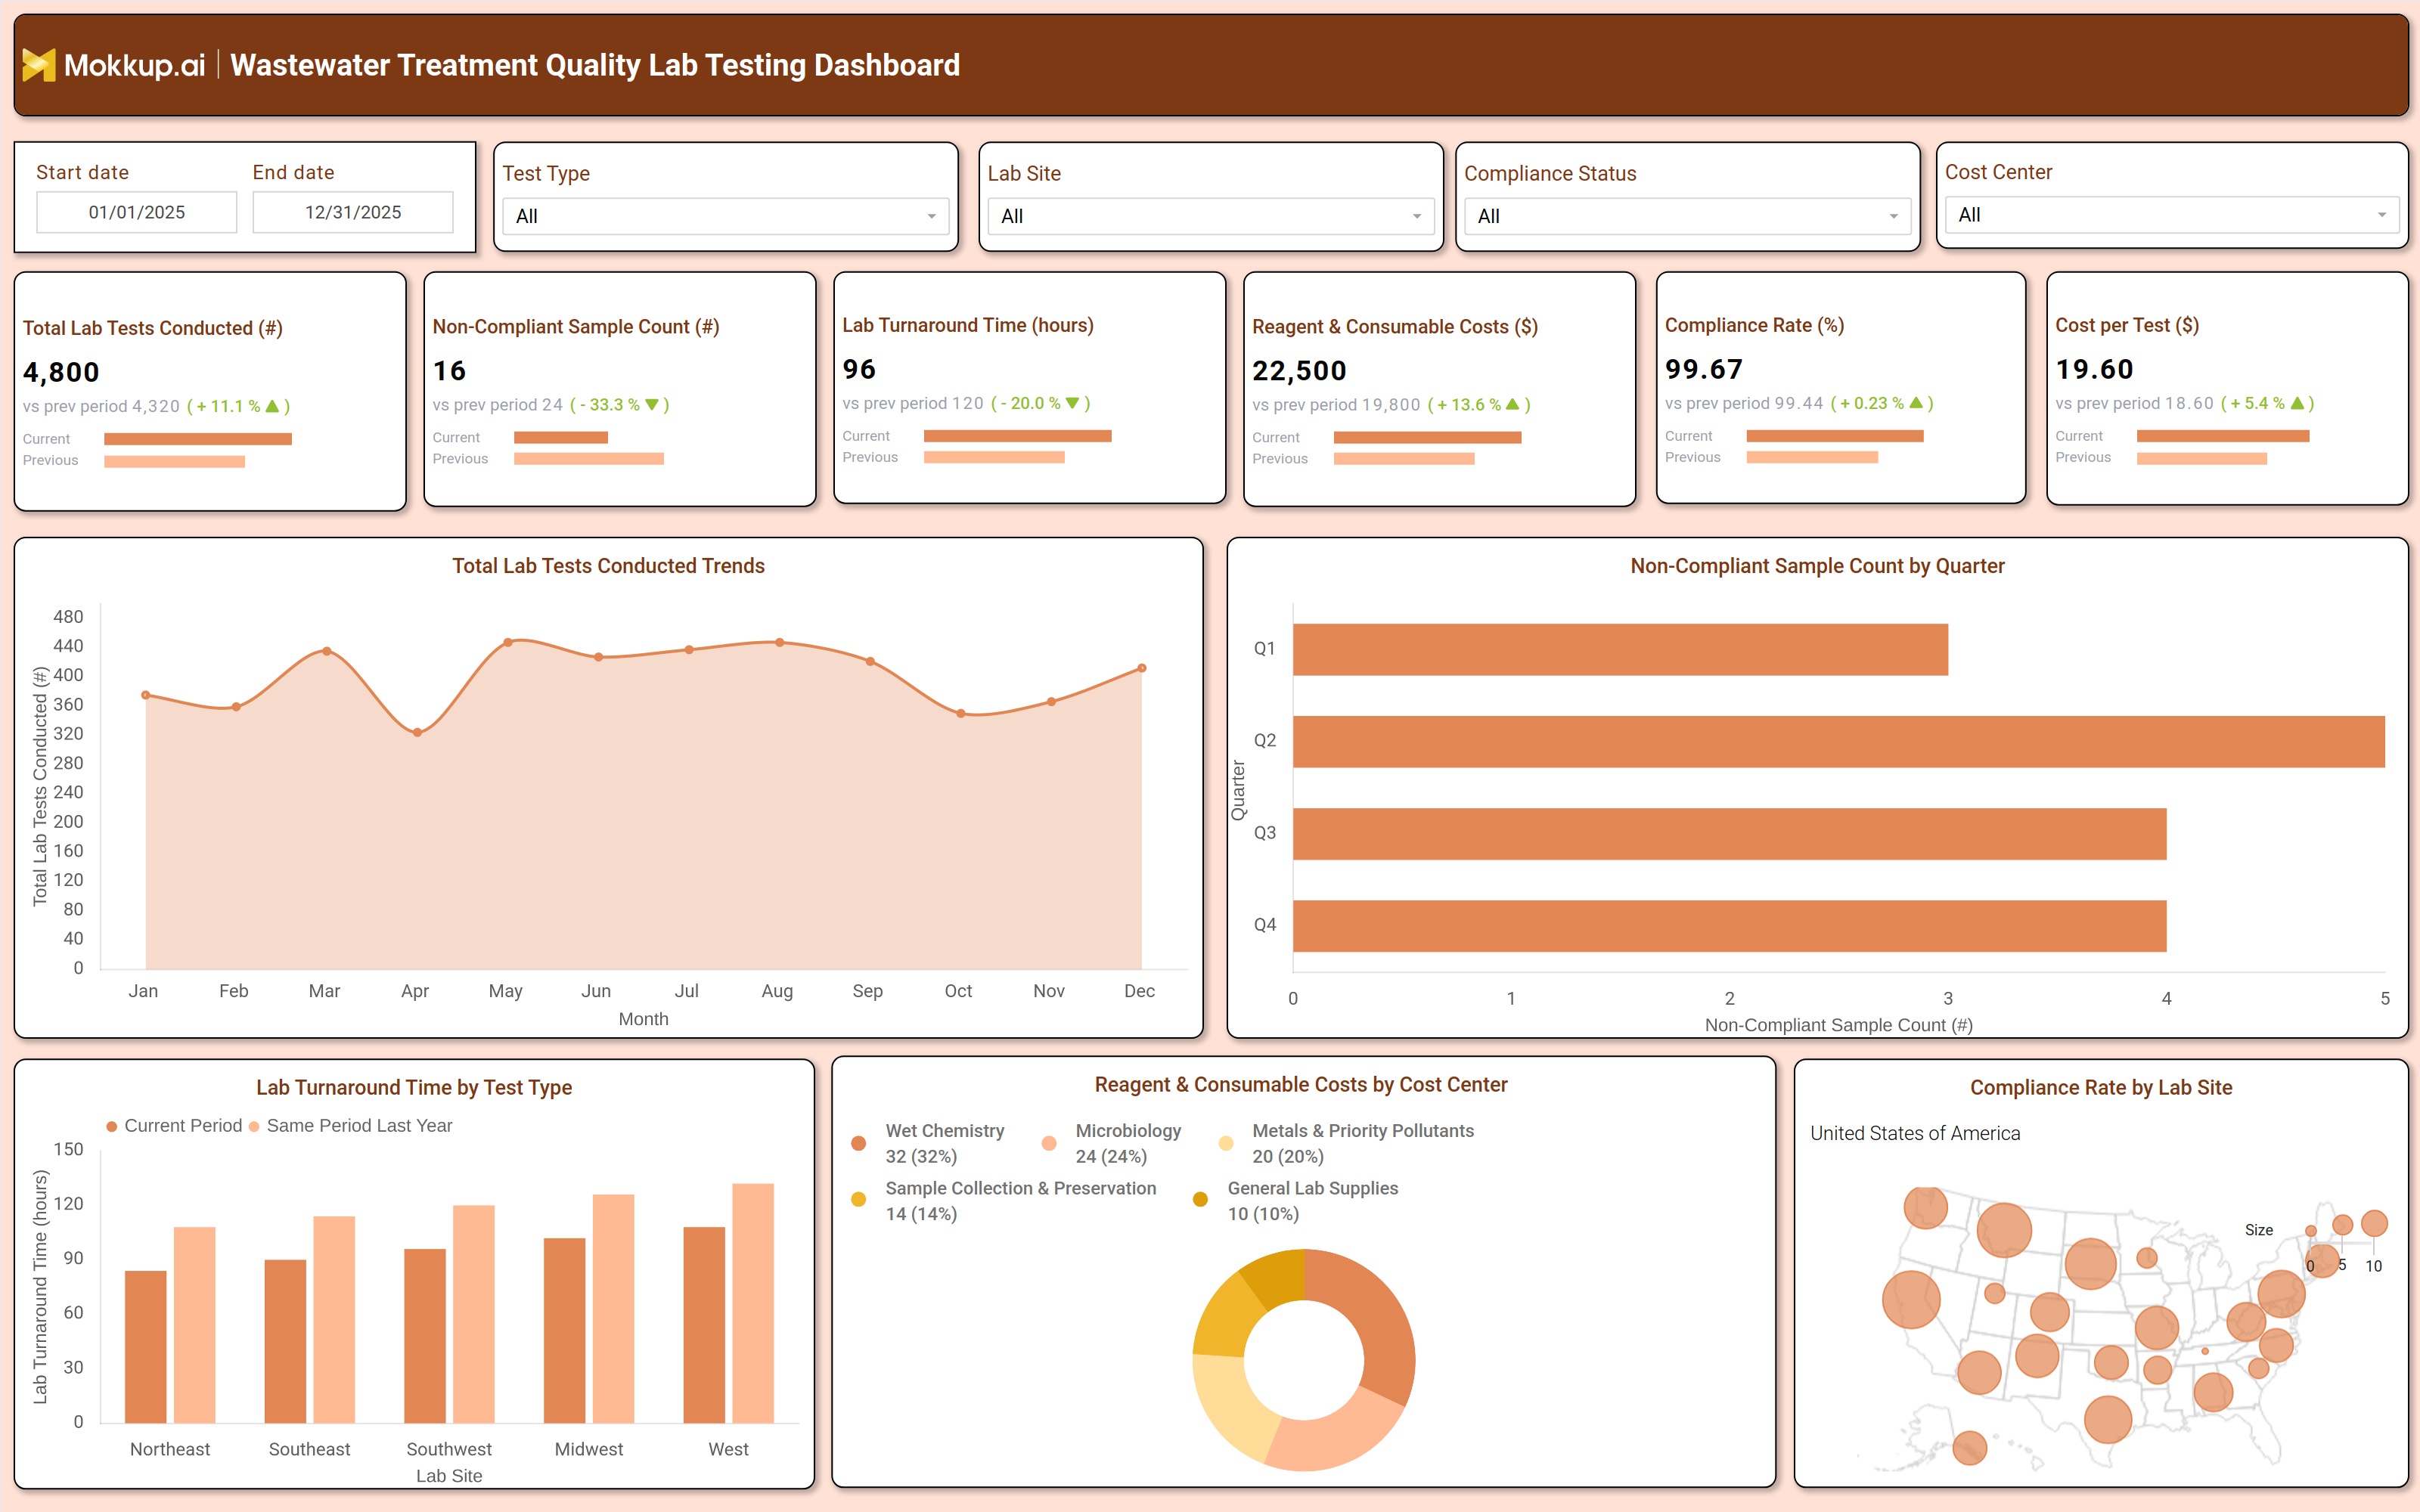
The Wastewater Treatment Quality Lab Testing Dashboard is a structured analytical tool designed for water utilities, municipal treatment facilities, and environmental compliance teams. It consolidates lab testing data across multiple sites into a single view, giving quality managers and lab supervisors a clear picture of testing volume, compliance standing, turnaround performance, and operational costs. This wastewater lab testing compliance dashboard removes the manual effort of aggregating reports from individual lab sites and replaces it with a filterable, up-to-date view of what is happening across the entire testing operation. Water treatment facilities are under constant pressure to meet regulatory standards while managing the cost of testing reagents, staff time, and equipment.
The dashboard addresses this by presenting key metrics side by side, so teams can quickly identify where performance is on track and where it is not. Filters for test type, lab site, compliance status, and cost center allow managers to narrow their analysis to exactly the segment that needs attention, making water treatment quality monitoring analytics far more efficient than static spreadsheet-based reporting. For environmental compliance officers and lab directors, this dashboard provides the evidence base needed for regulatory submissions, internal audits, and resource allocation decisions. Rather than pulling data from disparate systems, analysts work from a single template that reflects current testing activity and trends over time.
How to Create a Wastewater Treatment Quality Lab Testing Dashboard
You don't need to build your report from scratch, just start with a ready-to-use dashboard template from Mokkup. Add in your data and export it however you like. Here's how to do it:
1. Create or Log in to Your Mokkup Account
Start by signing up on Mokkup.ai using your email. If you already have an account, just log in, and you'll be good to go.
2. Choose and Customize Your Dashboard Template
Find the Wastewater Treatment Quality Lab Testing Dashboard template in the Templates section. Use the drag-and-drop editor to adjust KPIs, edit filters, or add elements based on your data.
3. Export to Your BI Tool
Once your dashboard wireframe is ready, use the BI Tool Export feature to send it directly to Power BI or Tableau for further analysis and enhancements. You can also download the dashboard as a PDF, PNG, or JPEG, embed it on a platform, or invite your team to collaborate.
Note: This is a Pro template. You'll need a Pro subscription on Mokkup to use and customize this dashboard wireframe. Upgrade anytime to unlock full access.
Wastewater Treatment Quality Lab Testing Dashboard Example
A lab quality manager at a regional water utility opens this dashboard at the start of each month to assess how the testing program performed against compliance and efficiency targets. Rather than requesting separate reports from each lab site, the manager uses the Lab Site and Test Type filters to isolate specific segments of interest. The overview immediately shows whether the testing volume held steady or shifted relative to the prior period, and whether the compliance rate across sites is within acceptable thresholds. When compliance concerns surface, the manager uses the non-compliant sample analysis dashboard capability to compare which quarters had elevated non-compliance counts.
This quarterly view helps identify whether a spike was isolated to a specific period or reflects an ongoing trend that requires process correction. If a particular lab site is consistently contributing to non-compliant results, the team can prioritize an audit of that location's testing procedures before the next reporting cycle. On the cost side, operations managers track how reagent and consumable spending is distributed across cost centers using the donut chart view. This allows budget owners to compare spending patterns and assess whether the cost per test is moving in line with testing volume.
Lab turnaround time tracking for water utilities is another key use case: by comparing current period performance against the same period last year across five regional lab sites, Northeast, Southeast, Southwest, Midwest, and West, managers assess where processing delays are building and take action before they affect regulatory submission timelines.The overall outcome is a testing operation that is easier to govern. Teams spend less time compiling data and more time acting on it. The dashboard gives compliance officers, lab directors, and operations managers a shared view of performance that supports both day-to-day decisions and longer-term planning.
How to Analyze Data in a Wastewater Treatment Quality Lab Testing Dashboard
Here is how you can analyze data from this dashboard:
- Filter by Lab Site and Compliance Status to isolate underperforming locations and prioritize corrective action
- Use the Total Lab Tests Conducted Trends line chart to identify seasonal patterns in testing volume across the year
- Compare quarterly non-compliant sample counts to detect whether compliance issues are concentrated in specific periods
- Assess lab turnaround time tracking for water utilities by comparing current period vs. same period last year across all regional sites
- Apply the Cost Center filter with the Reagent & Consumable Costs donut chart to identify which centers are driving spending increases
- Track Cost per Test alongside total testing volume to determine whether cost changes reflect scale or inefficiency
- Use the Compliance Rate by Lab Site map to pinpoint geographic locations with below-average compliance scores
- Set date range filters to align the analysis window with regulatory reporting periods or internal audit cycles
Benefits of a Wastewater Treatment Quality Lab Testing Dashboard
The following are the benefits of using this dashboard:
- Centralizes lab testing data from multiple sites into one filterable view, reducing manual report aggregation
- Supports environmental compliance rate dashboard template use cases by surfacing compliance metrics alongside cost and volume data
- Enables faster identification of non-compliant sample trends before they escalate into regulatory violations
- Allows operations teams to compare reagent cost tracking for wastewater laboratory operations across cost centers
- Reduces time spent preparing compliance submissions by making key metrics immediately accessible
- Provides a consistent analytical structure that lab directors and compliance officers can use across reporting cycles
KPIs to Track in a Wastewater Treatment Quality Lab Testing Dashboard
The following key KPIs can be tracked by using this dashboard:
- Total Lab Tests Conducted (#): Measures the total number of lab tests processed in the selected period, indicating testing capacity utilization and workload volume
- Non-Compliant Sample Count (#): Tracks the number of samples that failed to meet regulatory or quality standards, a core input for non-compliant sample analysis dashboard workflows
- Lab Turnaround Time (hours): Measures the average time from sample receipt to result delivery, used to assess processing efficiency across lab sites
- Reagent & Consumable Costs ($): Tracks total spending on testing materials, enabling cost control and budget adherence for reagent cost tracking in wastewater laboratory operations
- Compliance Rate (%): Indicates the percentage of samples that met all required quality and regulatory standards, the primary metric for water treatment quality monitoring analytics and regulatory reporting
- Cost per Test ($): Measures the average cost to complete a single lab test, combining reagent, labor, and overhead expenses to assess operational efficiency
Frequently Asked Questions
1. What is the Wastewater Treatment Quality Lab Testing Dashboard used for?
It is used by water utilities and municipal treatment facilities to monitor lab testing volume, compliance rates, turnaround times, and reagent costs across multiple lab sites. Quality managers and compliance officers use it to track performance against regulatory standards and identify areas that need attention.
2. How does this dashboard support environmental compliance monitoring?
The dashboard tracks non-compliant sample counts by quarter and compliance rates by lab site, giving teams a clear view of where standards are being met and where they are not. This makes it well-suited for wastewater lab testing compliance dashboard workflows tied to regulatory reporting and audit preparation.
3. Can this dashboard be used in Power BI or Tableau?
Yes. The Wastewater Treatment Quality Lab Testing Dashboard is built as a wireframe template in Mokkup and exports directly to Power BI or Tableau using the BI Tool Export feature. Teams can also download it as a PDF, PNG, or JPEG for presentations or share it with collaborators directly from the platform.