What is a Wastewater Treatment Expansion Dashboard?
A Wastewater Treatment Expansion Dashboard is a centralized analytics tool designed to monitor, track, and optimize the scaling of wastewater treatment infrastructure. It consolidates key performance indicators (KPIs) such as capital expenditure (CapEx), regulatory approvals, treatment efficiency, and construction milestones into a single interface. Municipalities, industrial plants, and utility operators use this wastewater infrastructure growth monitoring software to assess expansion progress, allocate funding, and ensure compliance with environmental regulations. By providing a clear view of capacity additions, cost performance, and project timelines, the dashboard enables data-driven decision-making for efficient wastewater treatment expansion analytics.
How to Create a Wastewater Treatment Expansion Dashboard
You don't need to build your report from scratch, just start with a ready-to-use dashboard template from Mokkup. Add in your data and export it however you like. Here's how to do it:
1. Create or Log in to Your Mokkup Account
Start by signing up on Mokkup.ai using your email. If you already have an account, just log in, and you'll be good to go.
2. Choose and Customize Your Dashboard Template
Find the Wastewater Treatment Expansion Dashboard template in the Templates section. Use the drag-and-drop editor to adjust KPIs, edit filters, or add elements based on your data.
3. Export to Your BI Tool
Once your dashboard wireframe is ready, use the BI Tool Export feature to send it directly to Power BI or Tableau for further analysis and enhancements. You can also download the dashboard as a PDF, PNG, or JPEG, embed it on a platform, or invite your team to collaborate.
Note: This is a Pro template. You'll need a Pro subscription on Mokkup to use and customize this dashboard wireframe. Upgrade anytime to unlock full access.
Wastewater Treatment Expansion Dashboard Example
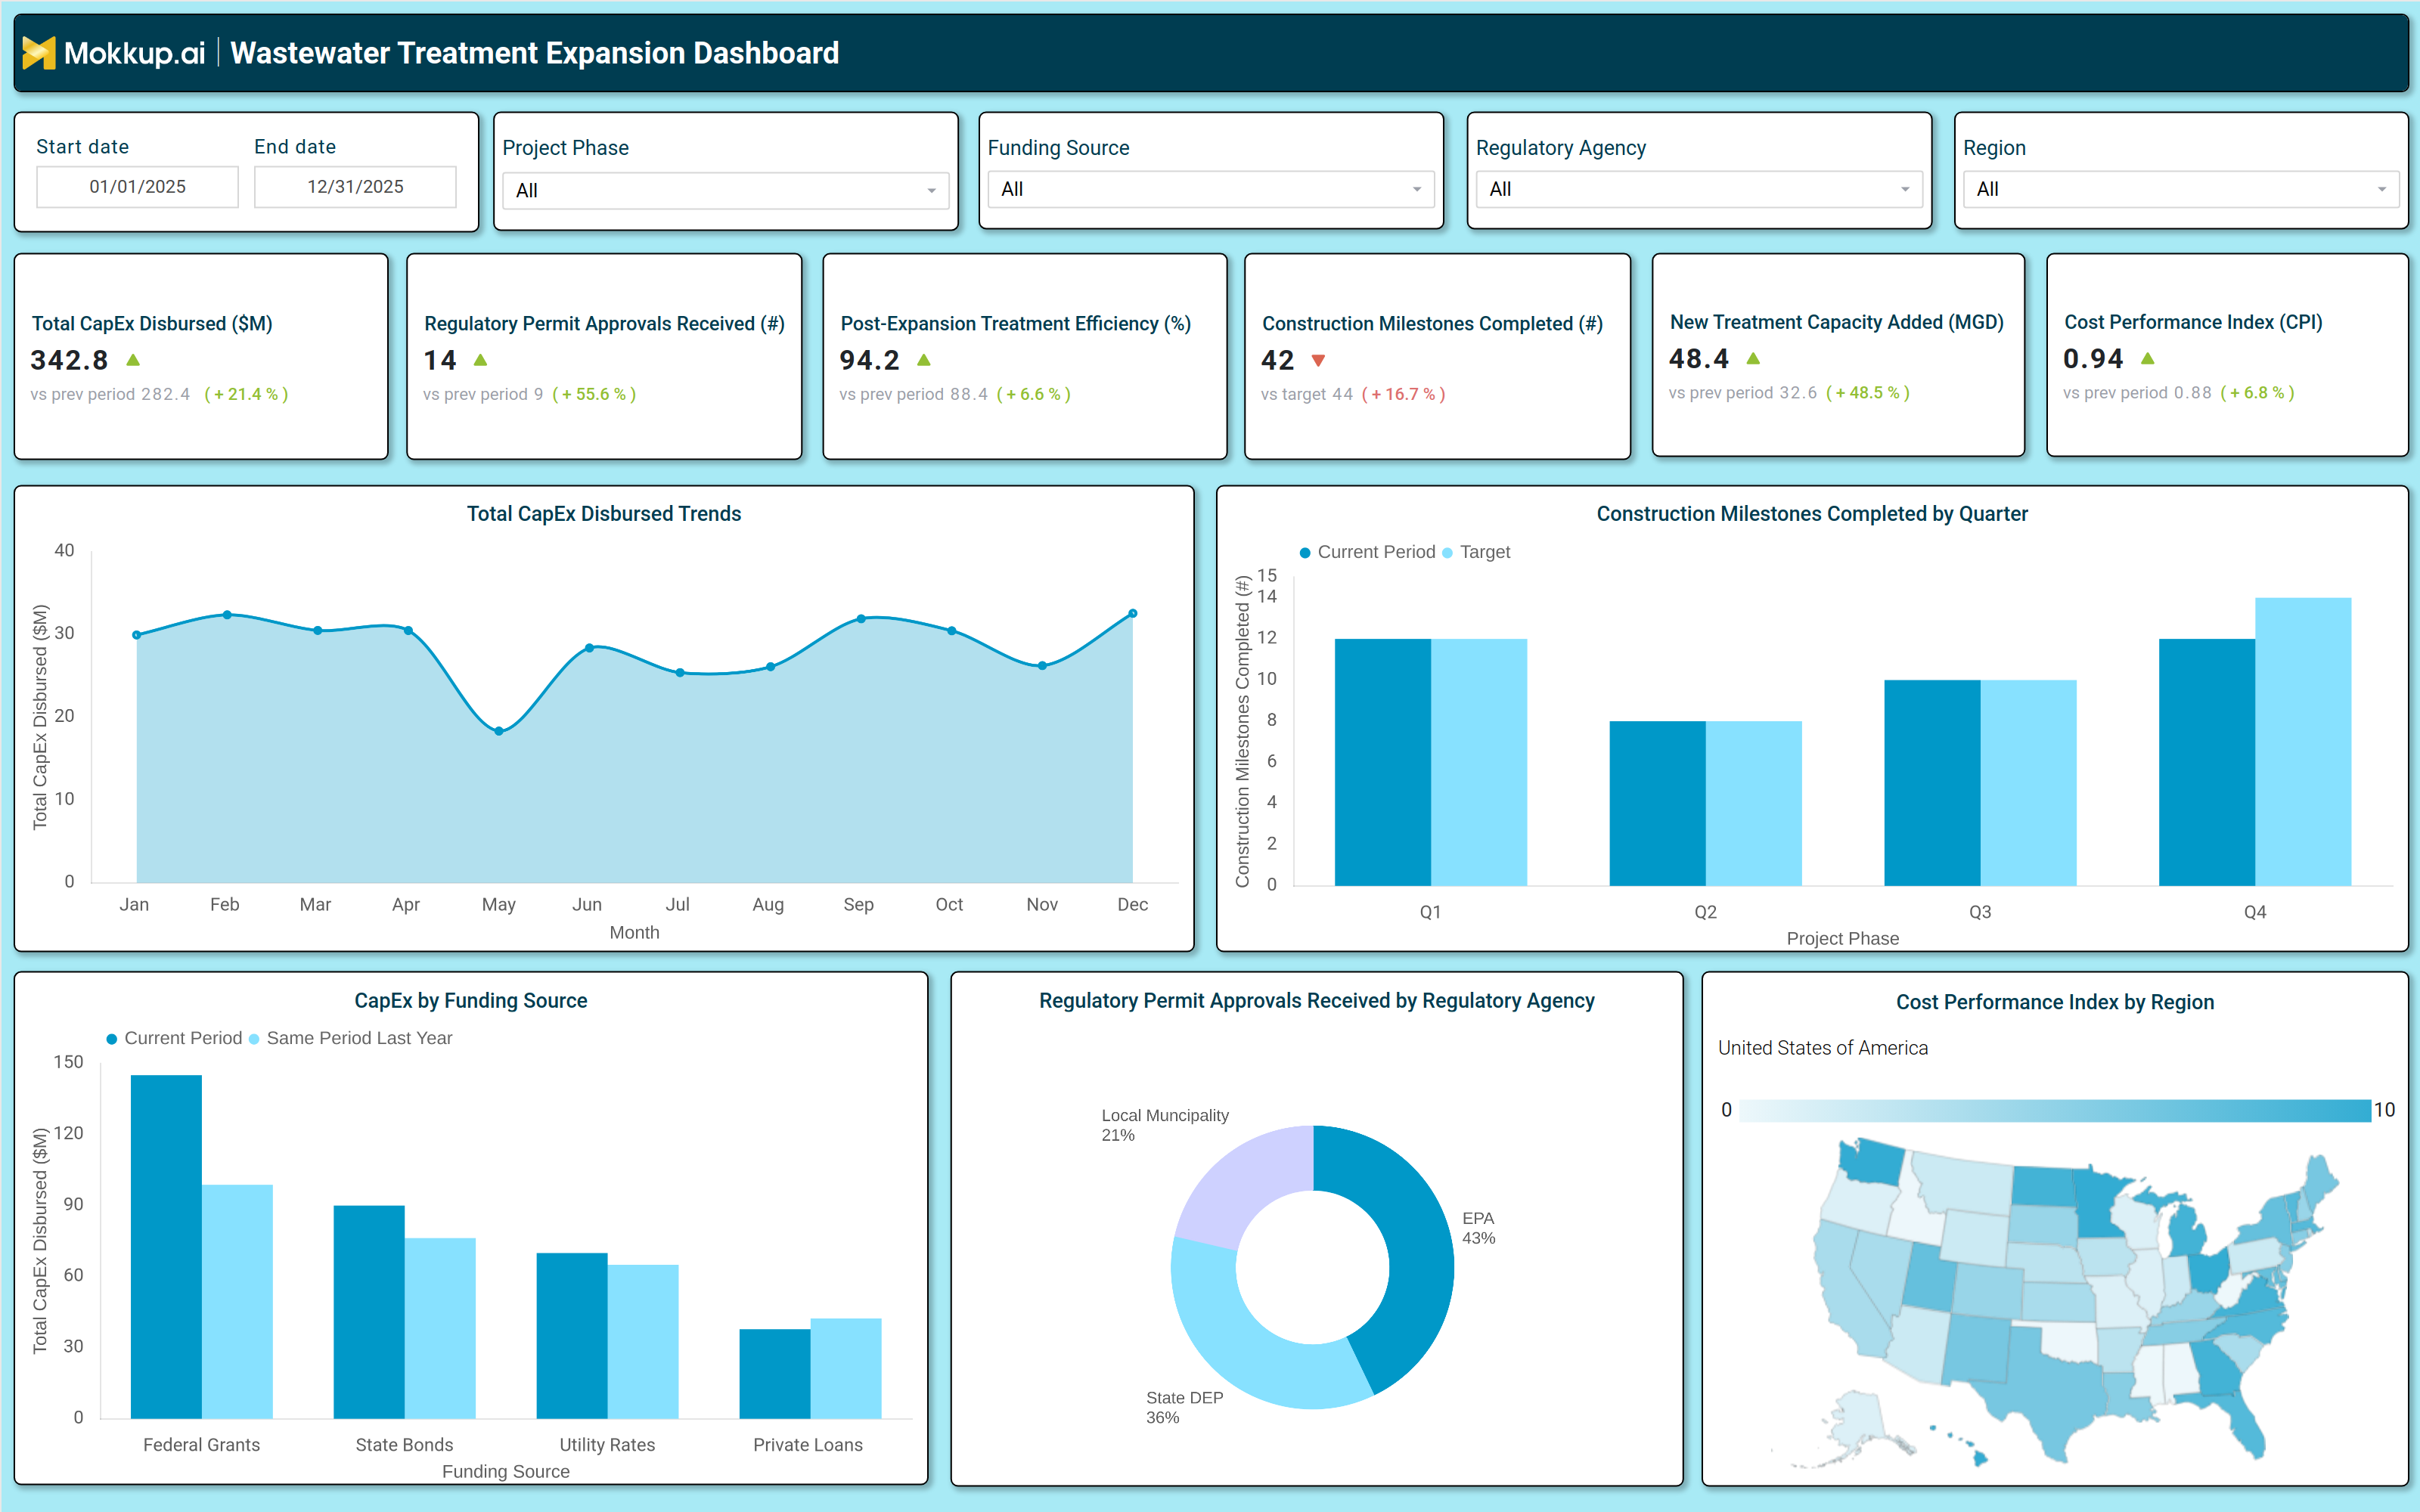
A typical dashboard for scaling wastewater treatment capacity includes interactive filters for date ranges, project phases, funding sources, and regulatory agencies. Key metrics displayed in performance tiles include total CapEx disbursed, regulatory permit approvals, post-expansion treatment efficiency, construction milestones completed, new treatment capacity added, and cost performance index (CPI). Trend charts compare monthly CapEx spending against previous periods, while bar graphs break down funding sources such as federal grants, state bonds, and private loans. A geographic heatmap visualizes cost performance by region, and a pie chart categorizes regulatory approvals by agency. Together, these components form a regulatory permit approval dashboard that helps operators monitor expansion progress, identify bottlenecks, and optimize resource allocation.
How to Analyze Data in a Wastewater Treatment Expansion Dashboard
Here is how you can analyze data from this dashboard:
- Track Total CapEx Disbursed: Monitor overall capital expenditure utilization and compare spending trends across previous periods to ensure budgets stay on track.
- Review Regulatory Permit Approvals: Keep track of permit approval status to maintain compliance and minimize the risk of project delays.
- Assess Post-Expansion Treatment Efficiency: Evaluate operational performance after capacity expansion to ensure upgraded infrastructure meets expected efficiency targets.
- Monitor Construction Milestones: Track project progress against planned timelines to identify delays and improve execution visibility.
- Evaluate New Treatment Capacity Added: Measure the increase in treatment capacity to assess infrastructure growth and future scalability.
- Analyze Cost Performance Index (CPI): Review CPI metrics to understand project cost efficiency and identify areas requiring better financial control.
- Compare Funding Sources: Analyze the contribution of grants, bonds, and private investments to understand funding dependencies and financing strategies.
- Use Regional Heatmaps for Insights: Leverage geographic heatmaps to identify regional cost variations, performance gaps, and operational inefficiencies across locations.
Benefits of a Wastewater Treatment Expansion Dashboard
The following are the benefits of using this treatment capacity growth dashboard:
- Enhances Visibility into Expansion Progress: Provides clear insights into project progress, funding status, and regulatory compliance to improve overall operational transparency.
- Optimizes Capital Expenditure: Tracks budget utilization and cost efficiency metrics to help control spending and maximize investment value.
- Accelerates Decision-Making: Delivers actionable data on construction milestones and capacity growth to support faster and more informed decisions.
- Improves Regulatory Compliance: Monitors permit approvals and regulatory requirements to reduce compliance risks and maintain project continuity.
- Supports Sustainable Infrastructure Scaling: Measures treatment efficiency after expansion to ensure infrastructure growth remains effective and sustainable.
- Reduces Project Delays: Identifies bottlenecks related to construction activities, approvals, and funding to minimize disruptions and timeline overruns.
- Enables Data-Driven Expansion Planning: Supports strategic planning using insights from wastewater treatment plant expansion planning tools and performance analytics.
KPIs to Track in a Wastewater Treatment Expansion Dashboard
The following key KPIs can be tracked by using this dashboard:
- Total CapEx Disbursed ($M): Measures total capital spent on expansion projects.
- Regulatory Permit Approvals (count): Tracks the number of permits secured for construction and operation.
- Post Expansion Treatment Efficiency (%): Evaluates the effectiveness of upgraded treatment processes.
- Construction Milestones Completed (count): Monitors progress against planned project phases.
- New Treatment Capacity Added (MGD): Measures additional wastewater processing capacity in million gallons per day.
- Cost Performance Index (CPI): Assesses financial efficiency by comparing planned vs. actual costs.
Frequently Asked Questions
1. What is a wastewater CapEx monitoring dashboard used for?
It provides a unified view of expansion progress, funding, and efficiency, enabling better resource allocation and compliance tracking.
2. What data sources feed into this utility expansion tracking dashboard?
Financial systems, regulatory databases, construction management tools, and operational performance reports.
3. Who should use a wastewater treatment expansion dashboard?
Municipal water managers, industrial plant operators, environmental engineers, and utility executives.