
What is a Wastewater Collection Executive Overview Dashboard?
The Wastewater Collection Executive Overview Dashboard is a centralized monitoring tool designed for utility executives, operations managers, and public works directors who need a high-level view of their wastewater collection network. It consolidates critical operational, financial, and service delivery metrics into a single interface, eliminating the need to navigate multiple reports to understand system health. Built for municipal utilities and regional water authorities, the wastewater collection executive overview dashboard covers network availability, environmental compliance, infrastructure investment, and cost performance in one place. Decision-makers use filters for region, service area, asset type, and customer segment to drill into any area of concern, making it easier to identify issues before they escalate. The dashboard is especially effective for leadership teams reporting performance to governing boards or regulatory agencies.
How to Create a Wastewater Collection Executive Overview Dashboard
You don't need to build your report from scratch; just start with a ready-to-use dashboard template from Mokkup. Add in your data and export it however you like. Here's how to do it:
1. Create or Log in to Your Mokkup Account
Start by signing up on Mokkup.ai using your email. If you already have an account, just log in, and you'll be good to go.
2. Choose and Customize Your Dashboard Template
Find the Wastewater Collection Executive Overview Dashboard template in the Templates section. Use the drag-and-drop editor to adjust KPIs, edit filters, or add elements based on your data.
3. Export to Your BI Tool
Once your dashboard wireframe is ready, use the BI Tool Export feature to send it directly to Power BI or Tableau for further analysis and enhancements. You can also download the dashboard as a PDF, PNG, or JPEG, embed it on a platform, or invite your team to collaborate.
Note: This is a Pro template. You'll need a Pro subscription on Mokkup to use and customize this dashboard wireframe. Upgrade anytime to unlock full access.
Wastewater Collection Executive Overview Dashboard Example
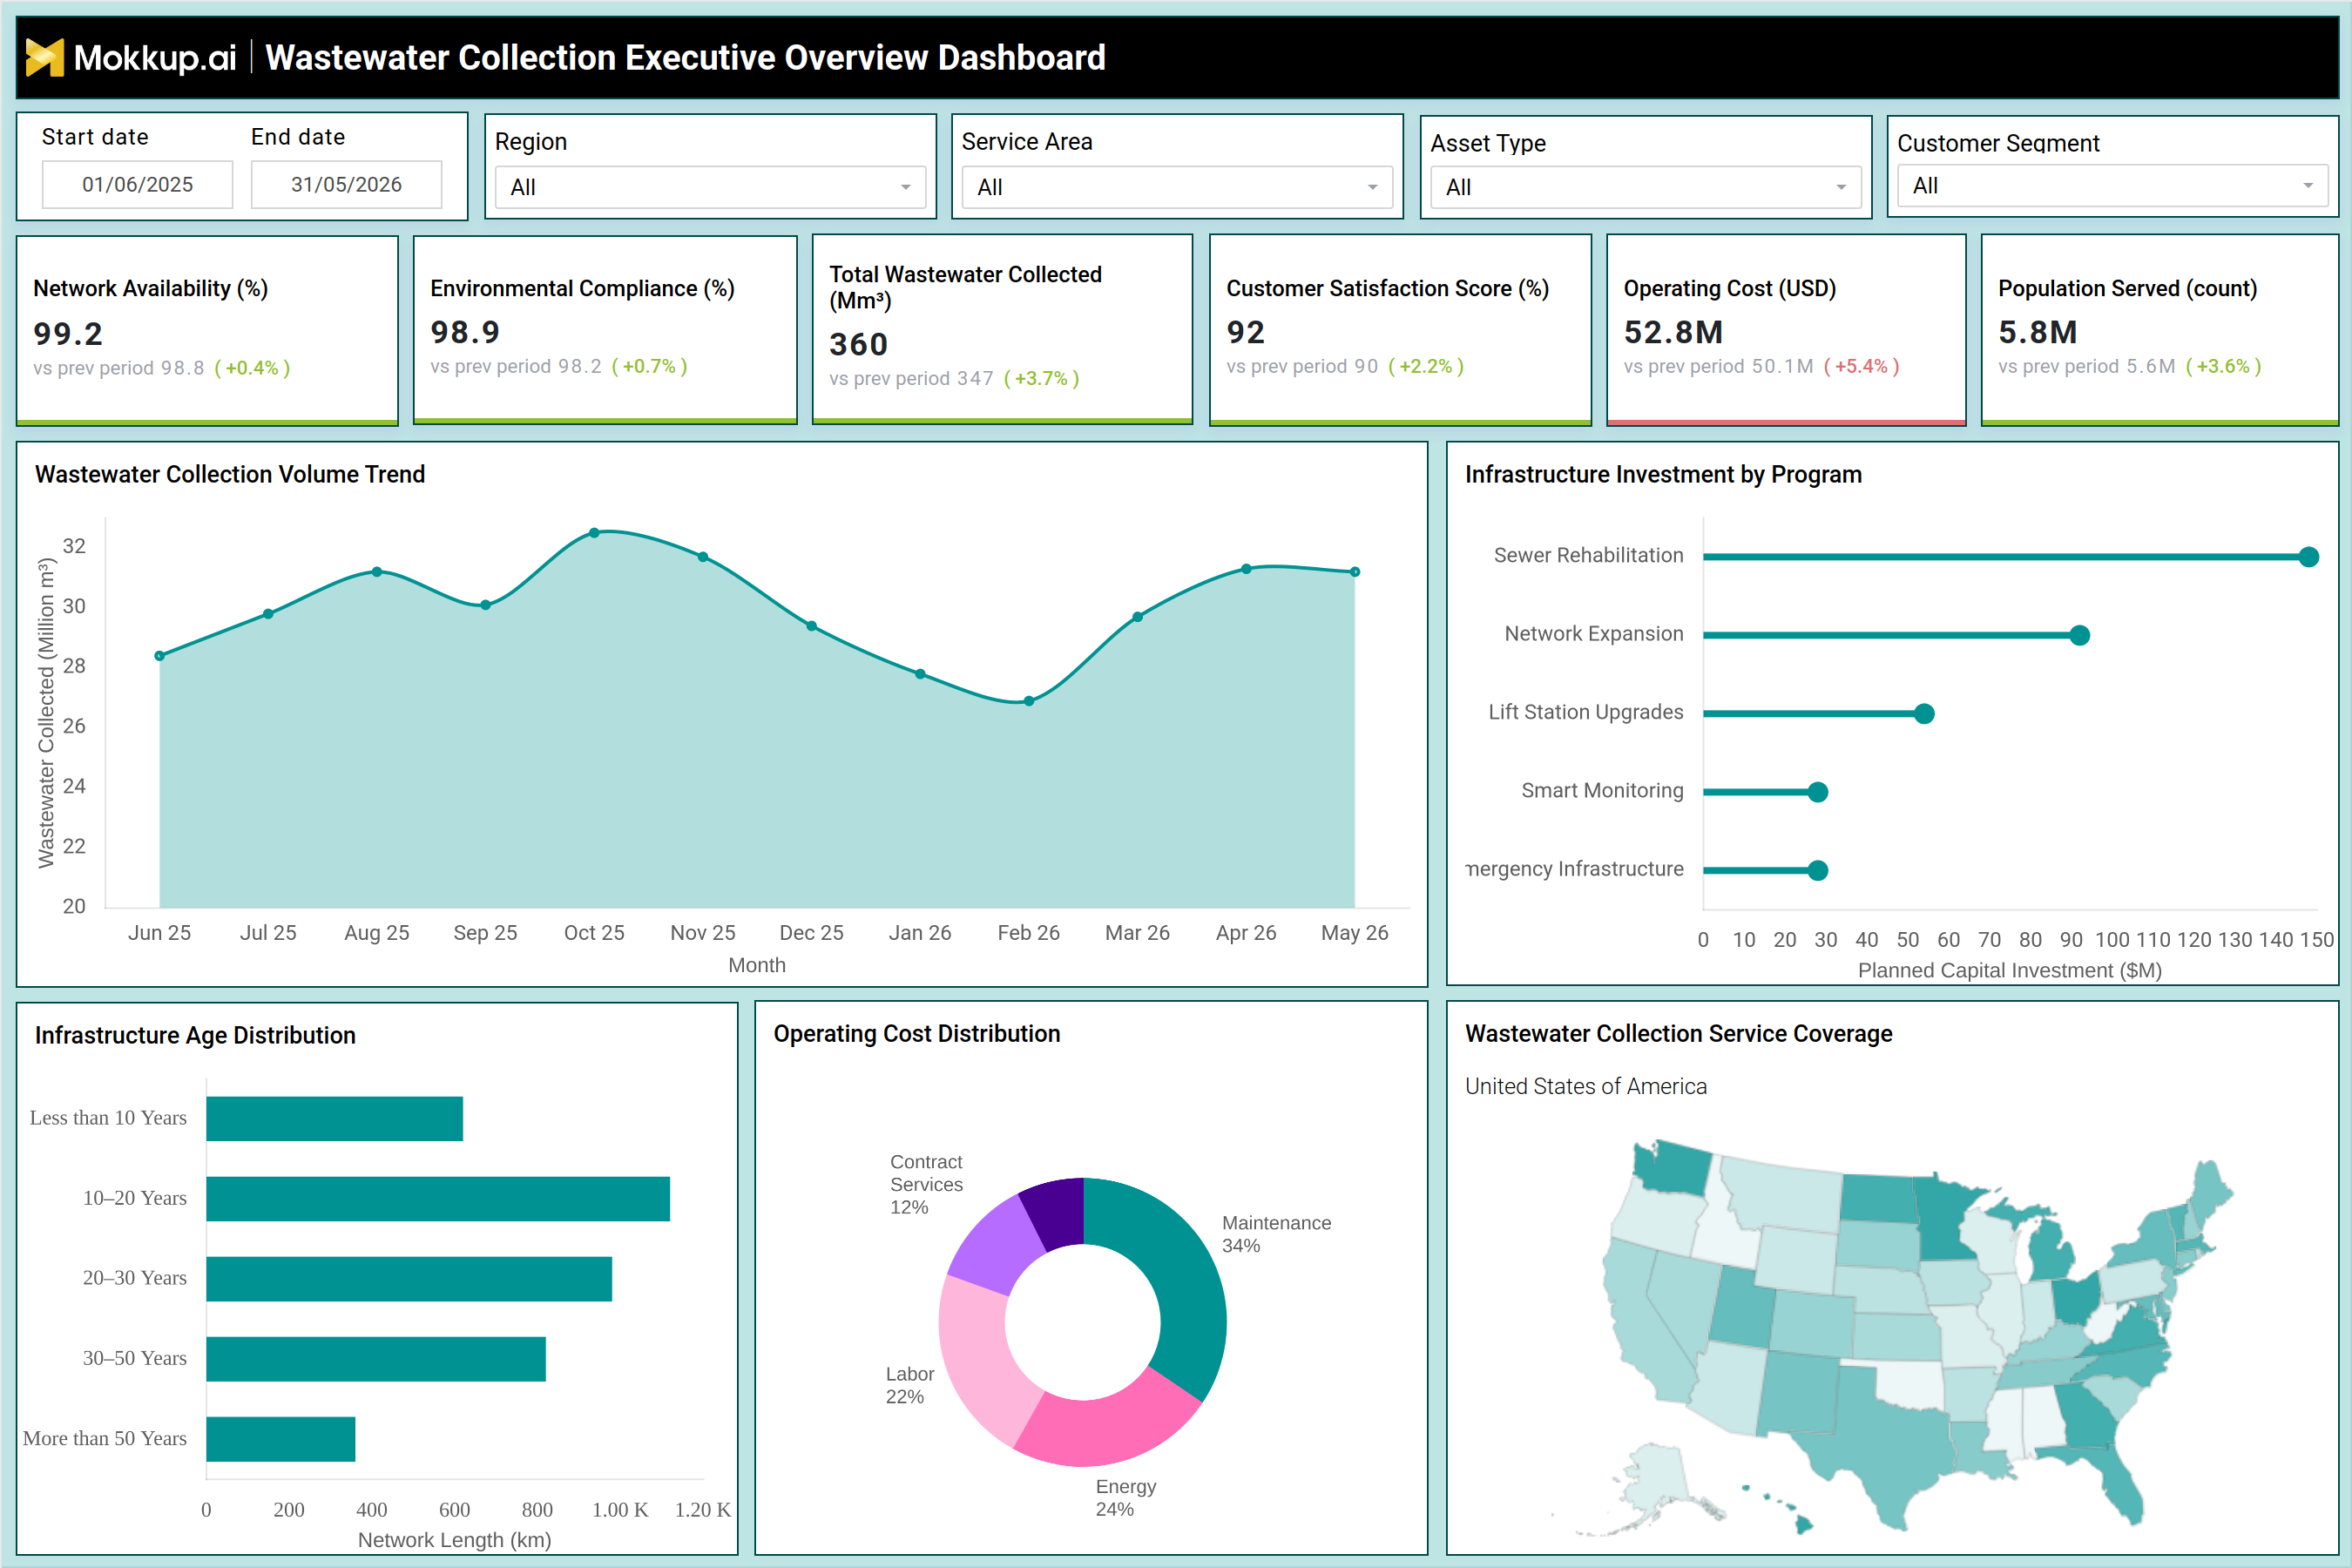
A wastewater utility director opens this dashboard at the start of a weekly leadership review to understand how the collection network is performing before engaging operations and finance teams. The overview screen surfaces whether the network is holding at target availability thresholds, how environmental compliance is trending against regulatory benchmarks, and whether total volume collected aligns with seasonal expectations. Filters for region, service area, and customer segment let teams isolate any area showing unexpected movement, making the wastewater collection executive overview dashboard a practical starting point for routine performance reviews.
From the collection volume trend, planners identify seasonal patterns, flag anomalies signaling infiltration or capacity strain, and compare periods to evaluate efficiency gains. The infrastructure investment view by program wastewater capital allocation view gives planning teams visibility into where funding is directed across sewer rehabilitation, network expansion, lift station upgrades, smart monitoring, and emergency infrastructure, confirming alignment between budget commitments and operational priorities. Asset managers use the infrastructure age distribution to assess what portion of the network is approaching end-of-service thresholds, enabling proactive refurbishment scheduling. The operating cost distribution water utility breakdown lets finance leads compare maintenance, energy, labor, and contracted services spending to pinpoint which category is driving variances. Taken together, this dashboard gives utility leadership a consistent view of system health, supporting infrastructure investment and service delivery decisions across the organization.
How to Analyze Data in a Wastewater Collection Executive Overview Dashboard
Here is how you can analyze data from this dashboard:
- Use date range filters to compare performance across fiscal periods or seasonal cycles
- Filter by Region and Service Area to isolate localized gaps in wastewater network availability monitoring
- Track the collection volume trend over time to detect anomalies signaling infiltration or capacity issues
- Review the infrastructure investment by program wastewater allocation to assess capital distribution against system age and condition
- Use the operating cost distribution water utility breakdown to identify which cost category is driving budget variances across maintenance, energy, labor, and contracts
- Cross-reference Population Served with Total Wastewater Collected to evaluate per-capita collection efficiency
- Monitor the wastewater collection service coverage tracking map to assess geographic reach and identify high-risk service gaps
Benefits of a Wastewater Collection Executive Overview Dashboard
The following are the benefits of using this dashboard:
- Centralized Executive KPI Visibility – Consolidate six critical utility performance indicators into a single executive dashboard, enabling faster, more informed strategic decision-making.
- Improved Compliance Reporting – Surface environmental compliance trends in real time, reducing manual data collection and streamlining regulatory reporting.
- Proactive Capital Planning – Support long-term infrastructure investment decisions by tracking asset age distribution, capital programs, and modernization initiatives.
- Accessible Wastewater Utility KPIs – Bring key wastewater performance metrics into one centralized view, reducing time spent navigating multiple systems and improving operational visibility.
- Enhanced Cost Transparency – Provide clear insights into the distribution of operating costs and water utility spending, helping leadership and finance teams monitor expenses and optimize budgets.
- Improved Service Coverage Monitoring – Track wastewater collection service coverage across geographic zones to identify underserved areas, support equitable service delivery, and guide infrastructure planning.
KPIs to Track in a Wastewater Collection Executive Overview Dashboard
The following key KPIs can be tracked by using this dashboard:
- KPIs (Key Performance Indicators) are measurable values that track how well an organization meets its operational and financial objectives. In wastewater utilities, wastewater KPIs for utility managers provide executives with visibility into network health, compliance, service delivery, and cost sustainability.
- Network Availability (%): Measures the percentage of time the wastewater collection network is operational and functioning within acceptable service thresholds
- Environmental Compliance (%): Tracks how consistently the system adheres to regulatory standards for discharge, overflow control, and environmental protection
- Total Wastewater Collected (Mm3): Quantifies the total volume of wastewater collected across the network within a defined reporting period
- Customer Satisfaction Score (%): Reflects service quality as perceived by connected customers and communities served by the wastewater collection network
- Operating Cost (USD): Tracks the total expenditure required to operate the wastewater collection system, including maintenance, energy, labor, and contracted services
- Population Served (count): Measures the number of residents and businesses actively connected to and served by the wastewater collection network
Frequently Asked Questions
1. Who is this dashboard designed for?
This dashboard is built for wastewater utility executives, operations managers, and public works directors who need a consolidated view of network performance, cost distribution, and compliance status. It is particularly suited for leadership teams that report to governing boards or regulators.
2. Can the dashboard be filtered by specific regions or service areas?
Yes. The dashboard includes filters for Region, Service Area, Asset Type, and Customer Segment, allowing teams to focus on specific parts of the wastewater collection network. This supports wastewater network availability monitoring across different geographic zones or infrastructure segments.
3. What infrastructure data does the dashboard display?
The dashboard shows an infrastructure age distribution chart displaying network length by age bracket and an infrastructure investment by program chart tracking planned capital investment across sewer rehabilitation, network expansion, lift station upgrades, smart monitoring, and emergency infrastructure programs.