
What is a Urology Center Outpatient Performance Dashboard?
A Urology Center Outpatient Performance Dashboard is a unified clinical analytics solution designed to track patient visits, appointment behavior, billing efficiency, diagnosis patterns, and physician productivity within urology outpatient departments. It consolidates key OPD metrics, including total patient visits, appointment no-show rate, patient satisfaction, billing efficiency, and diagnostic trends, providing a comprehensive view of outpatient operational performance.
This outpatient analytics dashboard acts as an outpatient performance monitoring dashboard for urology centers, helping practices understand patient flow, evaluate resource utilization, and identify variations in clinical demand. With insights into procedure volumes, payment collection rate, and physician throughput, administrators can optimize scheduling, improve operational efficiency, and elevate the overall patient experience.
How to Create a Urology Center Outpatient Performance Dashboard
You don’t need to build your report from scratch—just start with a ready-to-use dashboard template from Mokkup. Add in your data and export it however you like. Here’s how to do it:
1. Create or Log in to Your Mokkup Account
Sign up on Mokkup.ai or log in if you already have an account.
2. Choose and Customize Your Dashboard Template
Select the Urology Center Outpatient Performance Dashboard template from the Templates library.Use the drag-and-drop editor to modify KPIs, charts, filters, and visual elements based on your OPD workflow and analytics needs.
3. Export to Your BI Tool
Once finalized, export the dashboard directly to Power BI or Tableau. You can also download it in PDF, PNG, or JPEG, embed it into portals, or collaborate with team members.
Note: This is a Pro template and requires a Mokkup Pro subscription to customize and export.
Urology Center Outpatient Performance Dashboard Example
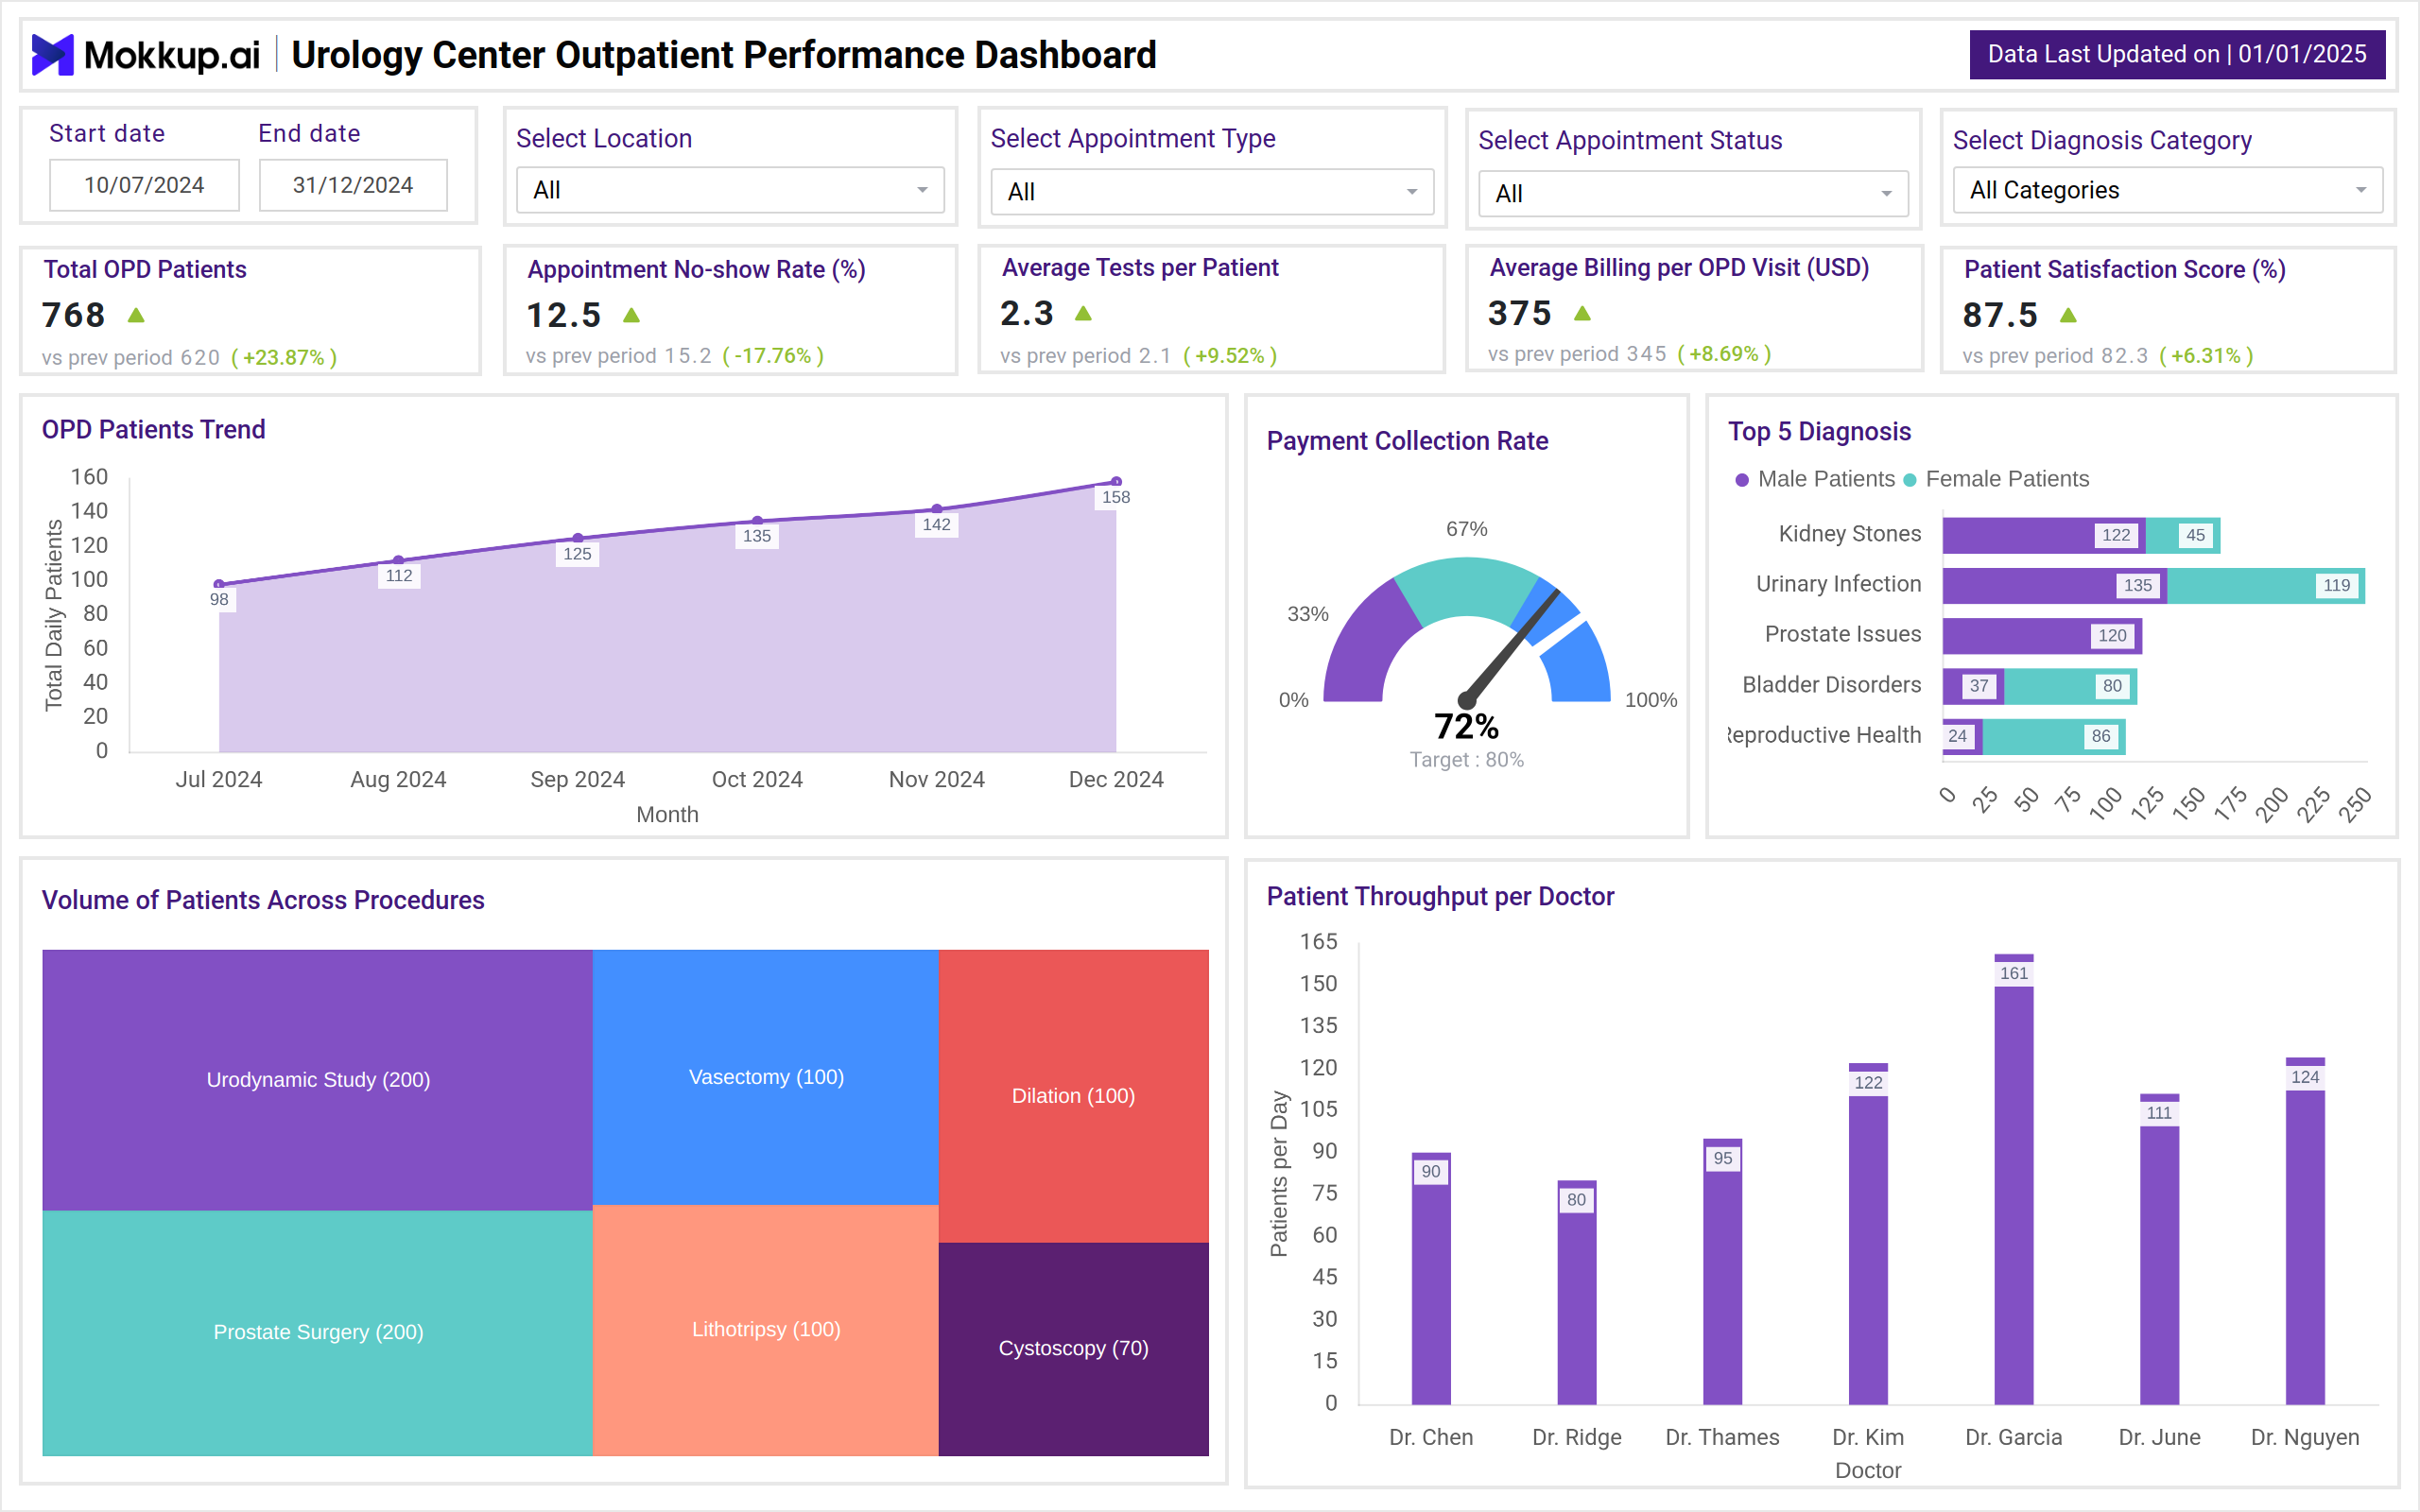
A Urology Center Outpatient Performance Dashboard integrates OPD visit data, appointment behavior, clinical diagnosis trends, procedure volumes, and physician productivity into a single comprehensive view. This example includes KPIs such as total OPD patients, no-show rate, tests per patient, average billing per OPD visit, and patient satisfaction supported with a urology OPD patient visit trend analytics tool for period-over-period comparison..
The OPD patient trend chart highlights monthly growth, while the payment collection gauge tracks billing efficiency. Diagnosis insights classify top conditions like kidney stones, urinary infections, prostate issues, bladder disorders, and reproductive health concerns across genders. This involves leveraging diagnosis pattern analysis for urology outpatient departments to improve care planning.
The dashboard also visualizes procedure volumes, including urodynamic studies, prostate surgeries, lithotripsy, vasectomies, dilations, and cystoscopies, along with doctor-wise patient throughput, providing a comprehensive operational snapshot for outpatient management.
How to Analyze Data in a Urology Center Outpatient Performance Dashboard
Here is how you can analyze data when you use outpatient performance monitoring dashboard for urology centers:
- Track Total OPD Patients: Measure patient footfall and understand service demand trends.
- Monitor Appointment No-Show Rate: Identify scheduling inefficiencies and reduce lost appointment slots.
- Evaluate Average Tests per Patient: Assess diagnostic utilization and clinical workflow consistency.
- Analyze Billing per OPD Visit: Understand financial performance with outpatient billing per visit analytics for urology practices.
- Review Patient Satisfaction Score: Gauge service quality via a patient satisfaction scoring dashboard for urology outpatients.
- Interpret Monthly OPD Trends: Detect variations using a urology OPD patient visit trend analytics tool.
- Assess Payment Collection Rate: Track billing efficiency and use insurance-to-cash payment comparison for OPD urology clinics insights.
- Review Top Diagnoses: Understand common clinical conditions and plan resource allocation.
Benefits of a Urology Center Outpatient Performance Dashboard
- Enhanced OPD Visibility: Provides a consolidated view of all outpatient visits and performance KPIs.
- Improved Appointment Efficiency: Helps reduce no-shows and optimize scheduling.
- Better Financial Performance: Tracks billing per visit and collection effectiveness for revenue optimization.
- Clinical Trend Identification: Highlights diagnosis patterns for informed clinical planning.
- Operational Optimization: Supports staff allocation based on doctor throughput and patient volumes.
- Patient Experience Improvement: Uses satisfaction scores to enhance service quality.
- Data-Driven Decision Making: Helps administrators respond proactively to outpatient performance indicators.
- Balanced Resource Utilization: Aligns tests, procedures, and physician capacity with actual patient demand.
KPIs to Track in a Urology Center Outpatient Performance Dashboard
- Total OPD Patients – Measures total outpatient visits during a specific period.
- Appointment No-Show Rate (%) – Tracks the percentage of scheduled patients who miss appointments.
- Average Tests per Patient – Indicates how many diagnostic tests patients undergo on average.
- Average Billing per OPD Visit (USD) – Evaluates average revenue generated per outpatient consultation.
- Patient Satisfaction Score (%) – Reflects overall patient experience and service quality.
- OPD Patients Trend – Shows how daily or monthly patient volumes fluctuate over time.
- Payment Collection Rate (%) – Measures how effectively billed charges are collected.
- Top Diagnoses Distribution – Highlights the most common medical conditions treated.
- Procedure Volume – Shows how many patients underwent major urology procedures.
- Patient Throughput per Doctor – Compares productivity and workload across physicians.
- Month-over-Month Growth (%) – Analyzes performance acceleration or decline monthly.
Frequently Asked Questions
1. What is the purpose of a Urology Center Outpatient Performance Dashboard?
It is used to monitor outpatient volumes, diagnose trends, financial performance, and physician productivity.
2. How does this dashboard help improve outpatient operations?
By tracking no-shows, procedure volumes, satisfaction, and throughput, the dashboard helps streamline workflows and patient experience.
3. Can the dashboard support multiple OPD locations?
Yes, it can consolidate outpatient data across multiple clinics or centers.
4. Does it help enhance revenue performance?
Absolutely! Billing per visit and collection rate metrics reveal opportunities for financial improvement.
5. Who benefits from using this dashboard?
Clinical administrators, OPD managers, physicians, financial teams, and healthcare executives.