
What is a Teaching University & Colleges Marketing & Outreach Performance Dashboard?
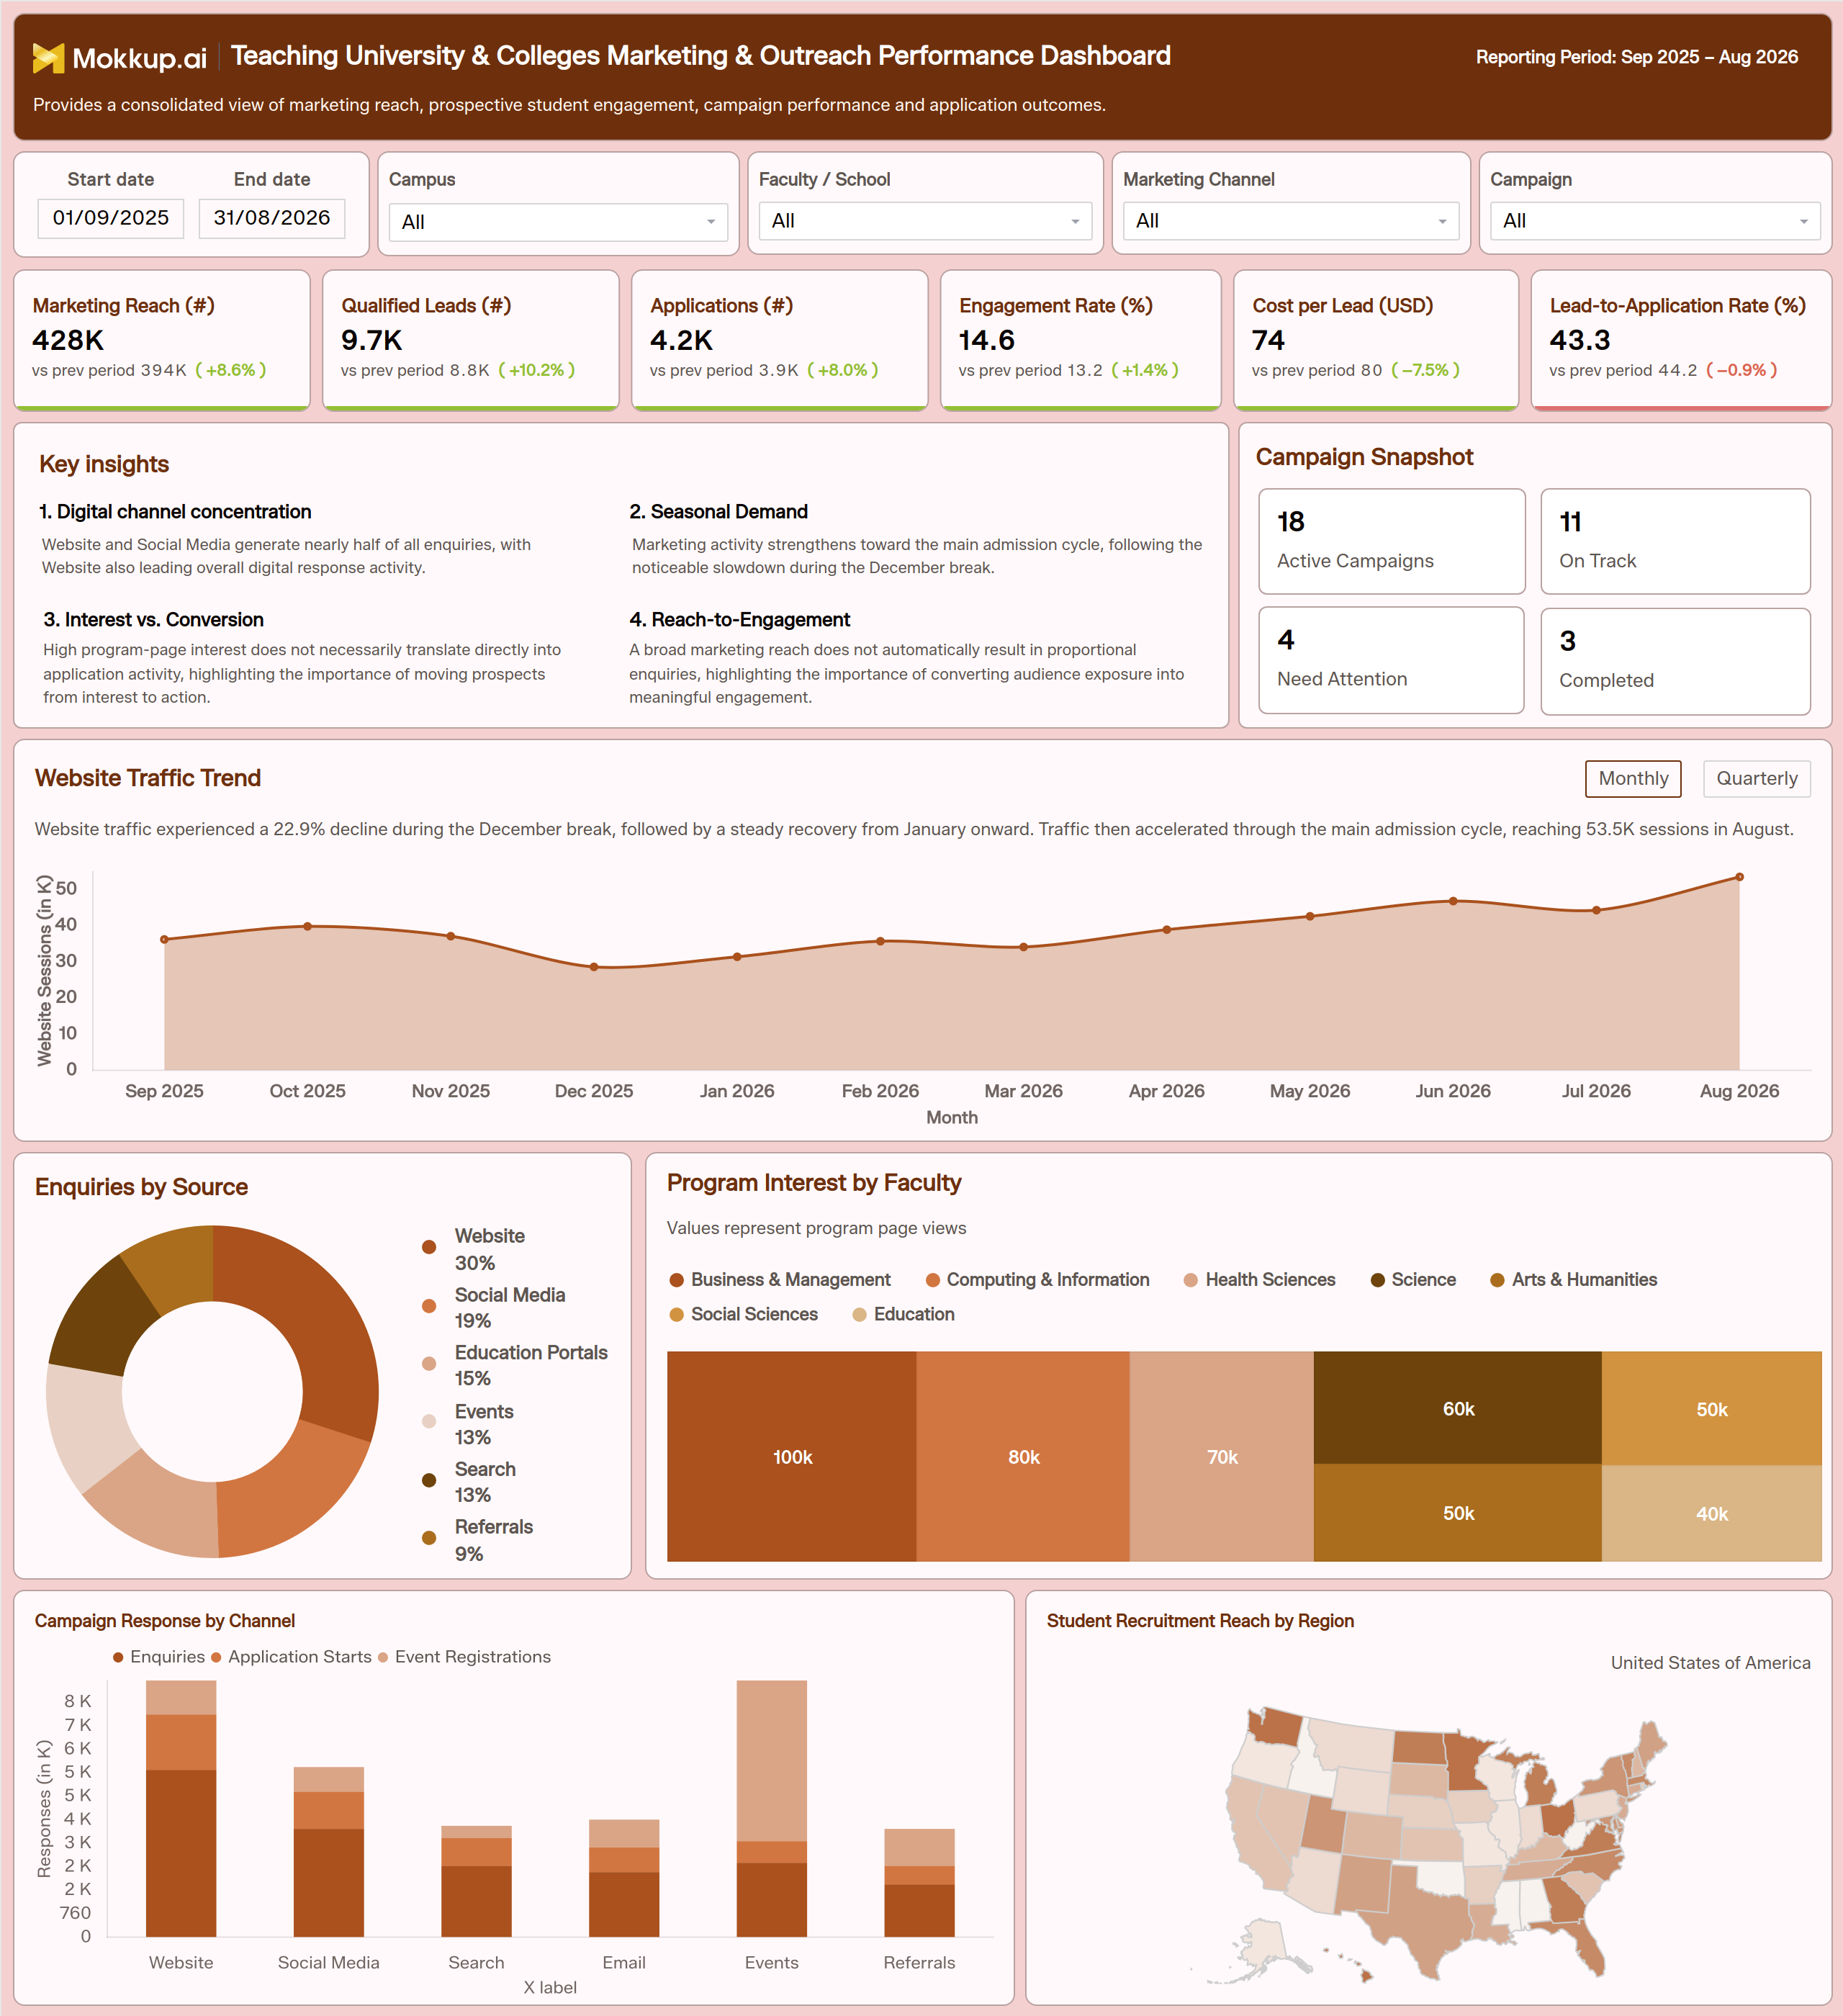
The Teaching University & Colleges Marketing & Outreach Performance Dashboard gives higher education marketing and admissions teams a single view of how prospective student outreach is performing across the enrollment cycle. Built for university marketing directors, enrollment managers, and admissions leadership, it brings together data from every channel a university uses to reach and convert prospective students, from paid and organic digital campaigns to on-campus events and referral partnerships. Instead of pulling numbers from separate ad platforms, event registration tools, and application systems, teams get university marketing performance tracking in one connected view spanning the full reporting period. Each KPI card compares the current value with the previous period. A Key Insights panel and a Campaign Snapshot sum up the main patterns and how many campaigns are on track or need attention.
The dashboard supports student enrollment funnel analytics by tracing how audience reach moves through engagement, inquiry, and application stages, making it easier to see where prospective students stall before submitting an application. It also enables higher education lead generation tracking by showing which channels and campaigns produce qualified leads at the lowest cost. Filters for date range, campus, faculty or school, marketing channel, and campaign let teams narrow the view at any time. For universities managing multiple faculties, campuses, and marketing channels at once, this dashboard template replaces static reporting decks with a structured, filterable view that keeps outreach performance and application outcomes tied to the same source of truth.
How to Create a Teaching University & Colleges Marketing & Outreach Performance Dashboard
You don't need to start from scratch. Just begin with a ready-to-use dashboard template from Mokkup. Here's how:
1. Create or Log in to Your Mokkup Account
Start by signing up on Mokkup.ai using your email. If you already have an account, just log in, and you'll be good to go.
2. Choose and Customize Your Dashboard Template
Find the Teaching University & Colleges Marketing & Outreach Performance Dashboard template in the Templates section. Use the drag-and-drop editor to adjust KPIs, edit filters, or add elements based on your data.
3. Export to Your BI Tool
Once your dashboard wireframe is ready, use the BI Tool Export feature to send it directly to Power BI or Tableau for further analysis and enhancements. You can also download the dashboard as a PDF, PNG, or JPEG, embed it on a platform, or invite your team to collaborate.
Note: This is a Pro template. You'll need a Pro subscription on Mokkup to use and customize this dashboard wireframe. Upgrade anytime to unlock full access.
Teaching University & Colleges Marketing & Outreach Performance Dashboard Example
A university marketing team typically opens this dashboard at the start of a review cycle to understand how outreach is turning into interest ahead of an admissions deadline. Marketing directors and enrollment managers use it to answer a recurring question: is the audience being reached actually engaging, inquiring, and eventually applying, or is reach growing while conversion stays flat? The KPI cards answer this at a glance, for example, by showing reach and leads rising while the lead-to-application rate dips. The Campaign Snapshot shows how many campaigns need attention. Filtering by campus, faculty, marketing channel, or campaign narrows the view from a university-wide picture to a specific program launch or regional push.
From there, marketing leads use Enquiries by Source to see how enquiries split across websites, social media, education portals, events, search, and referrals. They compare this with Campaign Response by Channel to see which channels drive application starts and event registrations rather than just inquiries. Enrollment teams use Program Interest by Faculty to find the faculties with the strongest program page interest and flag where that interest is not turning into applications, prompting a follow-up nurture sequence. Campaign managers run campaign response rate analysis for universities to decide where to shift budget mid-cycle. Regional recruiters compare student recruitment reach by region to prioritize underperforming states. The Website Traffic Trend, viewed monthly or quarterly, shows seasonal dips such as the December break early enough to plan a recovery campaign.
Ultimately, this dashboard supports university outreach campaign monitoring by keeping marketing spend, engagement, and application outcomes visible in one place. Leadership can then prioritize the channels and faculties producing qualified applicants instead of the ones simply generating the most impressions.
How to Analyze Data in a Teaching University & Colleges Marketing & Outreach Performance Dashboard
Here is how you can analyze data from this dashboard:
- Apply Filters First: Set the date range and filter by Campus, Faculty/School, Marketing Channel or Campaign to narrow the view to a specific outreach effort.
- Start with Key Insights and Campaign Snapshot: Read the Key Insights panel for the main patterns, and check the Campaign Snapshot to see how many campaigns are on track, completed or need attention.
- Compare KPIs with the Previous Period: Check the “vs prev period” value and % change on each KPI card. For Cost per Lead, a decrease is a positive sign.
- Check Reach vs Leads: Compare Marketing Reach with Qualified Leads to see how much of the audience turns into real interest.
- Track Website Traffic: Use the Website Traffic Trend, and switch between Monthly and Quarterly, to spot seasonal dips as part of university marketing performance tracking.
- Review Enquiry Sources: Use Enquiries by Source to find which channels contribute the largest share of inbound interest.
- Find Faculty Interest: Use Program Interest by Faculty to see where prospective students spend their attention before applying.
- Break Down Campaign Response: Use Campaign Response by Channel to separate enquiries, application starts and event registrations for higher education lead generation tracking.
- Compare Regional Reach: Check Student Recruitment Reach by Region to find states with lower recruitment penetration.
- Judge Spend Efficiency: Monitor Lead-to-Application Rate alongside Cost per Lead to see whether spend is producing efficient conversions.
Benefits of a Teaching University & Colleges Marketing & Outreach Performance Dashboard
The following are the benefits of using this dashboard:
- Centralized Marketing View: Brings marketing, engagement, and application data together in a single admissions-ready view.
- Clear Performance Direction: Previous-period comparisons on every KPI show at a glance whether outreach is improving.
- Campaign Health at a Glance: The Campaign Snapshot shows how many campaigns are on track or need attention.
- Less Manual Reporting: Replaces spreadsheets pulled from separate ad and event platforms.
- Better Budget Decisions: Ties Cost per Lead and Lead-to-Application Rate to specific channels and campaigns.
- Stronger Response Analysis: Supports campaign response rate analysis for universities by placing enquiries, application starts, and event registrations side by side.
- Focused Recruitment: Helps faculties prioritize recruitment efforts using program interest and regional reach data together.
- Faster Seasonal Response: Supports quicker reactions to seasonal shifts in outreach volume before enrollment targets are affected.
- Consistent Leadership View: Gives leadership a consistent view for university marketing performance tracking across campuses and terms.
KPIs to Track in a Teaching University & Colleges Marketing & Outreach Performance Dashboard
The following key KPIs can be tracked using this dashboard:
- Marketing Reach (#): total prospective students exposed to university marketing activity across all channels.
- Qualified Leads (#): prospective students meeting defined qualification criteria and ready for admissions follow-up.
- Applications (#): completed student applications submitted during the reporting period.
- Engagement Rate (%): share of reached prospects actively engaging with campaign content, a core input for student enrollment funnel analytics.
- Cost per Lead (USD): average marketing spend needed to generate one qualified lead. A decrease compared with the previous period is a positive sign.
- Lead-to-Application Rate (%): percentage of qualified leads that convert into a completed application.
Frequently Asked Questions
1. What does the Teaching University & Colleges Marketing & Outreach Performance Dashboard track?
It tracks marketing reach, qualified leads, applications, engagement rate, cost per lead, and lead-to-application rate across campuses, faculties, and marketing channels. It also breaks down enquiries by source and campaign response by channel so teams see which efforts are converting.
2. Who should use this dashboard?
University marketing directors, enrollment managers, admissions leadership, and campaign managers use it to review outreach performance. Faculty teams and regional recruiters also use it to prioritize where to focus program promotion.
3. Can this template be customized for my university's data?
Yes. The dashboard wireframe can be customized in the Mokkup editor before exporting to Power BI, Tableau, or as a PDF, PNG, or JPEG. This is a Pro template, so a Pro subscription is required to unlock full customization.