
What Is a Student AI Adoption & Usage Intelligence Dashboard?
Universities and colleges are rapidly integrating AI tools into learning environments, but tracking their adoption and impact remains a challenge. A Student AI Adoption & Usage Intelligence Dashboard is an analytics platform that monitors how students engage with AI-powered learning tools. It provides insights into AI tool usage patterns, engagement levels, and academic performance correlations. This learning cost efficiency dashboard aggregates data from AI learning platforms, student interactions, and academic outcomes to help educators and administrators assess AI adoption trends. By analyzing metrics like total active AI users, prompt volume, daily active time, and learning cost efficiency, institutions can optimize AI integration, improve student outcomes, and allocate resources effectively.
How to Create a Student AI Adoption & Usage Intelligence Dashboard
You don't need to build your report from scratch, just start with a ready-to-use dashboard template from Mokkup. Add in your data and export it however you like. Here's how to do it:
1. Create or Log in to Your Mokkup Account
Start by signing up on Mokkup.ai using your email. If you already have an account, just log in, and you'll be good to go.
2. Choose and Customize Your Dashboard Template
Find the Student AI Adoption & Usage Intelligence Dashboard template in the Templates section. Use the drag-and-drop editor to adjust KPIs, edit filters, or add elements based on your data.
3. Export to Your BI Tool
Once your dashboard wireframe is ready, use the BI Tool Export feature to send it directly to Power BI or Tableau for further analysis and enhancements. You can also download the dashboard as a PDF, PNG, or JPEG, embed it on a platform, or invite your team to collaborate.
Note: This is a Pro template. You'll need a Pro subscription on Mokkup to use and customize this dashboard wireframe. Upgrade anytime to unlock full access.
Student AI Adoption & Usage Intelligence Dashboard Example
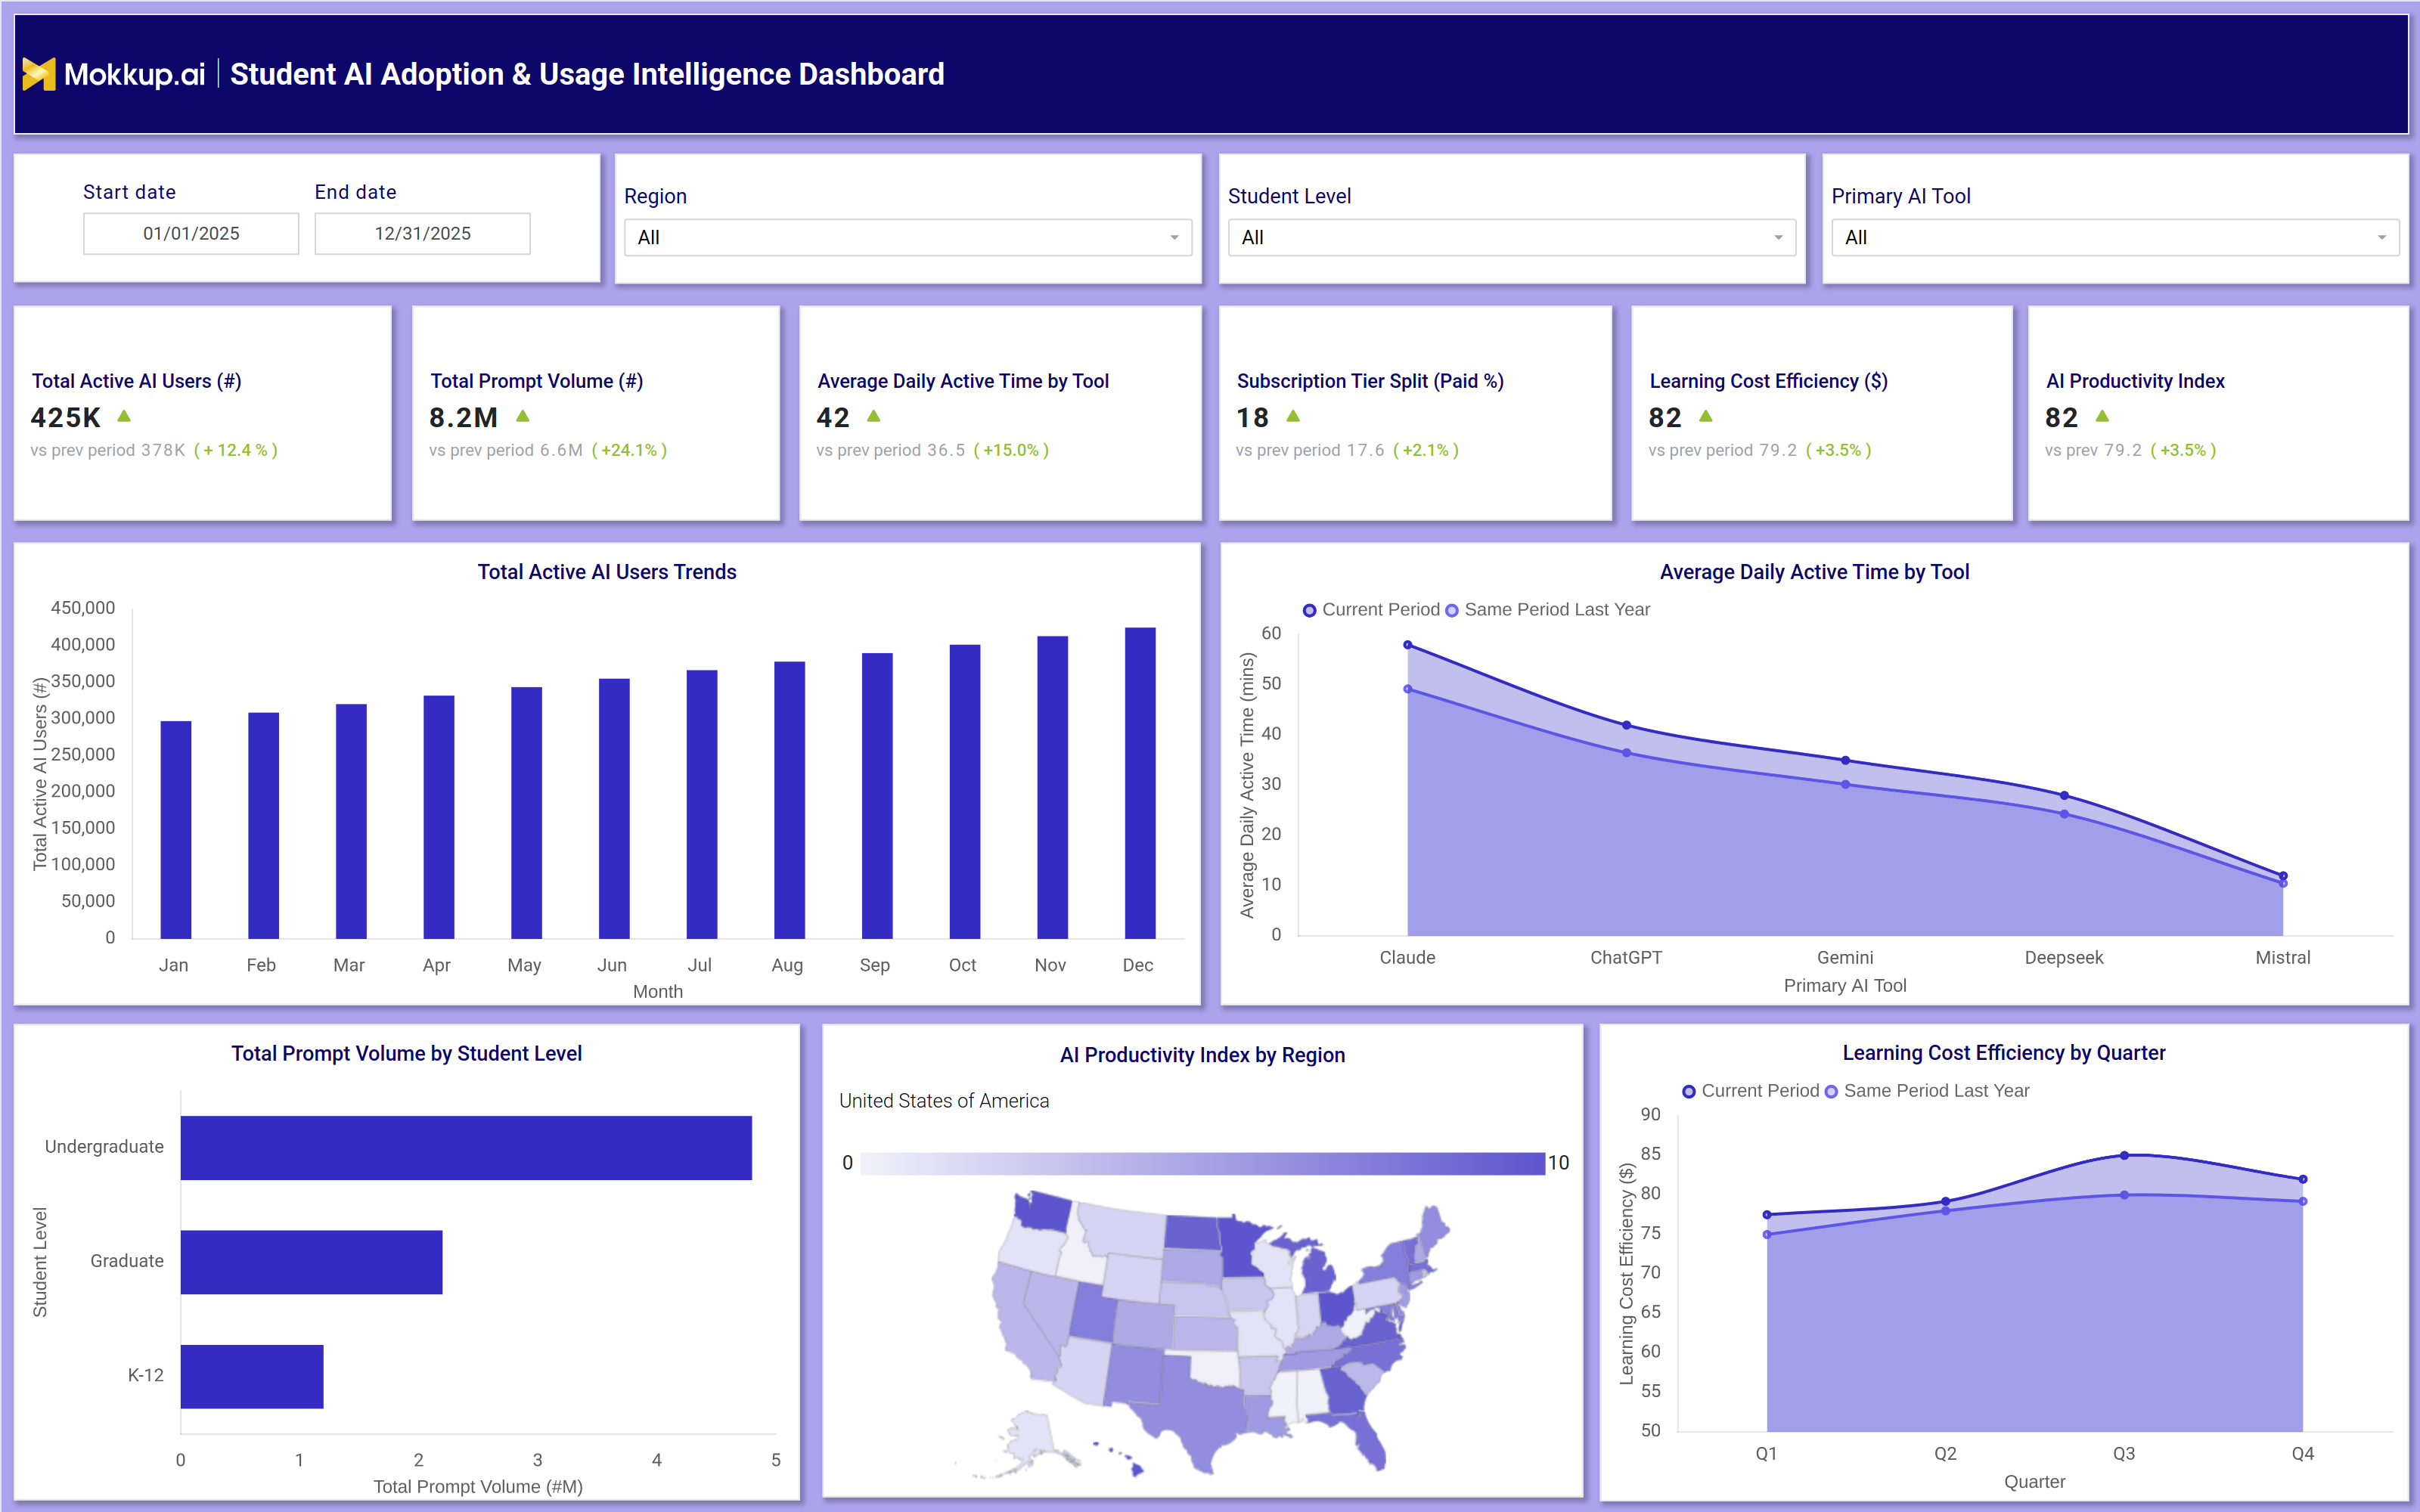
A typical Student AI Adoption & Usage Intelligence Dashboard includes interactive filters for date range, student level (undergraduate, graduate, K12), region, and primary AI tool (ChatGPT, Claude, Gemini, etc.). Key performance tiles display metrics such as total active AI users, total prompt volume, average daily active time, subscription tier split, learning cost efficiency, and AI productivity index. Trend charts compare current AI usage against previous periods, while bar graphs break down prompt volume by student level. A geographic heatmap shows AI productivity by region, and line charts track learning cost efficiency over time. These components help institutions identify high-engagement AI tools, detect usage gaps, and refine AI-assisted learning strategies.
How to Analyze Data in a Student AI Adoption & Usage Intelligence Dashboard
Here is how you can analyze data from this AI productivity index dashboard:
- Track Total Active AI Users: Measure AI tool adoption rates across different student segments to understand overall engagement and usage growth.
- Monitor Prompt Volume Trends: Analyze prompt activity trends to assess how actively students are interacting with AI-powered learning tools.
- Compare Average Daily Active Time: Evaluate daily usage duration to identify which AI platforms are most effective at retaining student engagement.
- Review Subscription Tier Splits: Compare free and paid AI tool usage to determine which subscription models contribute to better learning outcomes.
- Evaluate Learning Cost Efficiency: Measure AI spending per student to optimize budgets and maximize educational value from AI investments.
- Analyze AI Productivity by Region: Identify geographic differences in AI adoption and productivity to address regional gaps in learning access or effectiveness.
- Assess Student-Level Usage: Compare AI usage patterns between undergraduate and graduate students to tailor learning strategies and support programs.
- Compare Current vs. Historical Data: Benchmark current AI-assisted learning metrics against historical trends to track progress, engagement improvements, and adoption growth.
Benefits of a Student AI Adoption & Usage Intelligence Dashboard
The following are the benefits of using this dashboard:
- Enhances AI Learning Engagement: Identifies high-performing AI tools and platforms that drive stronger student participation and engagement.
- Improves Academic Outcomes: Supports data-driven AI adoption strategies that help improve learning effectiveness and academic performance.
- Optimizes AI Spending: Tracks learning cost efficiency to ensure AI investments deliver maximum educational value within budget.
- Supports Personalized Learning: Analyzes student-level AI usage patterns to enable tailored learning experiences and targeted support strategies.
- Detects Adoption Gaps: Identifies disparities in AI adoption across regions, departments, and student groups to improve accessibility and inclusion.
- Informs AI Tool Selection: Uses real usage data and engagement insights to guide the selection of the most effective AI learning tools.
- Boosts Institutional Efficiency: Streamlines monitoring and reporting processes with automated AI usage tracking and performance analytics.
KPIs to Track in a Student AI Adoption & Usage Intelligence Dashboard
The following key KPIs can be tracked by using this dashboard:
- Total Active AI Users (#): Measures the number of students actively using AI tools.
- Total Prompt Volume (#): Tracks the total number of AI interactions (prompts) submitted.
- Average Daily Active Time by Tool (mins): Indicates how long students engage with AI platforms.
- Subscription Tier Split (Paid %): Shows the percentage of students using paid vs. free AI tools.
- Learning Cost Efficiency ($): Evaluates the cost effectiveness of AI-assisted learning.
- AI Productivity Index: A composite score measuring AI's impact on student performance.
Frequently Asked Questions
1. Who should use a student AI adoption dashboard?
University administrators, EdTech leaders, faculty, and policymakers in higher education.
2. What data sources feed into the AI usage intelligence dashboard?
AI learning platforms, student interaction logs, and academic performance databases.
3. How does a higher education AI analytics dashboard help learning?
It provides insights into AI tool engagement, helping institutions refine AI learning strategies and improve student outcomes.