
What is a Stormwater Management Utility Finance Fee & Revenue Dashboard?
A stormwater management utility finance fee & revenue dashboard is a centralized analytics tool designed to track, monitor, and optimize financial performance for municipal stormwater programs. It consolidates billing data, revenue collection, delinquency rates, and cost metrics into a single interface, enabling utility managers to assess financial health, improve fee collection efficiency, and ensure regulatory compliance.
This dashboard provides visibility into stormwater utility fees billed, revenue collected, collection rates, and outstanding balances. By integrating geographic, customer segment, and fee type filters, it helps utilities identify trends, detect inefficiencies, and make data-driven decisions for budgeting, rate adjustments, and enforcement strategies. Municipalities use this tool to enhance transparency, reduce delinquencies, and optimize stormwater program funding.
How to Create a Stormwater Management Utility Finance Fee & Revenue Dashboard
You don’t need to build your report from scratch, just start with a ready-to-use Stormwater Management Utility Finance Fee & Revenue dashboard template from Mokkup. Add in your data and export it however you like. Here’s how to do it:
1. Create or Log in to Your Mokkup Account
Start by signing up on Mokkup.ai using your email. If you already have an account, just log in, and you’ll be good to go.
2. Choose and Customize Your Dashboard Template
Find the Stormwater Management Utility Finance Fee & Revenue Dashboard template in the Templates section. Use the drag and drop editor to adjust KPIs, edit filters, or add elements based on your data.
3. Export to Your BI Tool
Once your dashboard wireframe is ready, use the BI Tool Export feature to send it directly to Power BI or Tableau for further analysis and enhancements. You can also download the dashboard as a PDF, PNG, or JPEG, embed it on a platform, or invite your team to collaborate.
Note: This is a Pro template. You’ll need a Pro subscription on Mokkup to use and customize this dashboard wireframe. Upgrade anytime to unlock full access.
Stormwater Management Utility Finance Fee & Revenue Dashboard Example
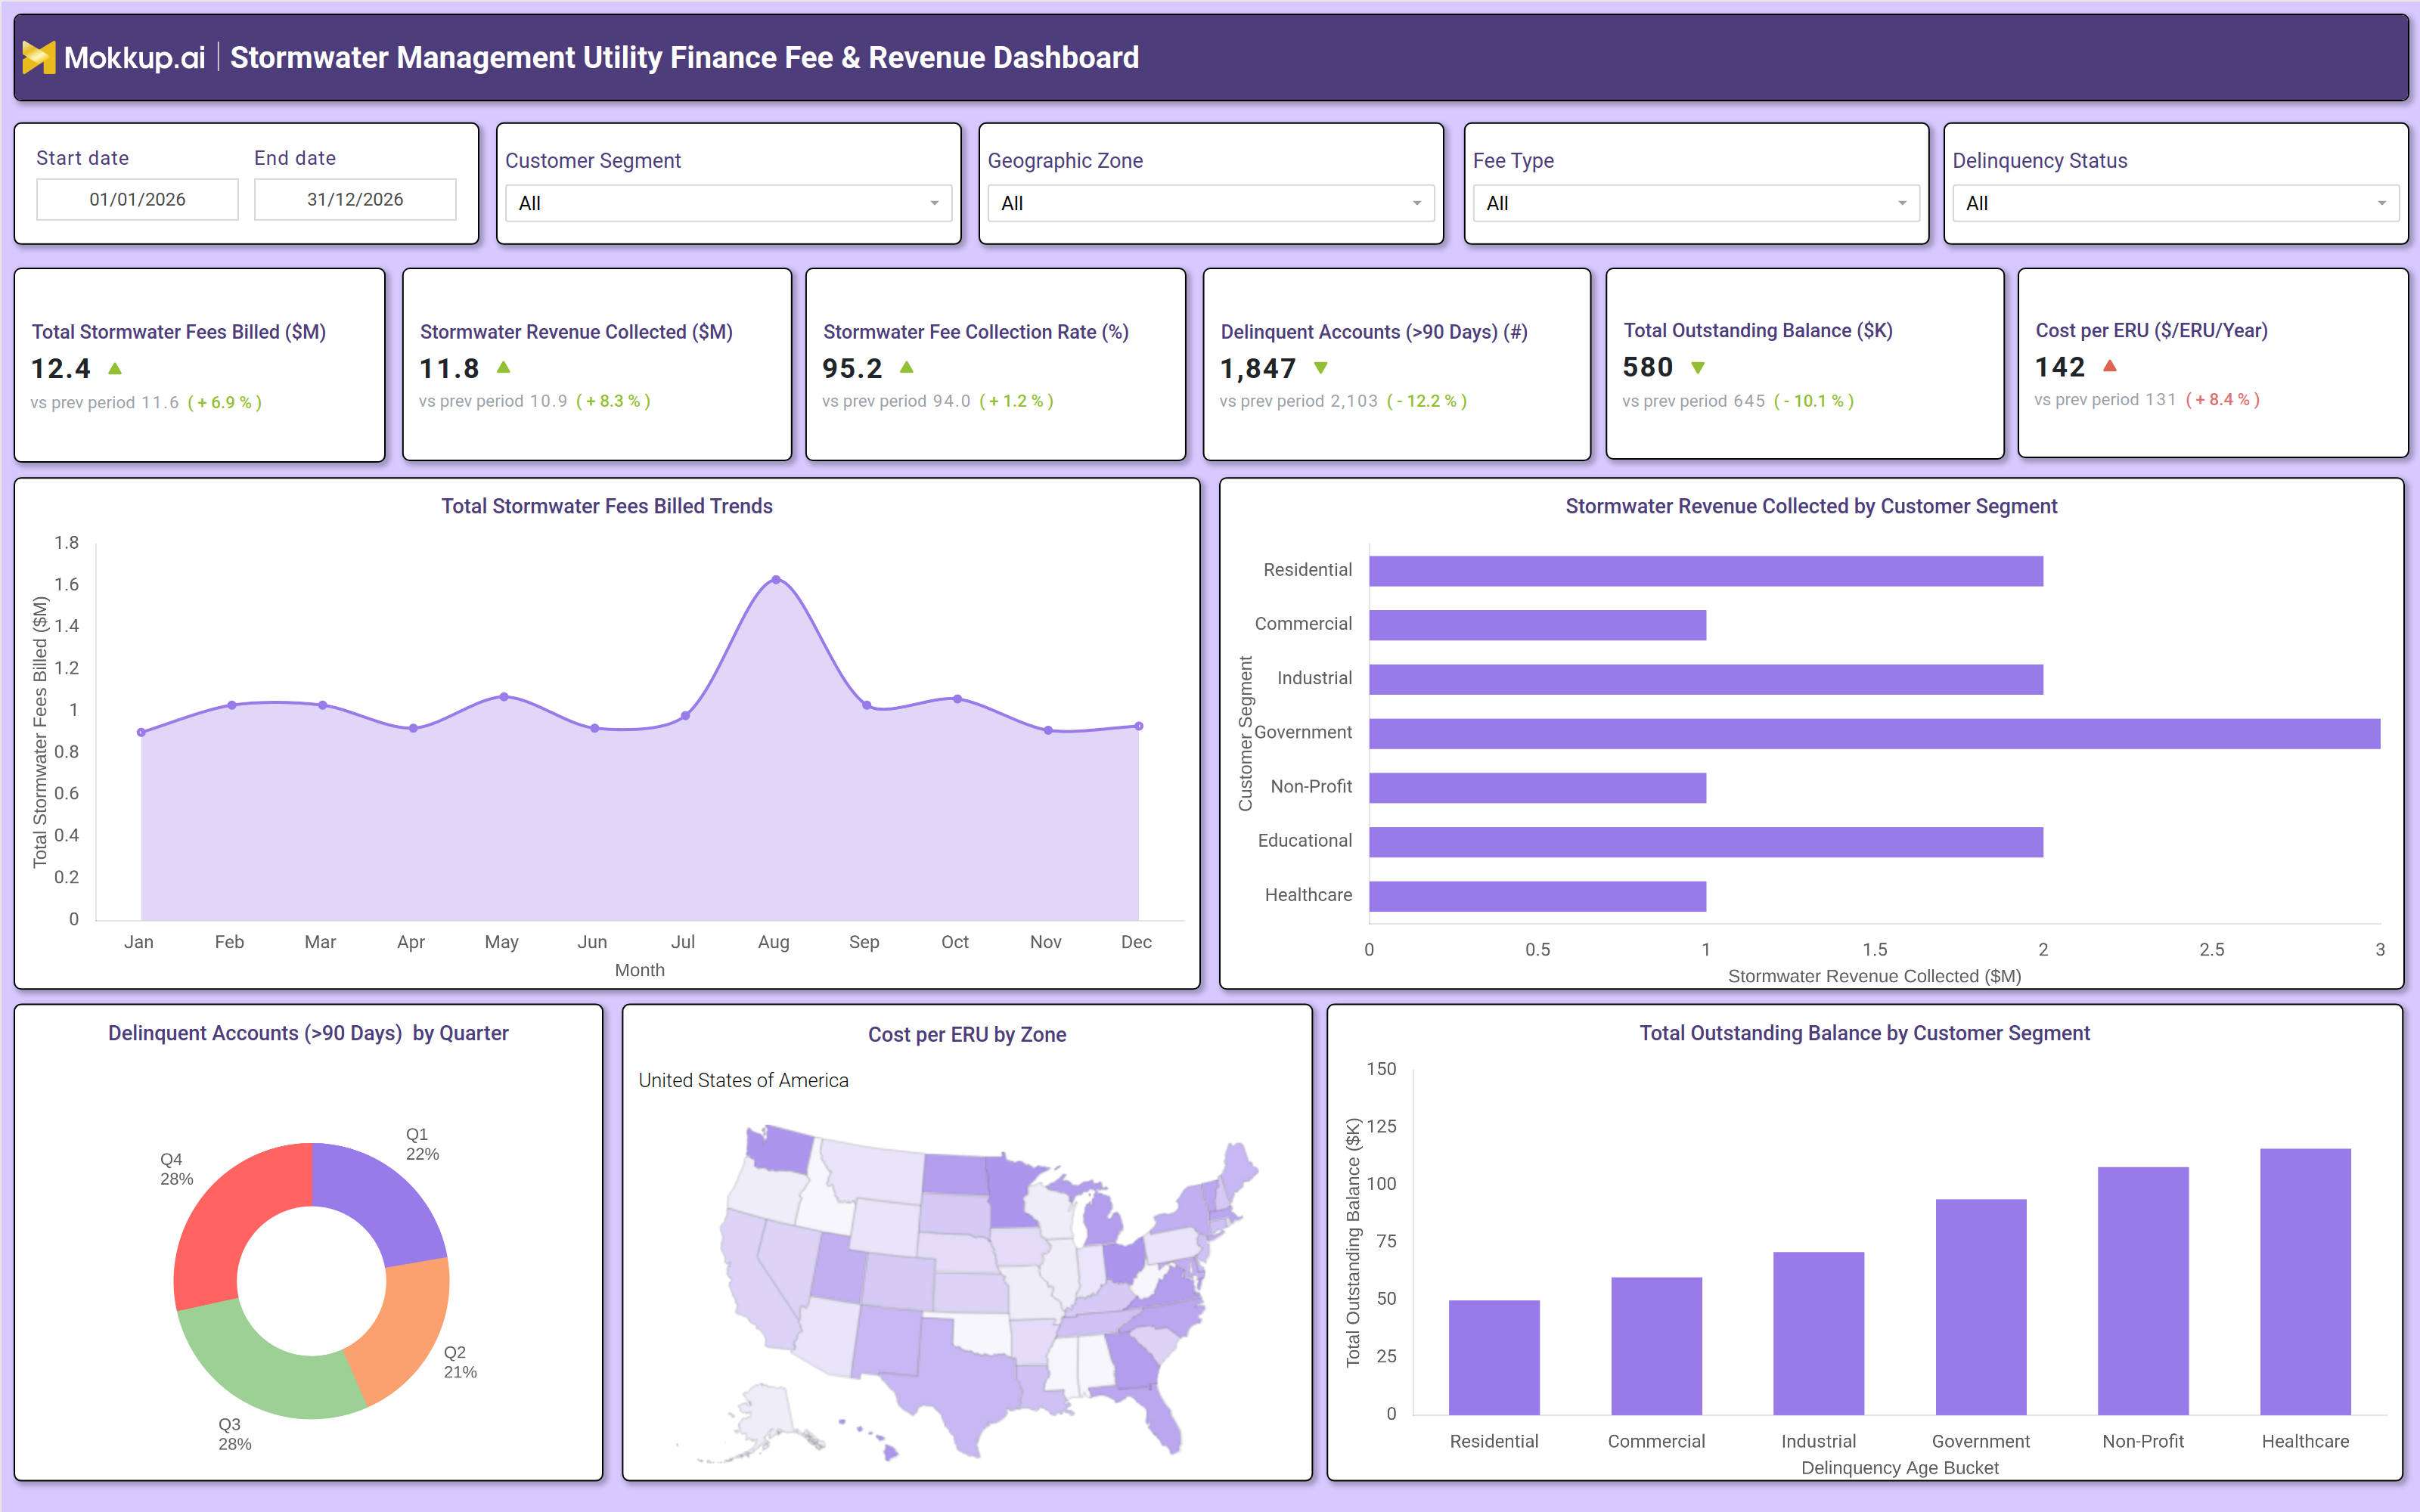
A well structured stormwater utility fee tracking and reporting dashboard includes interactive filters for date ranges, customer segments (residential, commercial, industrial, government), geographic zones, fee types, and delinquency status. Key performance tiles display total stormwater fees billed, revenue collected, collection rates, delinquent accounts, outstanding balances, and cost per Equivalent Residential Unit (ERU). Trend charts show monthly billing and revenue patterns, helping utilities compare performance against previous periods.
A customer segment breakdown highlights revenue distribution, while a geographic heatmap visualizes cost per ERU by zone. Delinquency analysis by quarter identifies collection challenges, and outstanding balance charts reveal high-risk customer groups. Together, these components form a municipal stormwater finance management dashboard that supports financial planning, compliance reporting, and revenue optimization.
How to Analyze Data in a Stormwater Management Utility Finance Fee & Revenue Dashboard
Here is how you can analyze data from this water dashboard:
- Track Fees Billed: Monitor total stormwater fees to assess revenue trends and seasonality.
- Measure Collections: Compare revenue collected to evaluate cash flow and efficiency.
- Review Collection Rates: Identify changes in payment compliance over time.
- Analyze Delinquencies: Focus on accounts over 90 days to prioritize enforcement.
- Monitor Outstanding Balance: Track trends to assess effectiveness of collection efforts.
- Evaluate Cost per ERU: Identify high-cost zones to optimize resource allocation.
- Segment Revenue: Break down by customer type to refine billing and outreach strategies.
- Use Geographic Insights: Leverage heatmaps to assess fee distribution and collection performance.
Benefits of a Stormwater Management Utility Finance Fee & Revenue Dashboard
The following are the benefits of using this municipal stormwater financial dashboard:
- Improved Financial Visibility: Consolidates billing, revenue, and delinquency data.
- Better Collection Efficiency: Tracks compliance and outstanding balances.
- Regulatory Readiness: Provides accurate, auditable financial records.
- Smarter Budgeting: Supports rate setting using historical and cost-per-ERU insights.
- Reduced Delinquencies: Enables targeted enforcement and customer segmentation.
- Data-Driven Decisions: Improves financial planning with actionable insights.
- Operational Efficiency: Automates reporting and reduces manual effort.
KPIs to Track in a Stormwater Management Utility Finance Fee & Revenue Dashboard
The following key KPIs can be tracked by using this stormwater billing analytics dashboard:
- Total Stormwater Fees Billed ($M): Measures the total revenue generated from stormwater utility fees.
- Stormwater Revenue Collected ($M): Tracks the actual revenue received from billed fees.
- Stormwater Fee Collection Rate (%): Indicates the percentage of billed fees successfully collected.
- Delinquent Accounts (>90 Days) (#): Counts the number of overdue accounts to prioritize collection efforts.
- Total Outstanding Balance ($K): Represents the total unpaid stormwater fees across all accounts.
- Cost per ERU ($/ERU/Year): Calculates the annual cost of stormwater management per Equivalent Residential Unit.
Frequently Asked Questions
Q1. What is a stormwater utility fee tracking and reporting dashboard used for?
It helps utilities monitor billing, revenue collection, delinquencies, and financial performance to improve fee compliance and budgeting.
Q2. Who should use a stormwater fee transparency and financial dashboard?
Municipal finance teams, utility managers, compliance officers, and city planners responsible for stormwater program funding.
Q3. Can this utility revenue monitoring dashboard help with stormwater utility budgeting and revenue optimization?
Yes, it provides trend analysis, cost per ERU insights, and revenue forecasting to support budget planning and rate adjustments.