
What is a Stormwater Management SCADA & Sensor Operations Dashboard?
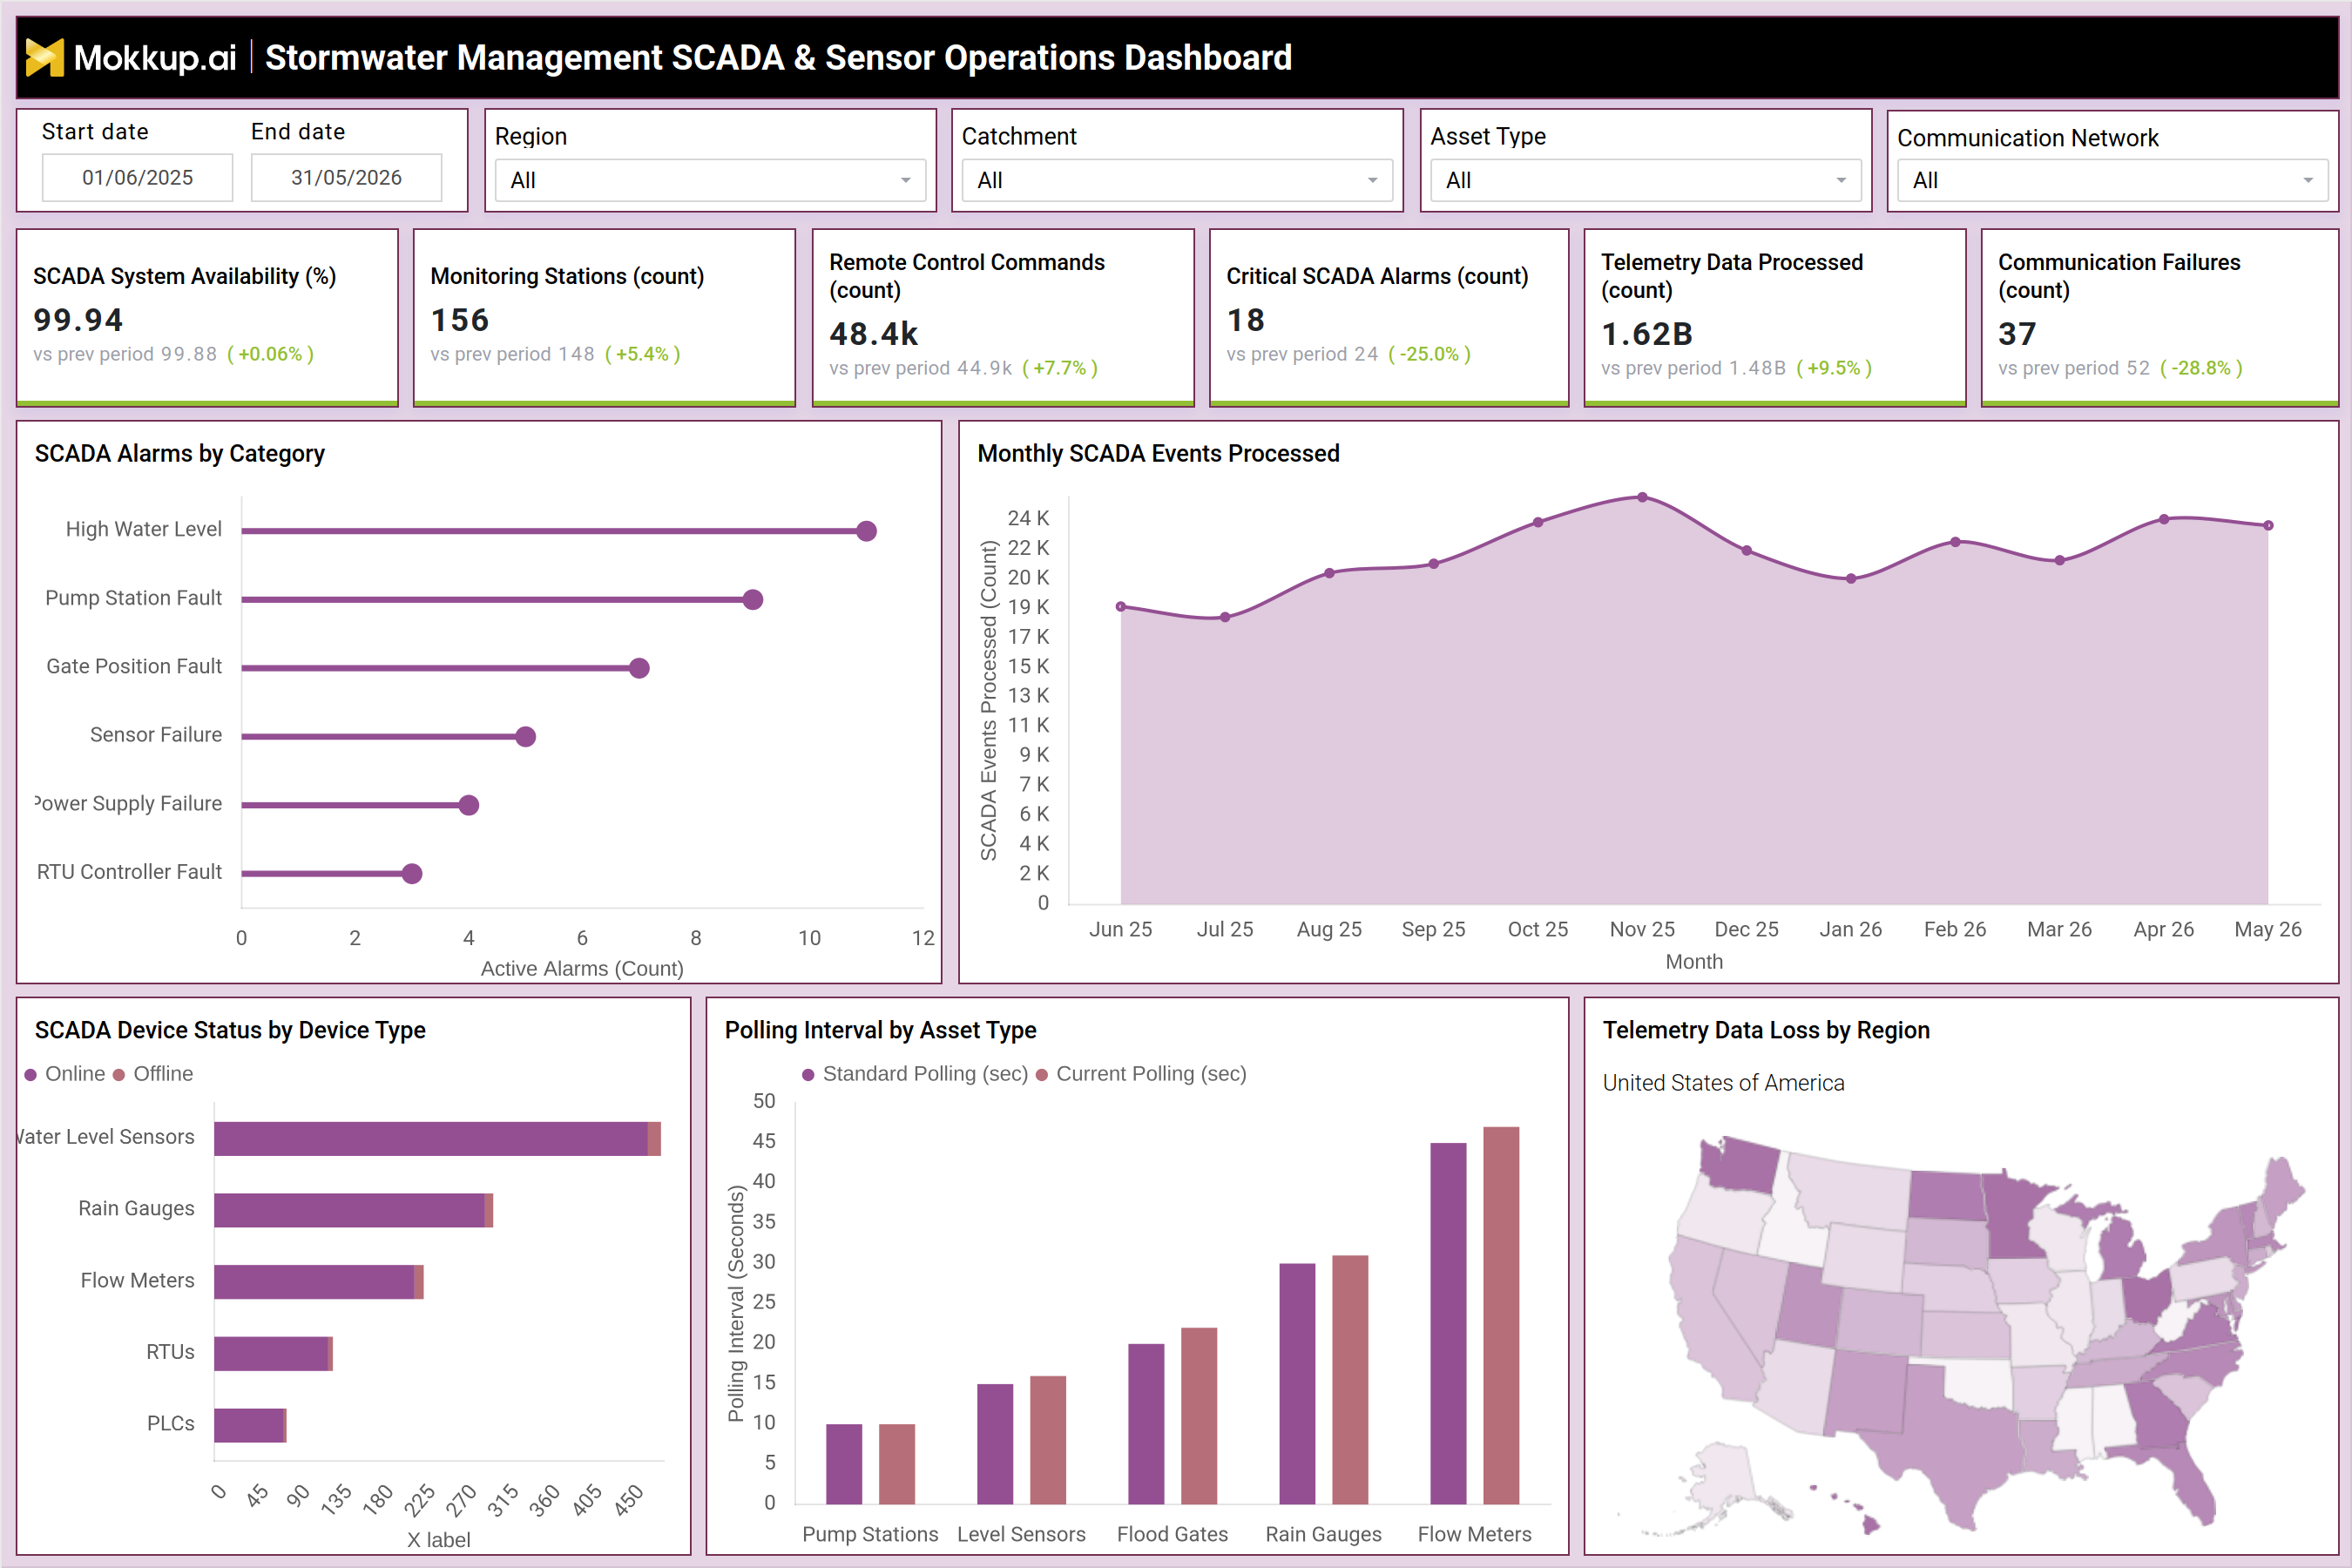
A Stormwater Management SCADA & Sensor Operations Dashboard is a monitoring wireframe that integrates supervisory control and data acquisition (SCADA) signals from pump stations, floodgates, rain gauges, flow meters, and remote terminal units into a single operational view. It is built for stormwater and public works teams who need to track system availability, alarm activity, and device connectivity across a distributed sensor network without switching between separate SCADA consoles. This stormwater SCADA monitoring dashboard consolidates system health, communication status, and telemetry volume so operations staff can see where infrastructure is performing well and where it needs attention. Instead of reviewing raw SCADA logs asset by asset, supervisors get a structured layout with filters for region, catchment, asset type, and communication network, allowing them to narrow the view to the exact segment of the network relevant to their shift or investigation. As a sensor operations dashboard for stormwater management, it is designed to support utilities, municipal water departments, and infrastructure operators who are responsible for keeping flood-control and drainage assets online and responsive.
How to Create a Stormwater Management SCADA & Sensor Operations Dashboard
You don't need to build your report from scratch, just start with a ready-to-use dashboard template from Mokkup. Add in your data and export it however you like. Here's how to do it:
1. Create or Log in to Your Mokkup Account
Start by signing up on Mokkup.ai using your email. If you already have an account, just log in, and you'll be good to go.
2. Choose and Customize Your Dashboard Template
Find the Stormwater Management SCADA & Sensor Operations Dashboard template in the Templates section. Use the drag-and-drop editor to adjust KPIs, edit filters, or add elements based on your data.
3. Export to Your BI Tool
Once your dashboard wireframe is ready, use the BI Tool Export feature to send it directly to Power BI or Tableau for further analysis and enhancements. You can also download the dashboard as a PDF, PNG, or JPEG, embed it on a platform, or invite your team to collaborate.
Note: This is a Pro template. You'll need a Pro subscription on Mokkup to use and customize this dashboard wireframe. Upgrade anytime to unlock full access.
Stormwater Management SCADA & Sensor Operations Dashboard Example
A stormwater operations supervisor typically opens this dashboard at the start of a shift to check whether the sensor network is healthy before deciding where to send field crews. The first question is usually whether system availability and communication links are holding steady across the service area or whether a region, catchment, or communication network is showing signs of stress. Using the date range, region, catchment, asset type, and communication network filters, the supervisor can narrow the view down to a specific drainage zone or device category and immediately see whether that segment needs escalation. On this single screen, operations teams can identify which alarm categories are recurring most often, such as issues tied to pump stations, gates, or sensors, and prioritize maintenance dispatch accordingly. Planners can compare polling behavior across asset types to judge whether current polling intervals are keeping pace with standard expectations, which helps them decide if a device is lagging in responsiveness. Reviewing the monthly trend of processed SCADA events lets managers track whether load on the network is climbing in step with growth in monitoring points or spiking unexpectedly, prompting a closer look at specific weeks or months.
The regional telemetry loss view helps teams spot where data quality is degrading geographically, so they can prioritize field checks in the areas most likely to be affected by outages or connectivity gaps. Because device status is broken down by online and offline counts across water level sensors, rain gauges, flow meters, RTUs, and PLCs, technicians can quickly isolate which device category has the most disconnected units and dispatch accordingly rather than checking every asset manually. As a sensor operations dashboard for stormwater management, this view turns scattered SCADA signals into a single decision point: where the network is reliable, where it is degrading, and which action should happen first. The overall outcome is a faster response to communication failures, better prioritization of field maintenance, and clearer visibility into how dependable the stormwater sensor network is over time.
How to Analyze Data in a Stormwater Management SCADA & Sensor Operations Dashboard
Here is how you can analyze data from this Flood gate and pump station monitoring software dashboard:
- Analyze regional performance: Filter by region and catchment to evaluate a specific drainage zone.
- Compare asset performance: Use asset type filters to analyze polling behavior across pump stations, gates, and sensors.
- Monitor SCADA alarms: Review alarms by category to identify the most frequent fault types in the network.
- Track network activity: Monitor monthly SCADA events processed to detect unusual spikes or drops in system load.
- Identify offline devices: Check device status by type to locate areas with a high concentration of offline units.
- Isolate communication issues: Use the communication network filter to investigate problems within a specific transmission channel.
- Prioritize field inspections: Review telemetry data loss by region to identify locations that require on-site checks.
- Monitor polling performance: Compare standard and current polling intervals to identify devices falling behind schedule.
Benefits of a Stormwater Management SCADA & Sensor Operations Dashboard
The following are the benefits of using this Telemetry data monitoring for stormwater systems dashboard:
- Centralize SCADA operations: Bring SCADA alarms, device status, and telemetry data into a single stormwater sensor operations dashboard.
- Reduce manual monitoring: Eliminate the need to switch between separate SCADA consoles and spreadsheets.
- Detect communication issues early: Identify communication failures before they escalate into service disruptions.
- Prioritize maintenance activities: Use alarm category trends to dispatch maintenance teams more efficiently.
- Monitor critical assets: Track flood gate and pump station performance to improve operational accountability.
- Improve telemetry oversight: Monitor telemetry data across regions to support targeted field response.
- Simplify operational reviews: Give supervisors a single filtered view instead of manually checking multiple assets.
- Customize infrastructure reporting: Use the dashboard as a starting point for building a municipal stormwater infrastructure dashboard.
KPIs to Track in a Stormwater Management SCADA & Sensor Operations Dashboard
The following key KPIs can be tracked by using this SCADA alarm tracking for water utilities dashboard:
- SCADA System Availability (%) – measures the percentage of time the SCADA system is operational and reachable.
- Monitoring Stations (count) – tracks the total number of active monitoring stations across the network.
- Remote Control Commands (count) – measures the volume of remote control actions issued to field devices.
- Critical SCADA Alarms (count) – tracks the number of high-severity alarms requiring immediate attention.
- Telemetry Data Processed (count) – measures the volume of sensor data ingested and processed by the system.
- Communication Failures (count) – tracks the number of lost or interrupted communication links across devices.
Frequently Asked Questions
1. What does a stormwater SCADA monitoring dashboard track?
It tracks SCADA system availability, monitoring station counts, alarm activity, telemetry volume, and communication failures. It also shows device status and polling performance across pump stations, gates, and sensors.
2. Who uses a sensor operations dashboard for stormwater management?
Stormwater utilities, municipal public works teams, and infrastructure operators use it to monitor flood control assets. It supports both operations supervisors and field maintenance teams.
3. Can this dashboard template be customized for a specific utility network?
Yes, the template can be edited in Mokkup using the drag-and-drop editor to adjust filters, KPIs, and layout. It can then be exported to Power BI or Tableau for further customization.