
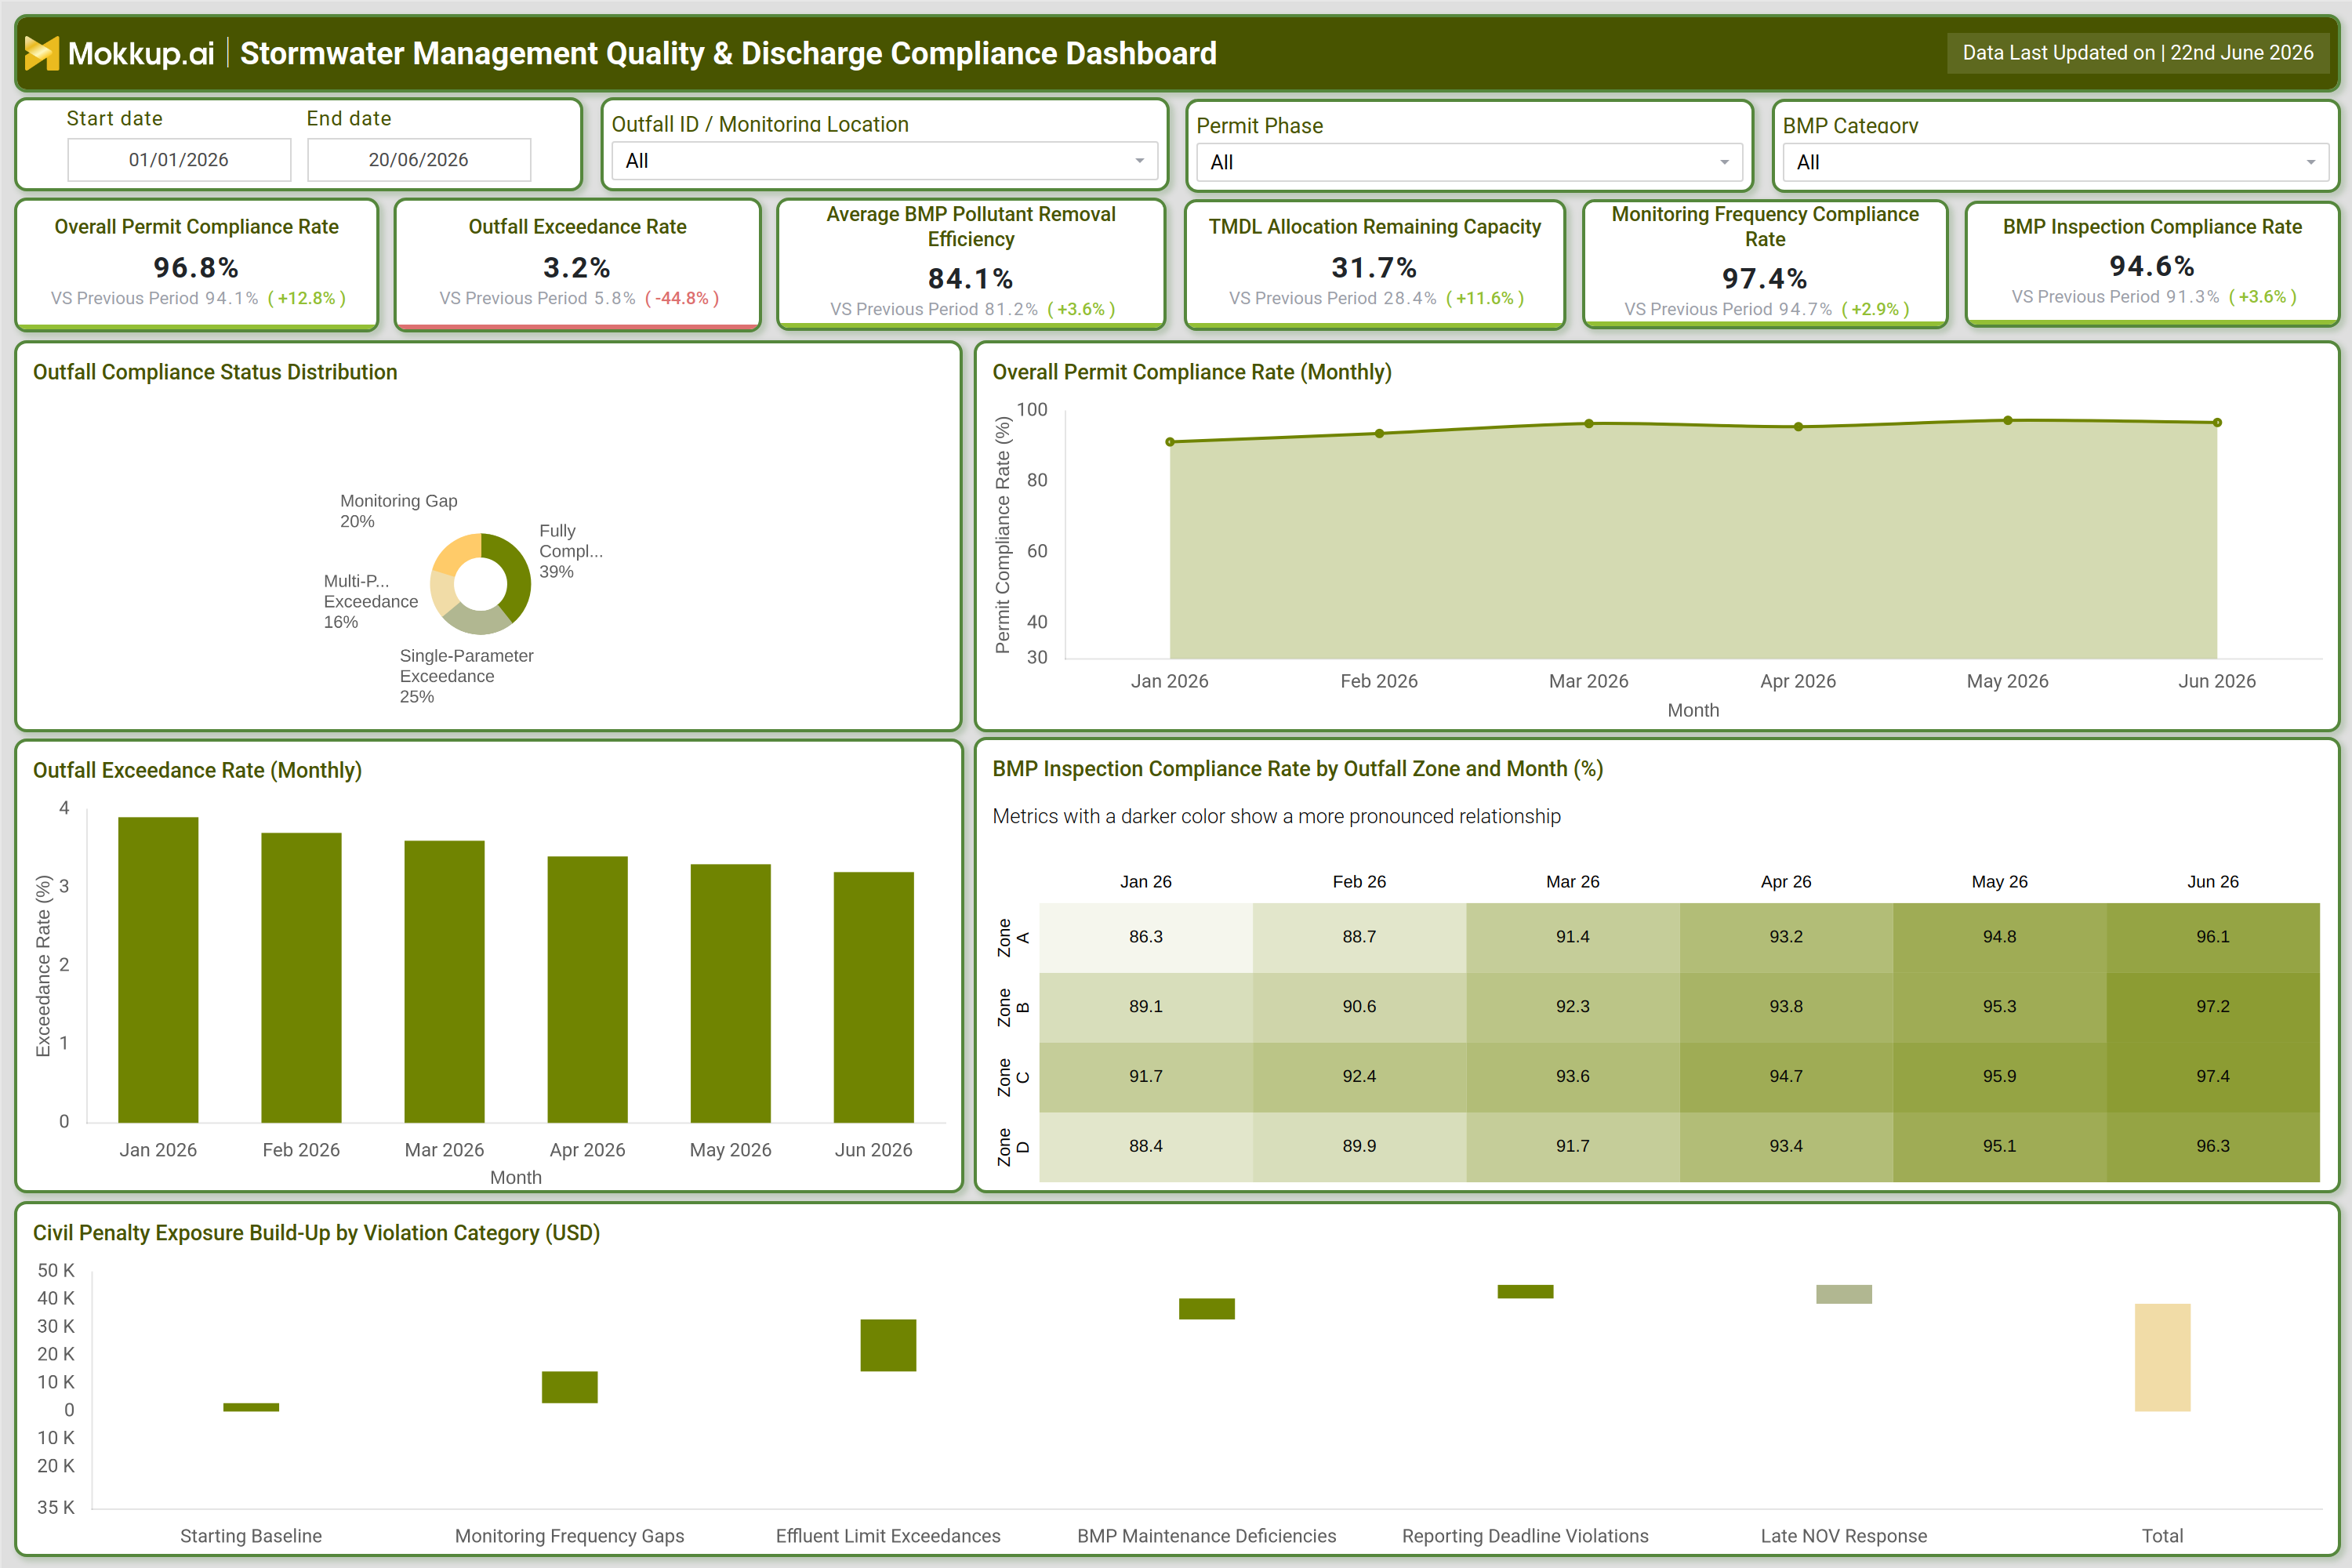
What is a Stormwater Management Quality & Discharge Compliance Dashboard?
A Stormwater Management Quality & Discharge Compliance Dashboard is a centralized reporting tool that consolidates permit compliance data, outfall monitoring records, BMP performance metrics, and regulatory penalty exposure into a single structured view. Environmental compliance teams, stormwater program managers, and municipal operations staff use this permit compliance rate dashboard to track whether discharge activities meet regulatory thresholds and to detect compliance gaps before they escalate into enforcement actions.
The stormwater discharge compliance dashboard surfaces key performance indicators across outfall zones, permit phases, and BMP categories, enabling teams to compare current-period performance against prior periods and to prioritize corrective actions based on measurable deviation. By bringing together outfall exceedance rate monitoring, BMP pollutant removal efficiency tracking, TMDL allocation remaining capacity signals, and civil penalty exposure by violation category into one view, teams eliminate the need to cross-reference disparate reports during audit cycles.
How to Create a Stormwater Management Quality & Discharge Compliance Dashboard
You don't need to build your report from scratch; just start with a ready-to-use dashboard template from Mokkup. Add in your data and export it however you like. Here's how to do it:
1. Create or Log in to Your Mokkup Account
Start by signing up on Mokkup.ai using your email. If you already have an account, just log in, and you'll be good to go.
2. Choose and Customize Your Dashboard Template
Find the Stormwater Management Quality & Discharge Compliance Dashboard template in the Templates section. Use the drag-and-drop editor to adjust KPIs, edit filters, or add elements based on your data.
3. Export to Your BI Tool
Once your dashboard wireframe is ready, use the BI Tool Export feature to send it directly to Power BI or Tableau for further analysis and enhancements. You can also download the dashboard as a PDF, PNG, or JPEG, embed it on a platform, or invite your team to collaborate.
Note: This is a Pro template. You'll need a Pro subscription on Mokkup to use and customize this dashboard wireframe. Upgrade anytime to unlock full access.
Stormwater Management Quality & Discharge Compliance Dashboard Example
A stormwater compliance manager opens the permit compliance rate dashboard at the start of a quarterly review and applies date range and permit phase filters to scope the analysis. The overall permit compliance KPI card signals whether the program is trending above or below the prior period, and the manager identifies whether improvement is driven by genuine operational gains or by seasonal discharge reductions. Moving to the outfall compliance status distribution donut, the manager tracks how outfalls break down across fully compliant, single-parameter exceedance, multi-parameter exceedance, and monitoring gap categories, then compares this period against the prior quarter to see whether the program is consolidating outfalls into the fully compliant segment.
Switching to the monthly outfall exceedance rate bar chart, the manager uses outfall exceedance rate monitoring to trace whether exceedances are rising or falling across the six-month window, and flags any month where the rate spiked for follow-up with field crews. The BMP inspection compliance heatmap by outfall zone and month reveals which zones are underperforming on inspection frequency, and the manager prioritizes those zones for corrective scheduling. A check of TMDL allocation remaining capacity confirms how much discharge headroom remains before the permit ceiling is reached. The manager then reviews the civil penalty exposure by violation category waterfall, spanning monitoring frequency gaps, effluent limit exceedances, BMP maintenance deficiencies, reporting deadline violations, and late NOV responses, and prioritizes remediation by dollar impact. BMP pollutant removal efficiency tracking confirms whether installed BMPs are operating within expected performance bands before the manager exports the dashboard and shares it with the regulatory affairs team.
How to Analyze Data in a Stormwater Management Quality & Discharge Compliance Dashboard
Here is how you can analyze data from this dashboard:
- Filter by permit phase and BMP category first to scope the analysis to the correct regulatory context.
- Compare the overall permit compliance rate against the prior-period benchmark to determine whether the program is improving or regressing.
- Use the outfall compliance status distribution donut to assess the ratio of fully compliant outfalls to those flagged with exceedances.
- Review the monthly outfall exceedance rate monitoring bar chart to detect seasonality or operational events that correlate with exceedance spikes.
- Examine the BMP inspection compliance heatmap to locate zones where inspection frequency has dropped below required thresholds.
- Check TMDL allocation remaining capacity to determine how close the program is to its permitted discharge ceiling.
- Analyze the civil penalty exposure by violation category waterfall to rank violation types by financial impact.
- Track BMP pollutant removal efficiency tracking over time to confirm BMPs are delivering removal rates consistent with their design specifications.
Benefits of a Stormwater Management Quality & Discharge Compliance Dashboard
The following are the benefits of using this dashboard:
- Consolidates discharge monitoring, BMP inspection, and penalty data into one permit compliance rate dashboard, cutting time spent on pre-audit report compilation.
- Permit phase and BMP category filters let analysts isolate specific regulatory windows without rebuilding reports from scratch.
- The outfall exceedance rate monitoring trend enables early detection of upward exceedance patterns before they trigger formal enforcement notices.
- Zone-level heatmap breakdowns identify which outfall zones require immediate inspection follow-up without reviewing individual field logs.
- Civil penalty exposure by violation category disaggregation helps compliance teams allocate remediation budgets to the highest-risk violation types.
- TMDL allocation remaining capacity visibility lets program managers pace discharge activities and avoid permit ceiling breaches within a reporting cycle.
- BMP pollutant removal efficiency tracking at the dashboard level confirms whether BMPs are meeting design targets without requiring manual performance audits.
KPIs to Track in a Stormwater Management Quality & Discharge Compliance Dashboard
The following key KPIs can be tracked by using this dashboard:
- Overall Permit Compliance Rate: The percentage of discharge monitoring results across all outfalls that meet permit conditions within the selected period.
- Outfall Exceedance Rate: The share of outfall monitoring events where at least one parameter exceeded the permitted discharge limit.
- Average BMP Pollutant Removal Efficiency: The mean pollutant removal percentage delivered by all active BMPs, measured against their design removal targets.
- TMDL Allocation Remaining Capacity: The proportion of the total maximum daily load permit allocation not yet consumed by discharge activity in the current permit phase.
- Monitoring Frequency Compliance Rate: The percentage of required monitoring events completed on schedule across all outfall locations within the reporting period.
- BMP Inspection Compliance Rate: The percentage of required BMP inspections completed on time, tracked by outfall zone and reporting month.
Frequently Asked Questions
1. What data sources feed a stormwater discharge compliance dashboard?
The dashboard ingests discharge monitoring reports, BMP inspection logs, permit condition records, TMDL allocation schedules, and penalty assessment data. These sources are unified under a common outfall ID and permit phase key to enable cross-metric filtering. Data freshness depends on the reporting cadence defined in the permit.
2. How does the civil penalty exposure waterfall chart help prioritize compliance actions?
The waterfall chart disaggregates total penalty exposure across specific violation categories, showing the incremental contribution of each type to the cumulative total. Compliance teams use this to rank which violation category carries the highest financial risk and direct remediation resources accordingly. Viewing category-level exposure is more actionable than reviewing a single penalty total.
3. Can the stormwater discharge compliance dashboard be filtered by individual outfall zones?
Yes. The Outfall ID and Monitoring Location filters restrict all KPI cards and charts to the selected outfall scope. The BMP inspection compliance heatmap by outfall zone and month further extends this granularity, making it straightforward to compare zone-level performance without separate reports.