
What is a Special Education Workforce Management Dashboard?
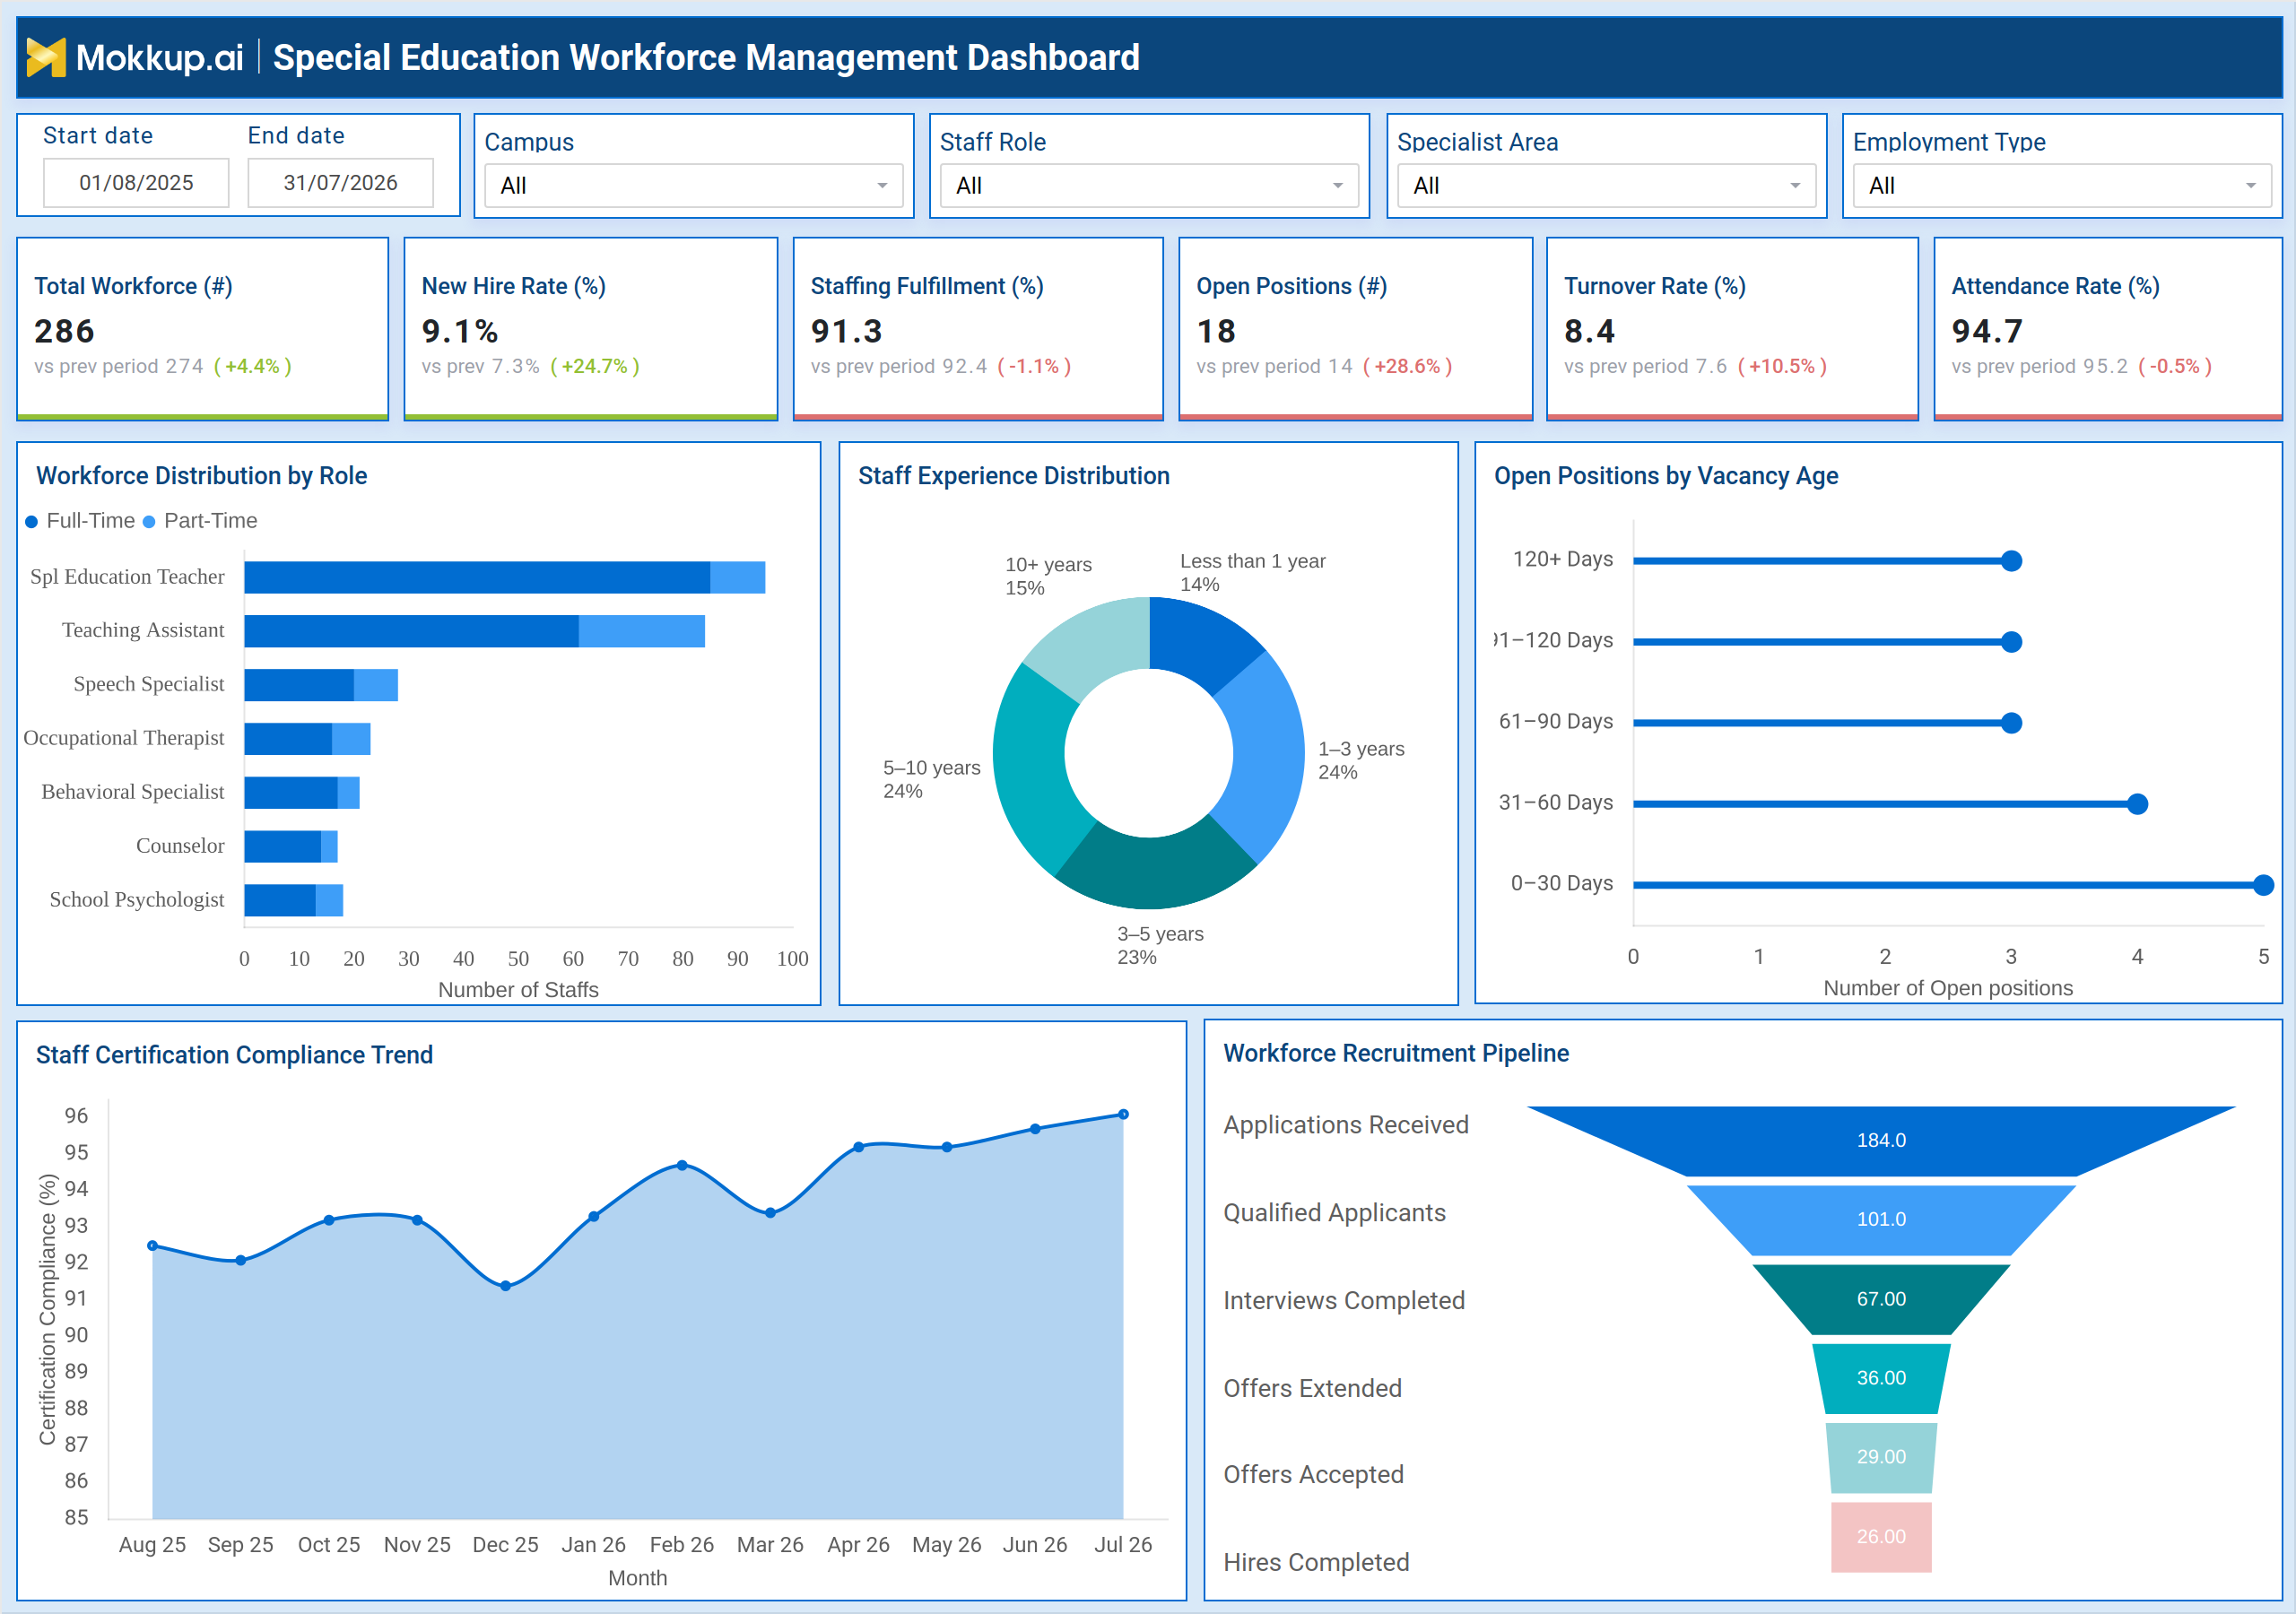
The Special Education Workforce Management Dashboard is a wireframe template built for special education administrators, HR coordinators, and program directors who need a single view into staffing across campuses. It brings together headcount, hiring activity, certification status, and turnover trends, giving teams a foundation for tracking special education staff turnover without switching between spreadsheets. Filters for campus, staff role, specialist area, and employment type let users narrow the view to a specific team, such as speech specialists or teaching assistants, and compare full-time and part-time coverage across roles.
Because special education programs depend on specific certifications and specialist ratios, this dashboard supports staff certification compliance tracking for schools alongside staffing fulfillment and open positions, all inside a single view of workforce management for special education programs. It also gives leadership a starting point for special education teacher retention strategies by making tenure and turnover patterns visible early. Teams get a template they can customize with their own data instead of building a workforce report from scratch.
How to Create a Special Education Workforce Management Dashboard
You don't need to build your report from scratch—just start with a ready-to-use dashboard template from Mokkup. Add in your data and export it however you like. Here's how to do it:
1. Create or Log in to Your Mokkup Account
Start by signing up on Mokkup.ai using your email. If you already have an account, just log in, and you'll be good to go.
2. Choose and Customize Your Dashboard Template
Find the Special Education Workforce Management Dashboard template in the Templates section. Use the drag-and-drop editor to adjust KPIs, edit filters, or add elements based on your data.
3. Export to Your BI Tool
Once your dashboard wireframe is ready, use the BI Tool Export feature to send it directly to Power BI or Tableau for further analysis and enhancements. You can also download the dashboard as a PDF, PNG, or JPEG, embed it on a platform, or invite your team to collaborate.
Note: This is a Pro template. You'll need a Pro subscription on Mokkup to use and customize this dashboard wireframe. Upgrade anytime to unlock full access.
Special Education Workforce Management Dashboard Example
A special education program director opens this dashboard at the start of a planning cycle to understand whether current staffing levels match student caseloads across campuses. Using the campus, staff role, specialist area, and employment type filters, they narrow the view to the team they are responsible for and check how current headcount compares with the prior period before deciding whether to request additional hires.
From there, the director reviews how staffing fulfillment and open positions are trending to judge whether recruiting is keeping pace with vacancies and whether turnover is concentrated in a particular role or specialist area. Looking at the workforce distribution by role, they can identify which positions rely most heavily on part-time staff and where full-time coverage is thin. The staff experience distribution helps the team gauge how much institutional knowledge sits with tenured staff versus newer hires, which shapes decisions around mentoring and training investment. When open positions linger, planners can compare vacancy age bands to prioritize the roles that have stayed unfilled the longest, rather than treating every opening the same way.
Further down, the team studies the recruitment pipeline tracking for special education hires from applications received through hires completed to spot where candidates are dropping off, whether that is at the interview stage or after an offer is extended. Alongside this, the certification compliance trend gives leadership a read on whether the workforce is staying current with required credentials over time. Together, these views help the program director staff classrooms appropriately, address turnover before it affects service delivery, and keep hiring aligned with the specialized skill sets that special education students depend on.
How to Analyze Data in a Special Education Workforce Management Dashboard
Here is how you can analyze data from this dashboard:
- Filter by Campus / Staff Role: Compare staffing fulfillment across specific teams and locations.
- Review Workforce Distribution by Role: Identify roles that rely heavily on part-time staff and may need more stable coverage.
- Track Turnover vs. Attendance: Compare staff turnover with attendance rates to identify potential workforce stability issues.
- Analyze Staff Experience Distribution: Balance mentoring needs with the availability of experienced and tenured staff.
- Monitor Open Positions by Vacancy Age: Prioritize recruitment for roles that have remained unfilled the longest.
- Track Staffing Fulfillment: Compare current headcount with approved positions to identify staffing gaps.
- Follow the Recruitment Pipeline: Monitor each hiring stage to identify where candidates are dropping off.
- Monitor Certification Compliance: Track certification trends monthly to identify lapses before they affect service delivery.
- Compare New Hires vs. Staffing Fulfillment: Assess whether hiring activity is effectively closing existing staffing gaps.
Benefits of a Special Education Workforce Management Dashboard
The following are the benefits of using this dashboard:
- Centralizes Workforce Data: Brings staffing, hiring, and compliance data into one dashboard view.
- Tracks Staff Turnover: Monitors special education staff turnover early to reduce the risk of disruptions to classroom coverage.
- Supports Multi-Campus Workforce Management: Provides a consistent workforce management view for special education programs across campuses.
- Monitors Recruitment Progress: Tracks the recruitment pipeline for special education hires and identifies bottlenecks early.
- Tracks Staffing Fulfillment: Gives leadership clear visibility into staffing levels against approved requirements.
- Supports Mentoring & Training: Helps HR teams plan mentoring and training based on staff experience distribution.
- Monitors Certification Compliance: Tracks staff certification compliance across roles and specialist areas.
- Reduces Manual Reporting: Simplifies reporting with filters for campus, role, specialist area, and employment type.
KPIs to Track in a Special Education Workforce Management Dashboard
The following key KPIs can be tracked by using this dashboard:
- Total Workforce (#): the total number of active staff across all special education roles and campuses.
- New Hire Rate (%): the share of the workforce added through recent hiring, indicating recruiting momentum.
- Staffing Fulfillment (%): the proportion of required positions currently filled against approved headcount.
- Open Positions (#): the count of unfilled roles awaiting candidates.
- Turnover Rate (%): the rate at which staff leave their positions during the period, a core input for special education teacher retention strategies.
- Attendance Rate (%): the percentage of scheduled staff time that is actually worked, reflecting workforce reliability.
Frequently Asked Questions
1. What does the Special Education Workforce Management Dashboard track?
It tracks headcount, hiring activity, turnover, attendance, certification compliance, and recruitment pipeline stages for special education staff. Filters for campus, staff role, specialist area, and employment type let teams narrow the view to specific segments of their workforce.
2. Who uses this dashboard?
Special education program directors, HR coordinators, and district administrators use it to plan hiring and monitor staffing across campuses. It also supports special education teacher retention strategies by surfacing turnover and experience trends together.
3. Can I customize this dashboard template with my own data?
Yes, the template can be edited in Mokkup's drag-and-drop editor and exported to Power BI, Tableau, PDF, PNG, or JPEG. A Pro subscription is required to fully customize and export the wireframe.