
What is a Solar Plant Market Trading Performance Dashboard?
A Solar Plant Market Trading Performance Dashboard template is a centralized analytical platform designed to track, measure, and optimize trading outcomes in competitive electricity markets. It enables utilities and solar asset operators to monitor the performance of their plants across day-ahead, intra-day, and term-ahead markets. By using a solar plant market trading performance monitoring dashboard, operators gain visibility into market-clearing prices, bid strategies, forecast accuracy, schedule deviations, penalties, trading risks, and overall revenue contribution from each market segment.
This dashboard wireframe serves as a utility-scale solar market bidding and revenue analytics tool, enabling trading teams to improve bidding discipline, reduce imbalance costs, forecast market opportunities, and enhance participation in ISO and RTO markets. It consolidates complex trading data into clear, actionable insights for executive, operational, and energy trading teams.
How to Create a Solar Plant Market Trading Performance Dashboard
You don’t need to build your report from scratch; just start with a ready-to-use Solar Plant Market Trading Performance dashboard template from Mokkup. Add in your data and export it however you like. Here’s how to do it:
1. Create or Log in to Your Mokkup Account
Start by signing up on Mokkup.ai using your email. If you already have an account, just log in, and you’ll be good to go.
2. Choose and Customize Your Dashboard Template
Find the Solar Plant Market Trading Performance Dashboard template in the Templates section. Use the drag-and-drop editor to adjust KPIs, edit filters, or add elements based on your data.
3. Export to Your BI Tool
Once your dashboard wireframe is ready, use the BI Tool Export feature to send it directly to Power BI or Tableau for further analysis and enhancements. You can also download the dashboard as a PDF, PNG, or JPEG, embed it on a platform, or invite your team to collaborate.
Note: This is a Pro template. You’ll need a Pro subscription on Mokkup to use and customize this dashboard wireframe. Upgrade anytime to unlock full access.
Solar Plant Market Trading Performance Dashboard Example
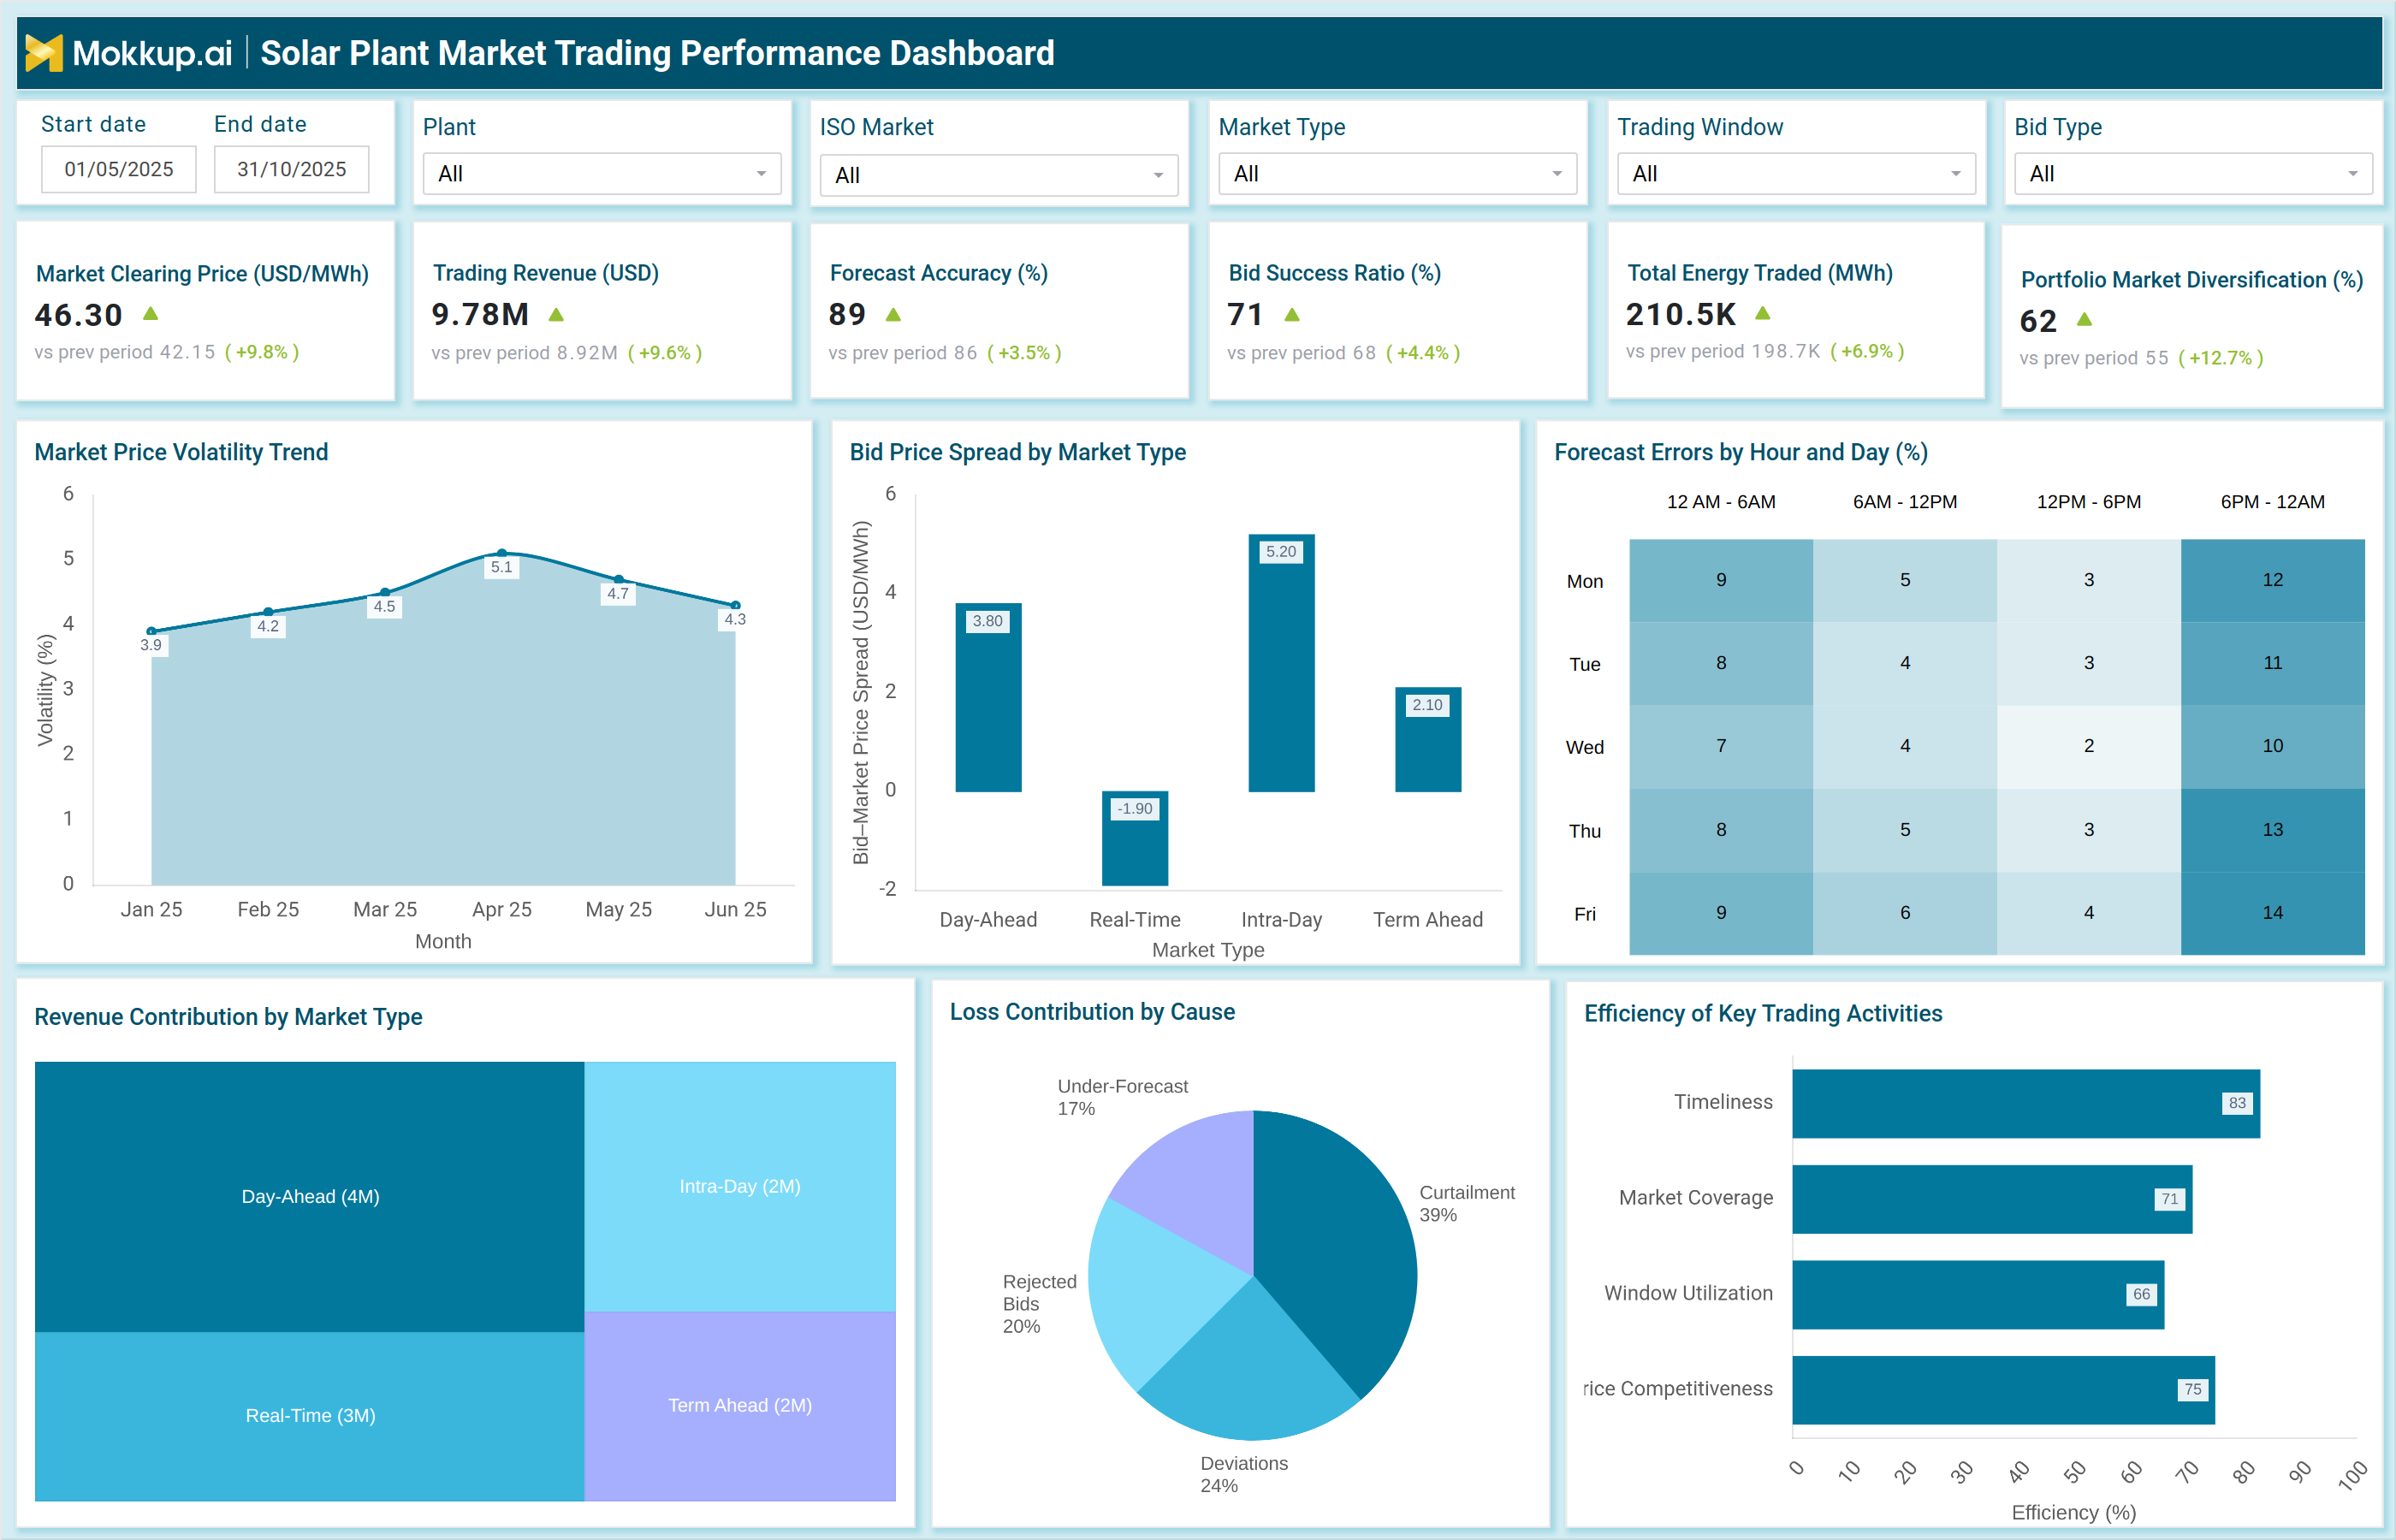
The example dashboard presents a complete view of how solar assets perform in competitive power markets. It includes real-time KPIs such as Market Clearing Price (USD/MWh), Trading Revenue, Bid Success Ratio, Forecast Accuracy, Total Energy Traded, and Portfolio Market Diversification. Visual components, such as the Market Price Volatility Trend, Bid Price Spread by Market Type, and Revenue Contribution by Market Type, enable trading analysts to assess the contribution of different markets (Day-Ahead, Real-Time, Intra-Day, and Term-Ahead) to total revenue.
The dashboard also includes performance diagnostics such as Forecast Errors by Hour & Day, Loss Contribution by Cause, and Trading Activity Efficiency. These visuals support the analysis of renewable energy market schedule deviations and penalties, making it easier to identify imbalance drivers, such as forecast deviations, rejected bids, and curtailable conditions. Overall, this dashboard serves as a comprehensive evaluation of solar market price trends and trading opportunities, enabling operators to forecast market trends, optimize bidding strategies, and manage settlement risks across ISO markets.
How to Analyze Data in Solar Plant Market Trading Performance Dashboard
Here is how you can analyze data from this dashboard:
- Market-Clearing Price Trends: Compare price movements to identify profitable trading windows.
- Bid Success Ratios: Monitor success rates across DAM, RTM, and TAM to assess bidding quality.
- Forecast Accuracy vs Energy Traded: Evaluate gaps to reduce schedule deviations and imbalance costs.
- Price Spread by Market Type: Analyze spreads to pinpoint the most profitable market segment.
- Hourly Forecast Error Heatmaps: Check recurring under-forecast or over-forecast patterns.
- Loss Contribution Analysis: Study curtailment, deviations, and rejections to reduce penalties.
- Market Diversification Score: Review exposure across multiple markets to balance risk.
- Trading Efficiency Metrics: Assess timeliness, coverage, competitiveness, and window utilization.
- ISO Participation Metrics: Compare performance across different grid operators.
- Revenue Trend Monitoring: Track revenue patterns to assess the effectiveness of trading strategies.
Benefits of Solar Plant Market Trading Performance Dashboard
The following are the benefits of using this dashboard:
- Smarter Bidding Strategy: Enhances planning using market-clearing price insights.
- Higher Forecast Accuracy: Reduces deviation risks and penalties for imbalances.
- Stronger ISO Participation: Improves performance tracking across trading zones.
- Optimized Revenue Outcomes: Identifies high-value trading windows and spreads.
- Real-Time Decision Support: Enables quick action through DAM and RTM performance data.
- Lower Financial Losses: Highlights causes of rejections, deviations, and curtailments.
- Better Market Diversification: Stabilizes revenue through multi-market participation.
- Accurate Settlements: Improves clarity on penalties and discrepancy sources.
- Competitive Edge: Tracks price competitiveness, timing, and bid coverage.
- Strategic Insights: Supports planning, risk mitigation, and long-term revenue growth.
KPIs to Track in Solar Plant Market Trading Performance Dashboard
The following key KPIs can be tracked by using this dashboard:
- Market Clearing Price (USD/MWh): Measures the average market price at which energy was traded.
- Trading Revenue (USD): Total revenue generated across all market types.
- Forecast Accuracy (%): Indicates how close forecasted generation is to actual output.
- Bid Success Ratio (%): Percentage of submitted bids successfully cleared in the market.
- Total Energy Traded (MWh): Volume of energy traded across Day-Ahead, Intra-Day, Real-Time, and Term-Ahead markets.
- Portfolio Market Diversification (%): Measures the spread of trading across multiple market types to minimize risk.
- Price Volatility (%): Captures fluctuations in market-clearing prices.
- Bid Price Spread (USD/MWh): Difference between bid price and market-clearing price.
- Revenue Contribution by Market Type: Breakdown of revenue contribution from each trading category.
- Loss Contribution by Cause (%): Identifies factors such as deviations, under-forecasting, curtailment, or rejected bids.
- Trading Efficiency Metrics (%): Measures timeliness, market coverage, price competitiveness, and window utilization.
- ISO Market Participation Metrics: Evaluates performance across different ISO markets.
- Imbalance Cost Tracking: Measures penalty exposure due to schedule deviations.
Frequently Asked Questions
Q1. Who uses a Solar Plant Market Trading Performance Dashboard?
Energy trading teams, utility operators, portfolio managers, and market analysts in solar power companies.
Q2. Why is forecast accuracy important in energy trading?
Inaccurate forecasts lead to schedule deviations, imbalance penalties, and loss of trading revenue.
Q3. Which markets does the dashboard typically support?
Day-Ahead, Real-Time, Intra-Day, and Term-Ahead trading markets across various ISO zones.