
What is a Smart Water Meter Performance Dashboard?
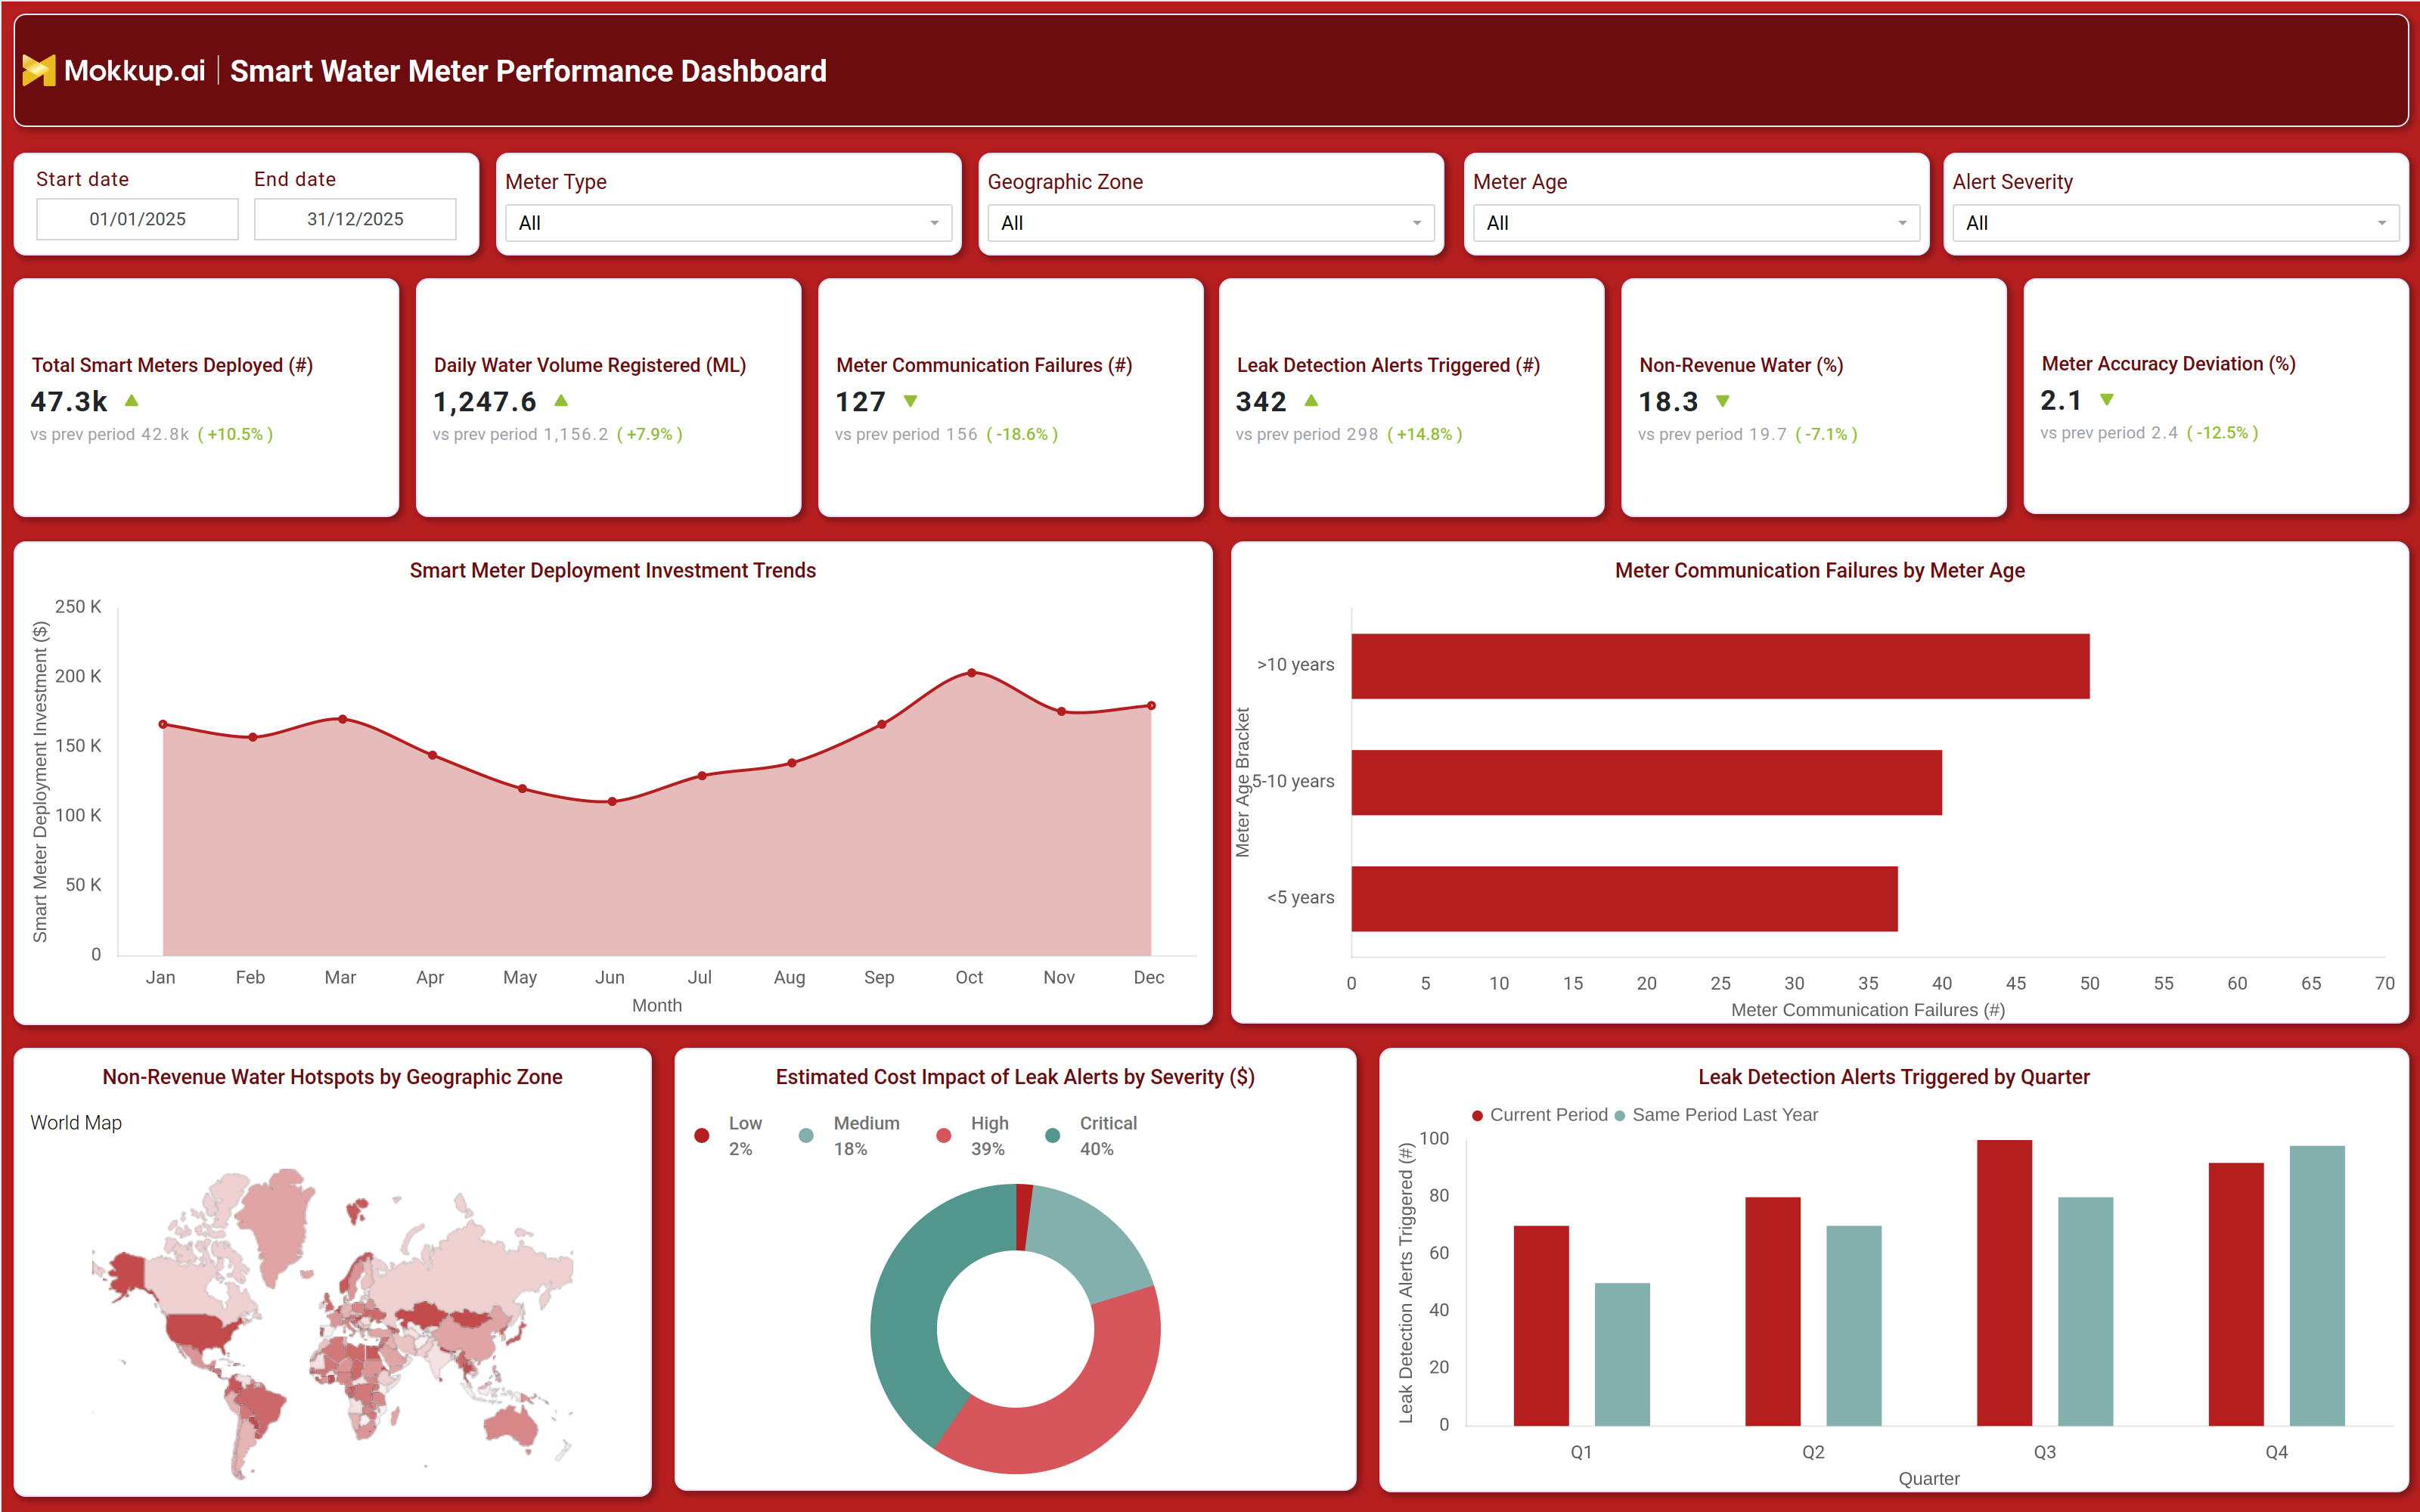
A smart water meter performance dashboard gives water utility teams a single view into how their metering infrastructure is performing across a service area. The Smart Water Meter Performance Dashboard consolidates meter deployment counts, water volume registered, communication reliability, leak alerts, and revenue loss indicators into one workspace so operations and engineering teams do not have to pull data from separate systems. Filters for meter type, geographic zone, meter age, and alert severity let users narrow the view to a specific meter cohort or region without rebuilding any reports. Because the dashboard combines infrastructure health with financial impact, it works equally well for field operations managers monitoring meter uptime and finance teams running non-revenue water hotspot monitoring across zones. Utilities rolling out large-scale smart metering programs use this dashboard to confirm that investment in new meters is translating into fewer failures and more accurate billing data.
How to Create a Smart Water Meter Performance Dashboard
You don't need to build your report from scratch, just start with a ready-to-use dashboard template from Mokkup. Add in your data and export it however you like. Here's how to do it:
1. Create or Log in to Your Mokkup Account
Start by signing up on Mokkup.ai using your email. If you already have an account, just log in, and you'll be good to go.
2. Choose and Customize Your Dashboard Template
Find the Smart Water Meter Performance Dashboard template in the Templates section. Use the drag-and-drop editor to adjust KPIs, edit filters, or add elements based on your data.
3. Export to Your BI Tool
Once your dashboard wireframe is ready, use the BI Tool Export feature to send it directly to Power BI or Tableau for further analysis and enhancements. You can also download the dashboard as a PDF, PNG, or JPEG, embed it on a platform, or invite your team to collaborate.
Note: This is a Pro template. You'll need a Pro subscription on Mokkup to use and customize this dashboard wireframe. Upgrade anytime to unlock full access.
Smart Water Meter Performance Dashboard Example
A water utility operations manager opens the Smart Water Meter Performance Dashboard at the start of a reporting cycle to understand whether the metering fleet is functioning as expected across the network. Using the meter type, geographic zone, meter age, and alert severity filters, the manager narrows the view to the segment under review and checks whether deployment counts and registered water volume are moving in the expected direction for the period. From there, the manager reviews communication reliability by meter age bracket to identify which cohorts are generating the most failures, since older meters typically need closer attention. Running non-revenue water hotspot monitoring by geographic zone helps the team prioritize which regions to investigate first for possible leaks or unbilled usage.
When leak detection alerts spike in a particular quarter, planners can compare the current period against the same period last year to judge whether the increase reflects a seasonal pattern or an emerging infrastructure issue, and they can weigh the estimated cost impact of alerts by severity to decide how urgently a response is needed. Over time, this dashboard helps utilities connect meter reliability, revenue protection, and capital investment planning into one recurring review, so smart metering programs stay accountable to the outcomes they were funded to deliver.
How to Analyze Data in a Smart Water Meter Performance Dashboard
Here is how you can analyze data from this dashboard:
- Analyze specific meter groups: Filter by geographic zone and meter age to evaluate a targeted segment of the network.
- Measure deployment performance: Compare total smart meters deployed with daily water volume registered to assess fleet productivity.
- Track communication failures: Review the meter communication failure dashboard by meter age to identify aging devices driving connectivity issues.
- Monitor rollout investments: Track smart meter deployment investment trends month over month to ensure spending aligns with rollout plans.
- Compare leak detection trends: Cross-check quarterly leak detection alerts against the same period last year to distinguish seasonal patterns from emerging issues.
- Prioritize critical alerts: Apply the alert severity filter to focus on high- and critical-priority leak alerts first.
Benefits of a Smart Water Meter Performance Dashboard
The following are the benefits of using this dashboard:
- Centralize meter monitoring: Provide operations teams with a single dashboard to track meter communication failures instead of scattered field reports.
- Prioritize leak response: Group leak alerts by estimated cost impact to evaluate financial risk before dispatching maintenance crews.
- Identify water loss hotspots: Highlight non-revenue water by zone to focus revenue protection efforts on the highest-loss areas.
- Align rollout investments: Compare deployment spending with meter counts to help finance and operations plan rollout budgets.
- Monitor meter accuracy: Track meter accuracy deviation trends to schedule recalibration before billing accuracy is affected.
- Reduce reporting effort: Eliminate manual reconciliation of meter data across spreadsheets and multiple BI reports.
KPIs to Track in a Smart Water Meter Performance Dashboard
The following key KPIs can be tracked by using this meter communication failure tracking dashboard:
- Total Smart Meters Deployed (count): tracks how many smart meters are active across the service area.
- Daily Water Volume Registered (ML): measures the volume of water metered each day, an indicator of fleet output.
- Meter Communication Failures (count): counts meters that failed to transmit readings, a leading signal of network reliability.
- Leak Detection Alerts Triggered (count): captures how many leak alerts the system generated, feeding directly into leak detection alert cost impact analysis for prioritizing crew response.
- Non-Revenue Water (%): shows the share of water produced that is not billed, tied closely to non-revenue water hotspot monitoring across zones.
- Meter Accuracy Deviation (%): measures how far meter readings drift from expected accuracy, the core metric behind meter accuracy deviation monitoring dashboard reviews.
- Smart Meter Deployment Investment ($): tracks capital spend on meter rollout, supporting smart meter deployment investment tracking against fleet growth.
Frequently Asked Questions
1. What is a smart water meter performance dashboard used for?
It gives utility teams one place to monitor meter deployment, communication reliability, leak alerts, and non-revenue water so they can act on metering issues before they affect billing or supply.
2. How often should teams review meter communication failures?
Most utilities review communication failures weekly, using the meter age filter to catch aging cohorts before failures compound. Monthly reviews work for lower-risk zones with stable meter fleets.
3. Can this dashboard be customized for a specific utility's meter fleet?
Yes. The dashboard wireframe from Mokkup can be edited to match your meter types, zones, and alert thresholds, then exported to Power BI or Tableau for further build-out.