
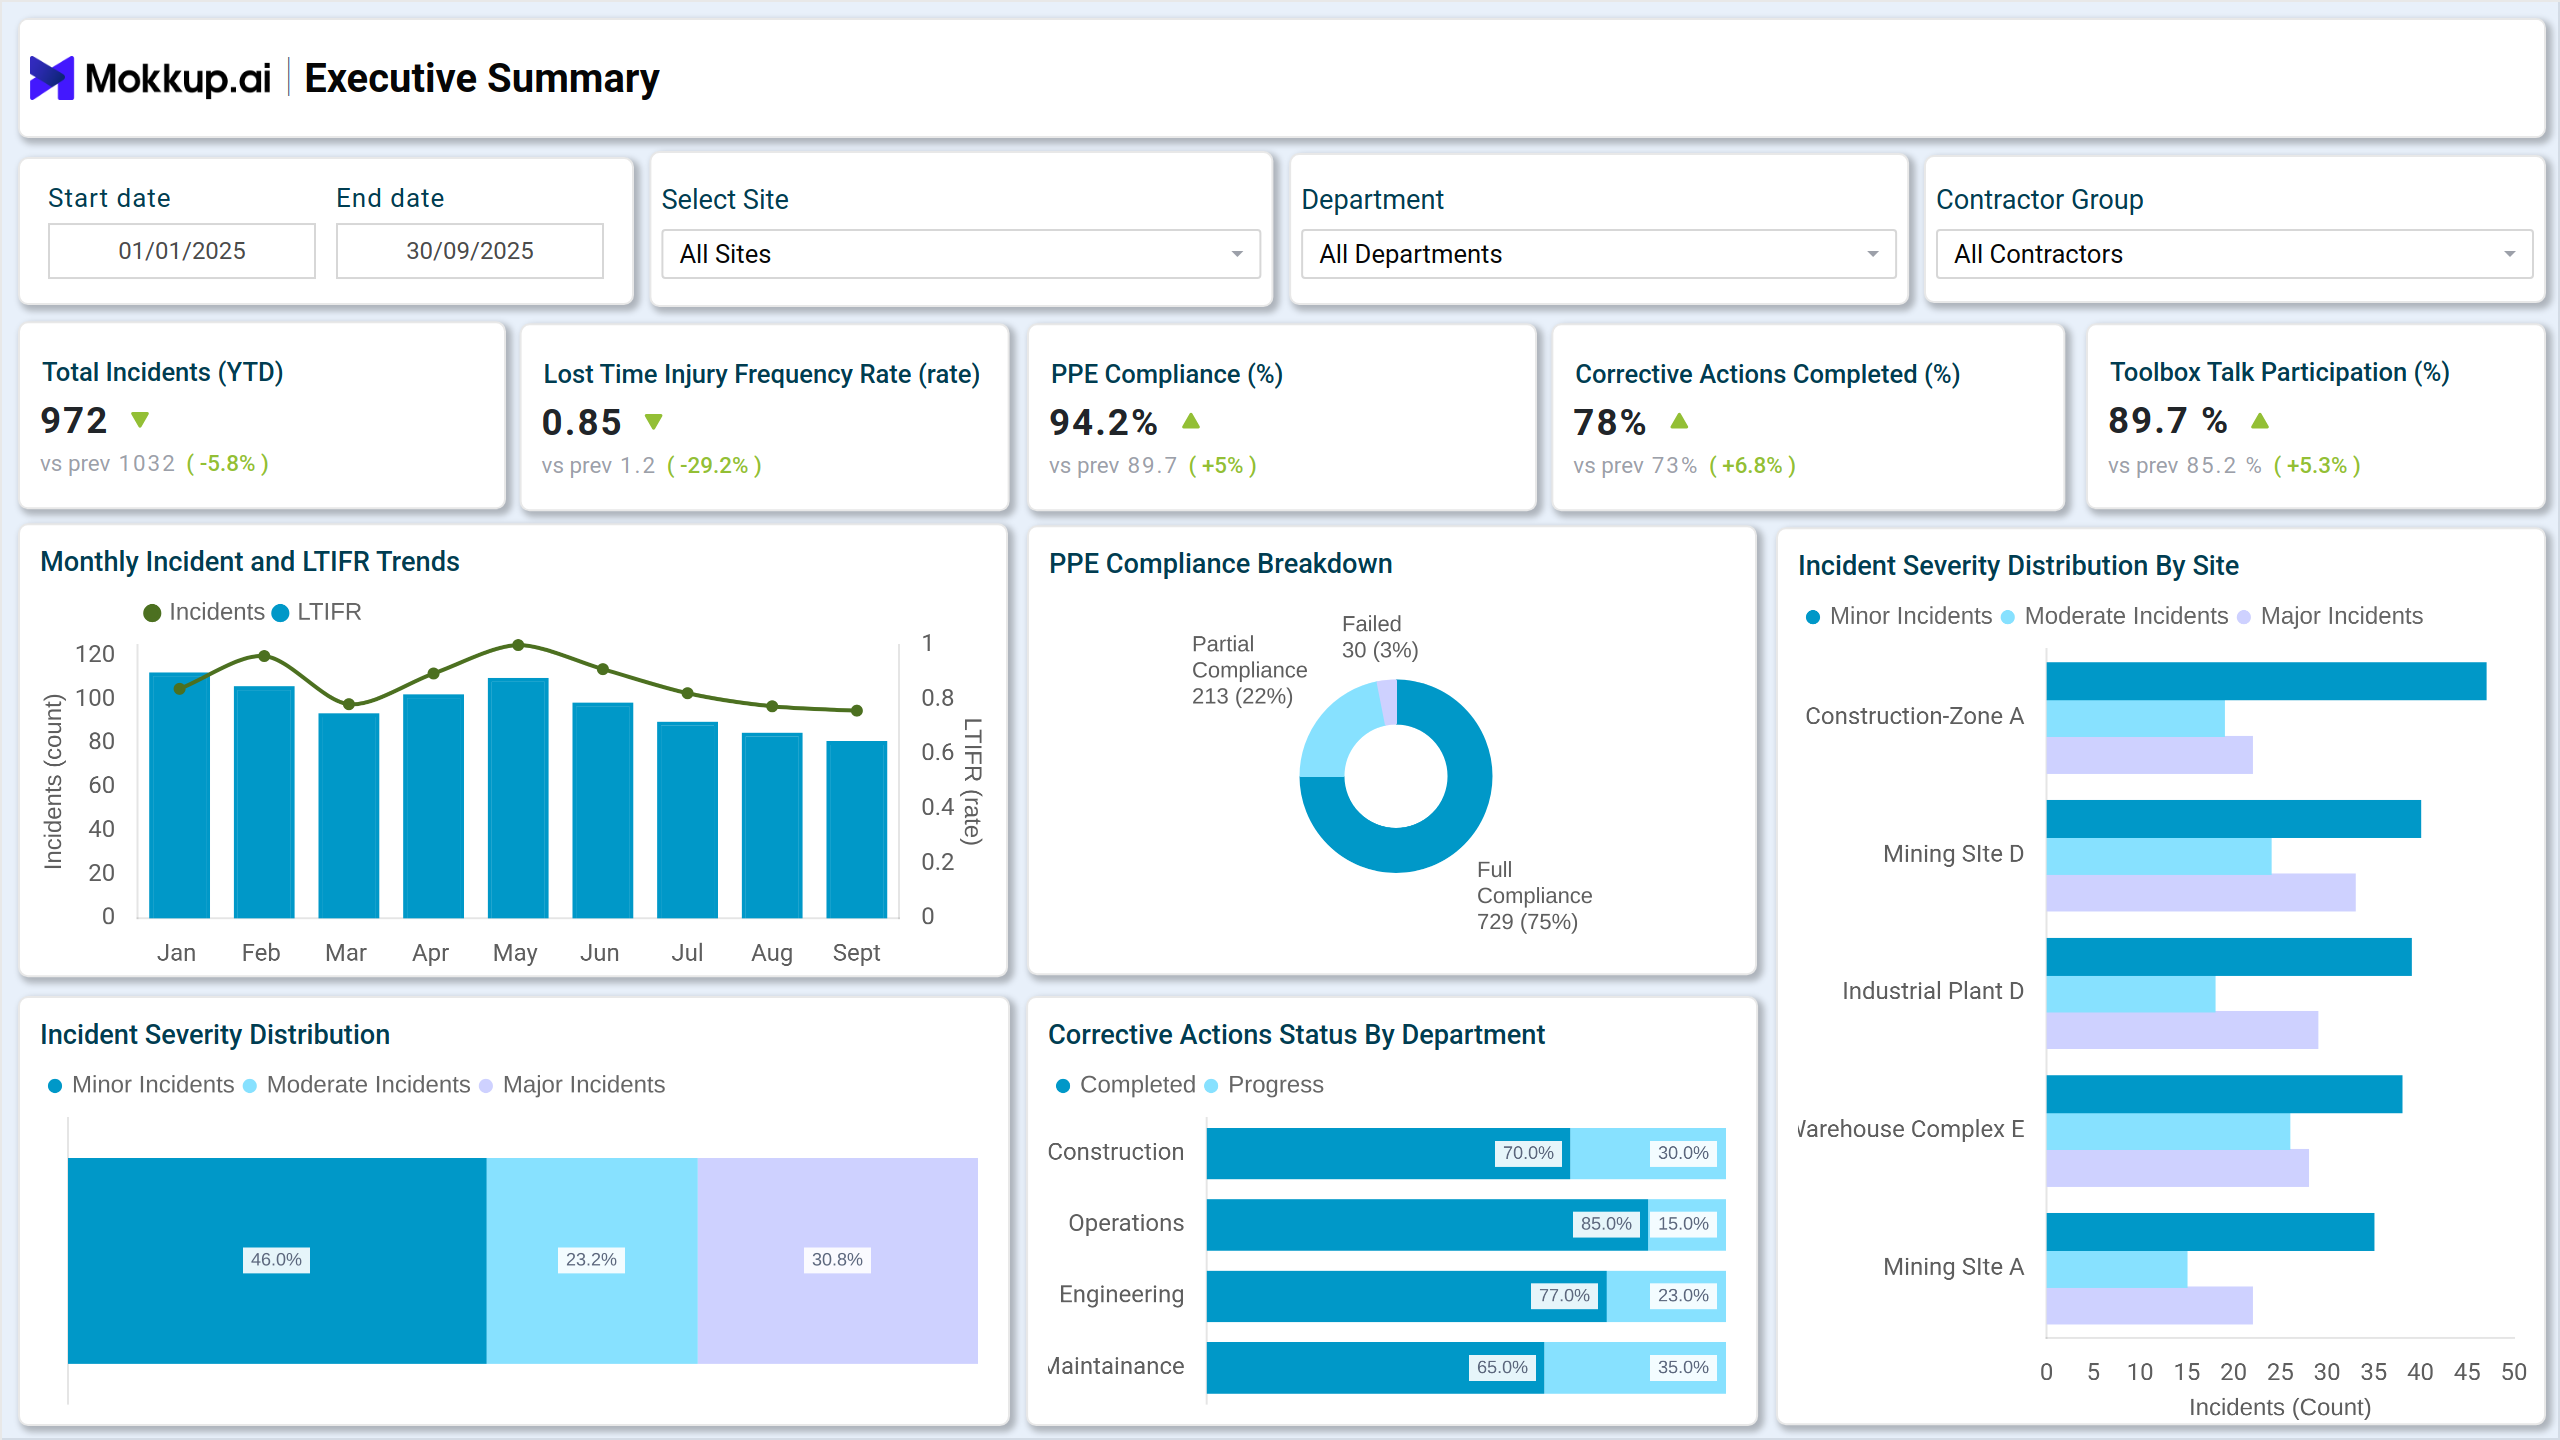
What is a Site Safety Dashboard?
A site safety dashboard is a real-time site safety monitoring tool that consolidates incidents, near misses, PPE compliance, inspections, and workforce participation into one view. It provides data visualization for performance, making trends easier to interpret than static reports. Similar to a dashboard for tracking workplace safety in schools or construction sites, it uses charts, KPIs, and benchmarks to guide decisions with both high-level insights and detailed drill-downs across departments and contractors.
How to Create a Site Safety Dashboard
You don’t need to build your report from scratch—just start with a ready-to-use Site Safety dashboard templates from Mokkup. Add in your data and export it however you like. Here’s how to do it:
1. Create or Log in to Your Mokkup Account
Start by signing up on Mokkup.ai using your email. If you already have an account, just log in, and you’ll be good to go.
2. Choose and Customize Your Dashboard Template
Find the Site Safety Dashboard template in the Templates section. Use the drag-and-drop editor to adjust KPIs, edit filters, or add elements based on your data.
3. Export to Your BI Tool
Once your dashboard wireframe is ready, use the BI Tool Export feature to send it directly to Power BI or Tableau for further analysis and enhancements. You can also download the dashboard as a PDF, PNG, or JPEG, embed it on a platform, or invite your team to collaborate.
Note: This is a Pro template. You’ll need a Pro subscription on Mokkup to use and customize this dashboard wireframe. Upgrade anytime to unlock full access.
Site Safety Dashboard Example
Create your personalized Site Safety KPI dashboard, bringing all of your key metrics into one structured view. The Mokkup Site Safety Dashboard wireframe includes visualizations such as Total Incidents, LTIFR (Lost Time Injury Frequency Rate), PPE Compliance, Corrective Actions Completed, Incident Severity Breakdown, and Heatmaps for Incident Hotspots. Once the data is added, this dashboard can be exported to BI tools like Power BI or Tableau for deeper analysis, making it a practical solution for safety managers looking to strengthen compliance, improve engagement, and reduce workplace risks.
How to Analyze Data in Site Safety Dashboards
When working with a site safety dashboard, focus on these analysis steps:
- Compare KPIs such as incidents, PPE compliance, and LTIFR against targets.
- Identify departments or sites with higher incident severity.
- Track monthly trends to spot recurring problem areas.
- Use heatmaps to evaluate shifts or days with higher incident frequency.
- Monitor corrective actions to confirm issues are resolved.
- Review workforce participation in toolbox talks and inspections.
- Use filters (site, contractor, department) for more targeted analysis.
Benefits of Site Safety Dashboards
A Site Safety Dashboard provides several advantages for construction managers and safety teams:
- Centralized Oversight: View all safety data in one place for easier decision-making.
- Real-Time Monitoring: Track incidents, compliance, and safety conditions as they happen.
- Risk Detection: Identify potential hazards and emerging hotspots early.
- Workforce Engagement: Measure and encourage participation in safety programs.
- Clear Communication: Use visual breakdowns to present safety performance to executives.
- Smarter Resource Use: Allocate inspections, training, and equipment more effectively.
- Accountability: Monitor corrective actions consistently to ensure follow-through.
Overall, this dashboard strengthens site safety management and builds a more engaged, responsible workforce.
KPIs to Track in Site Safety Dashboards
Key performance indicators include:
- Total Incidents (YTD): Count of reported incidents and near misses.
- Lost Time Injury Frequency Rate (LTIFR): Measure of injury severity.
- PPE Compliance %: Compliance with safety gear standards.
- Safety Inspections Completed %:Planned vs. completed inspections.
- Toolbox Talk Participation %: Engagement in safety discussions.
- Incident Severity Distribution: Breakdown of minor, moderate, and major incidents.
- Incident Reporting Lag Time: Speed of reporting after an event.
- Average Time Between Incidents: Leading metric for incident prevention.
- Corrective Actions Completed %: Measures follow-through on safety improvements.
Frequently Asked Questions
1. What is the purpose of a site safety dashboard?
It helps organizations monitor incidents, compliance, and workforce engagement in real time. This ensures proactive risk management and compliance with safety standards.
2. How does a site safety dashboard compare to a dashboard for monitoring student performance?
Both use data visualization for performance tracking. In education, dashboards show grades and progress, while in safety, they show incidents and compliance. The principle is the same: simplify data for better decisions.
3. How to monitor safety compliance online with a dashboard?
A safety incident reporting dashboard integrates PPE compliance, inspections, and incident tracking in real time, allowing safety teams to act quickly.