The Logistics Safety Analytics Dashboard template encompasses various safety metrics such as OHS audits, safety landing, and quality leading, among others, to ensure comprehensive monitoring and improvement of safety standards within logistics operations.
Safety Analytics - Screen 1
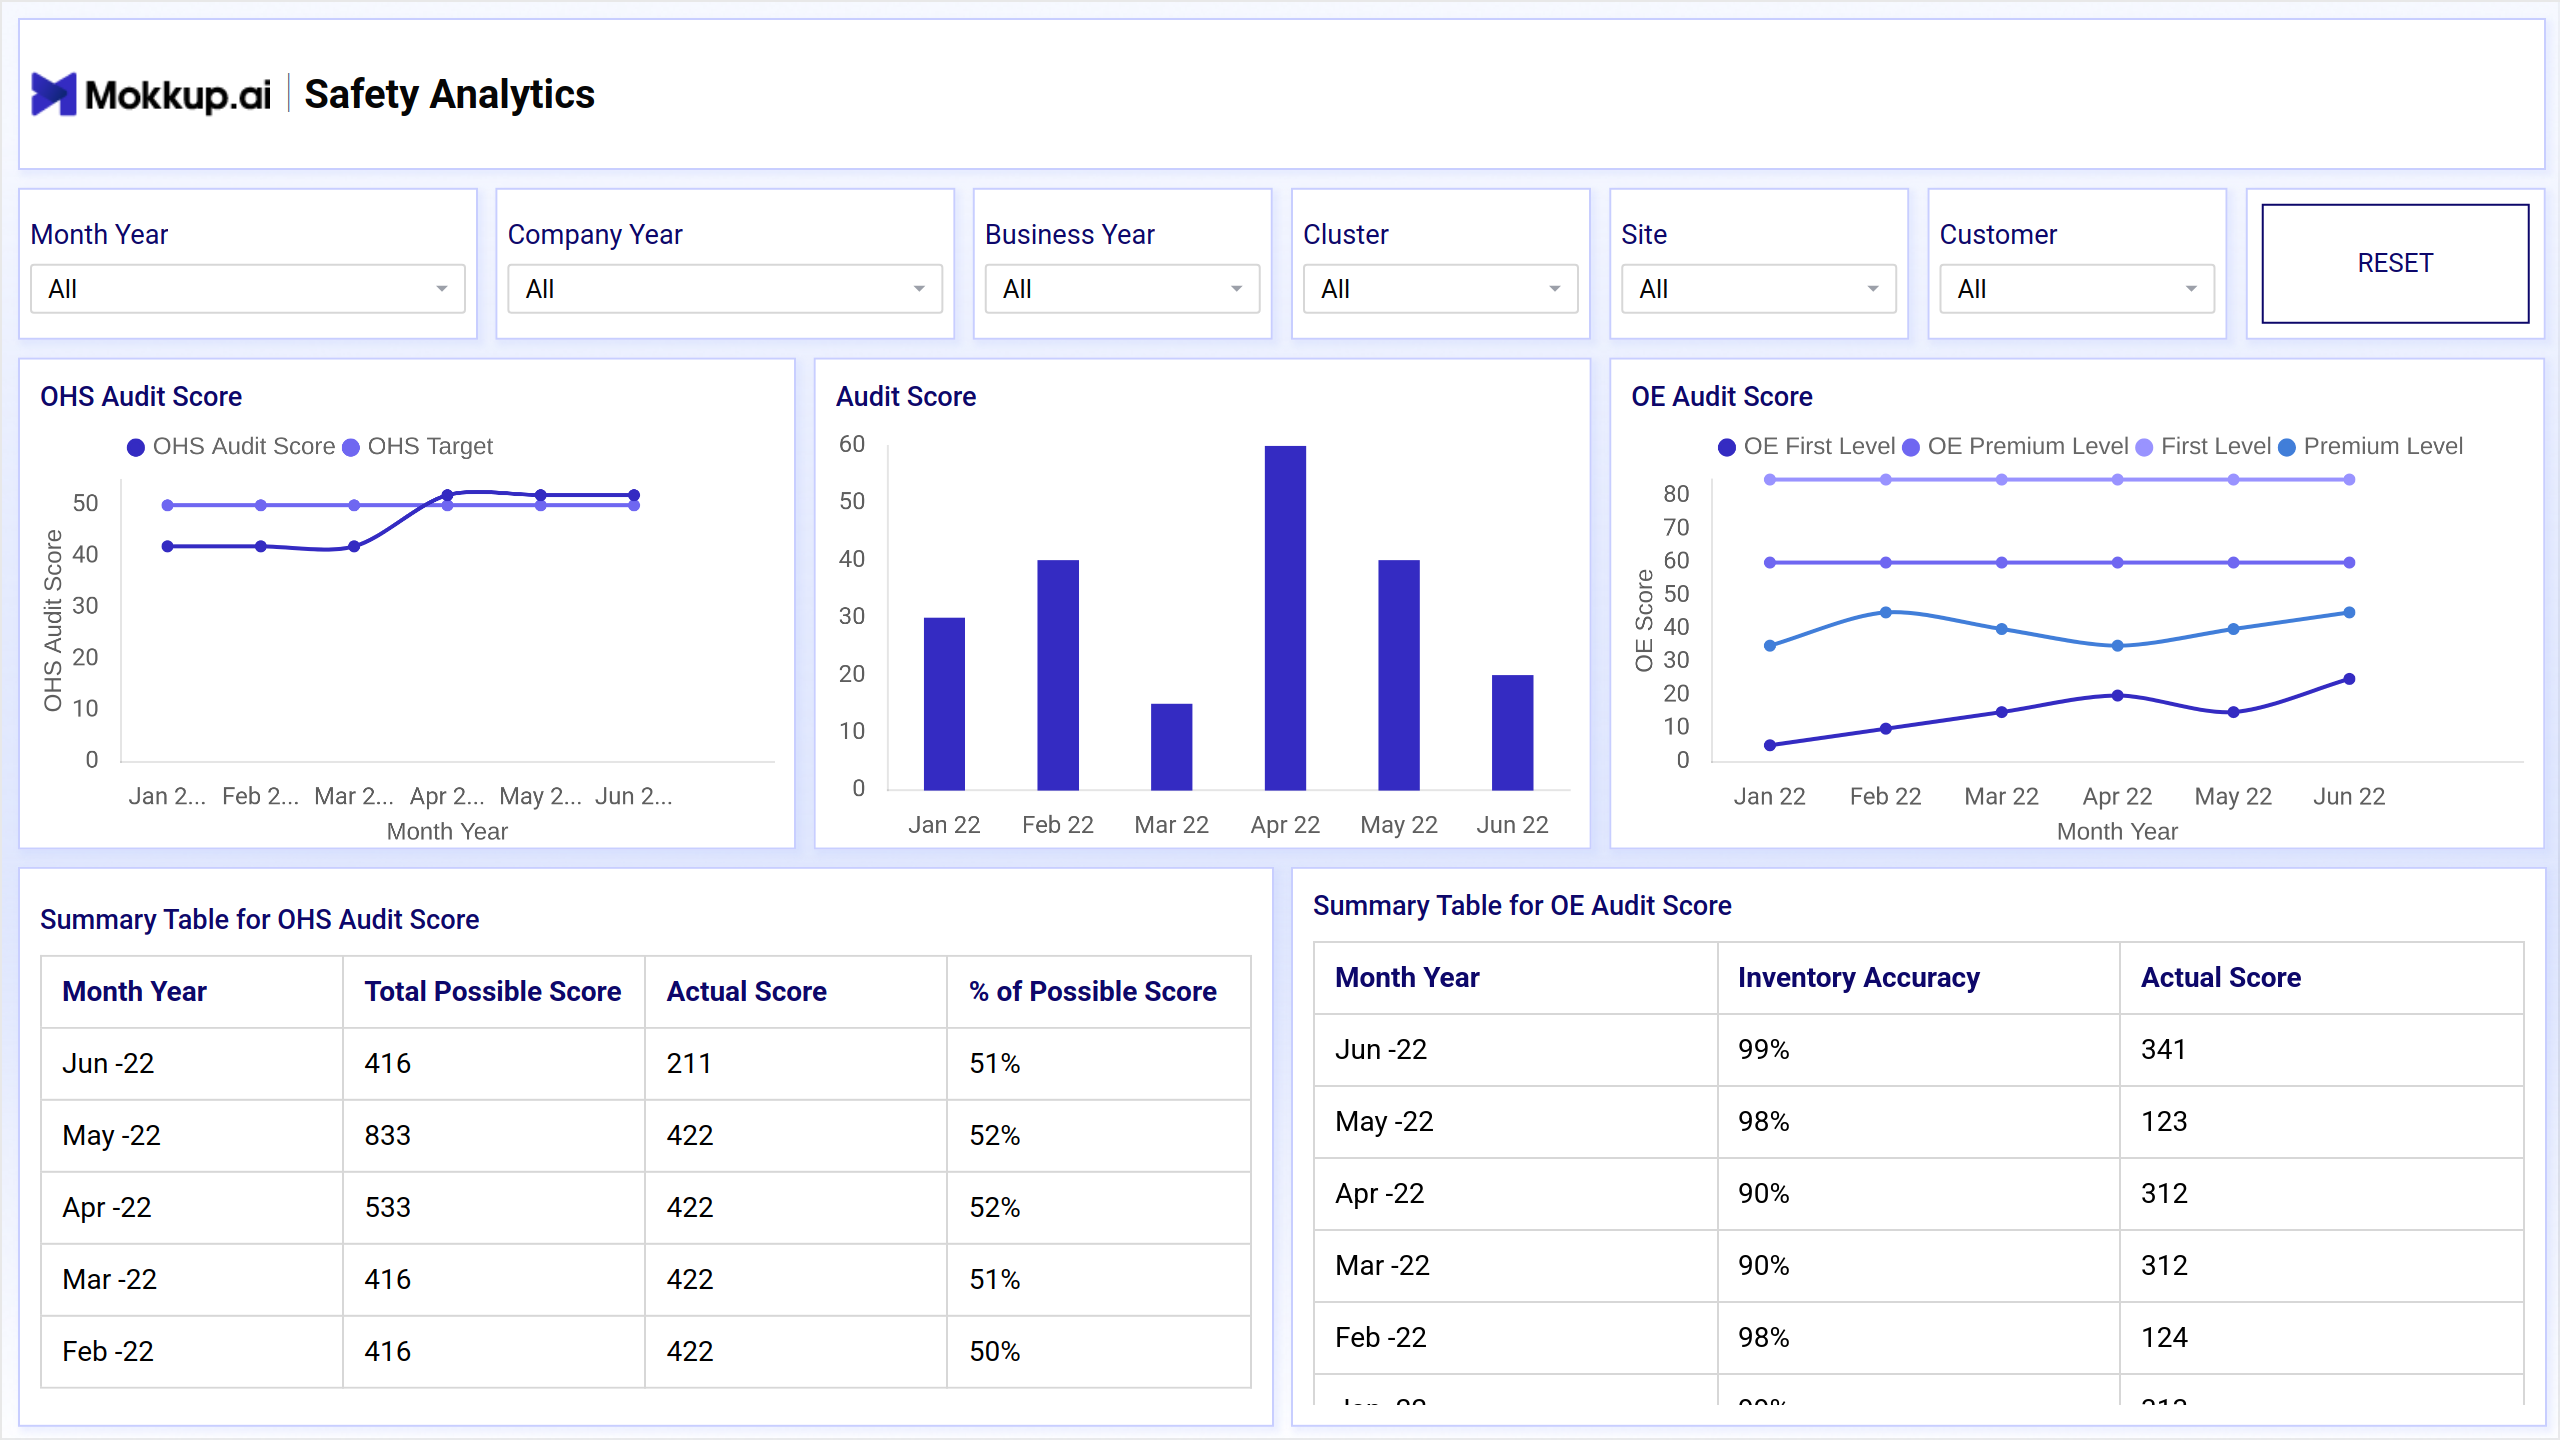
Screen 1 offers a snapshot of key safety metrics including audit score, OHS(Occupational Health and Safety), and OE (Operational Excellence) audit scores.
Key Terms to Know
- OHS audit score: It assesses factors such as workplace safety protocols, employee training, hazard identification, and compliance with regulatory requirements,comparing them to predefined OHS targets for benchmarking and continuous improvement.
- Audit score: It may encompass various aspects such as operational efficiency, quality management, compliance with standard operating procedures, and adherence to industry best practices.
- OE audit score: It assesses factors such as process optimization, resource utilization, productivity levels, and alignment with organizational goals.
- Summary table for OHS audit score: This table provides a consolidated view of the OHS audit score, including the total possible score, the actual score obtained, and the percentage achieved.
- Summary table for OE audit score: This table presents key metrics related to the OE audit score, such as inventory accuracy and the actual score achieved.
Safety Analytics - Screen 2
The Screen 2 of the dashboard wireframe provides insights into safety landing and quality leading, focusing on identifying areas for improvement and ensuring adherence to safety protocols and quality standards throughout operations.
Key Terms to Know
- Safety Landing: This metric assesses the effectiveness of safety measures implemented to prevent accidents or incidents within the workplace.
- Quality Leading: Quality leading indicators gauge the effectiveness of processes and systems in place to maintain product or service quality standards.
- Summary Table for Safety Leading Indicator: This table provides a comprehensive overview of safety performance, including the total possible score, actual score achieved, and the percentage of the maximum achievable score.
- Summary Table for Quality Leading Indicator: This table summarizes the quality performance metrics, displaying the quantity-based outcome (QBO) reported, the cumulative sum of QBO recorded, and the cumulative targeted QBO, enabling assessment of quality management effectiveness and progress toward quality goals.
Safety Analytics - Screen 3
Screen 3 offers crucial insights into various operational metrics, including truck and dock turnaround times, time lag analysis, and transportation deduction amounts.
Key Terms to Know
- Truck Turnaround Time: This metric measures the duration it takes for trucks to complete their turnaround process, including loading, unloading, and any other required tasks, aiming to optimize logistics efficiency and minimize wait times.
- Dock Turnaround Time: Dock turnaround time evaluates the efficiency of dock operations by assessing the time it takes for goods to move in and out of loading docks.
- Time Lag: Time lag refers to the delay or gap between planned and actual delivery times, highlighting potential inefficiencies in transportation scheduling and execution, and enabling corrective actions to improve delivery performance.
- Transportation Deduction Amount: This metric quantifies deductions or penalties incurred due to transportation-related issues such as delays, damages, or non-compliance with contractual terms, providing insights into transportation cost management and supplier performance.
These metrics are essential for evaluating transportation and logistics efficiency and identifying areas for improvement to enhance overall operational performance.
Dashboard Template Insights
The dashboard wireframe offers a holistic view of safety performance, including OHS audit scores, safety landing, and quality leading indicators, enabling organizations to assess workplace safety comprehensively.
- Metrics such as truck and dock turnaround times provide valuable insights into operational efficiency, helping organizations streamline logistics processes and improve resource utilization.
- The dashboard wireframe facilitates compliance monitoring by tracking safety audit scores and regulatory requirements, ensuring adherence to safety standards and regulations.
- Analyzing safety metrics helps in identifying areas of improvement, enabling organizations to implement targeted safety initiatives and drive continuous improvement in safety performance.
Conclusion
The Safety Analytics Dashboard template empowers organizations to prioritize workplace safety, enhance operational efficiency, and drive continuous improvement in safety performance.