
What is a Secondary Schools Parent Engagement Dashboard
The Secondary Schools Parent Engagement Dashboard is a single-screen wireframe template built for administrators, communications teams, and school leadership who need one consolidated view of how families interact with the school. Rather than pulling numbers from separate parent portal logs, messaging platforms, and attendance sheets, this secondary school parent engagement dashboard brings conference turnout, portal activity, message response, and satisfaction data into one workspace. It is designed for teams that want to move past assumptions about parent involvement and instead track engagement with defined, comparable metrics across grade levels, campuses, and communication channels.
Because the layout is filterable by date range, grade level, communication channel, and school campus, the same secondary school parent engagement dashboard can support a district-wide review or a single-campus deep dive without rebuilding the report. For schools running parent satisfaction score monitoring for secondary schools, having every signal in one screen removes the guesswork from deciding where outreach needs to improve.
How to Create a Secondary Schools Parent Engagement Dashboard
You don't need to build your report from scratch; just start with a ready-to-use dashboard template from Mokkup. Add in your data and export it however you like. Here's how to do it:
1. Create or Log in to Your Mokkup Account
Start by signing up on Mokkup.ai using your email. If you already have an account, just log in, and you'll be good to go.
2. Choose and Customize Your Dashboard Template
Find the Secondary Schools Parent Engagement Dashboard template in the Templates section. Use the drag-and-drop editor to adjust KPIs, edit filters, or add elements based on your data.
3. Export to Your BI Tool
Once your dashboard wireframe is ready, use the BI Tool Export feature to send it directly to Power BI or Tableau for further analysis and enhancements. You can also download the dashboard as a PDF, PNG, or JPEG, embed it on a platform, or invite your team to collaborate.
Note: This is a Pro template. You'll need a Pro subscription on Mokkup to use and customize this dashboard wireframe. Upgrade anytime to unlock full access.
Secondary Schools Parent Engagement Dashboard Example
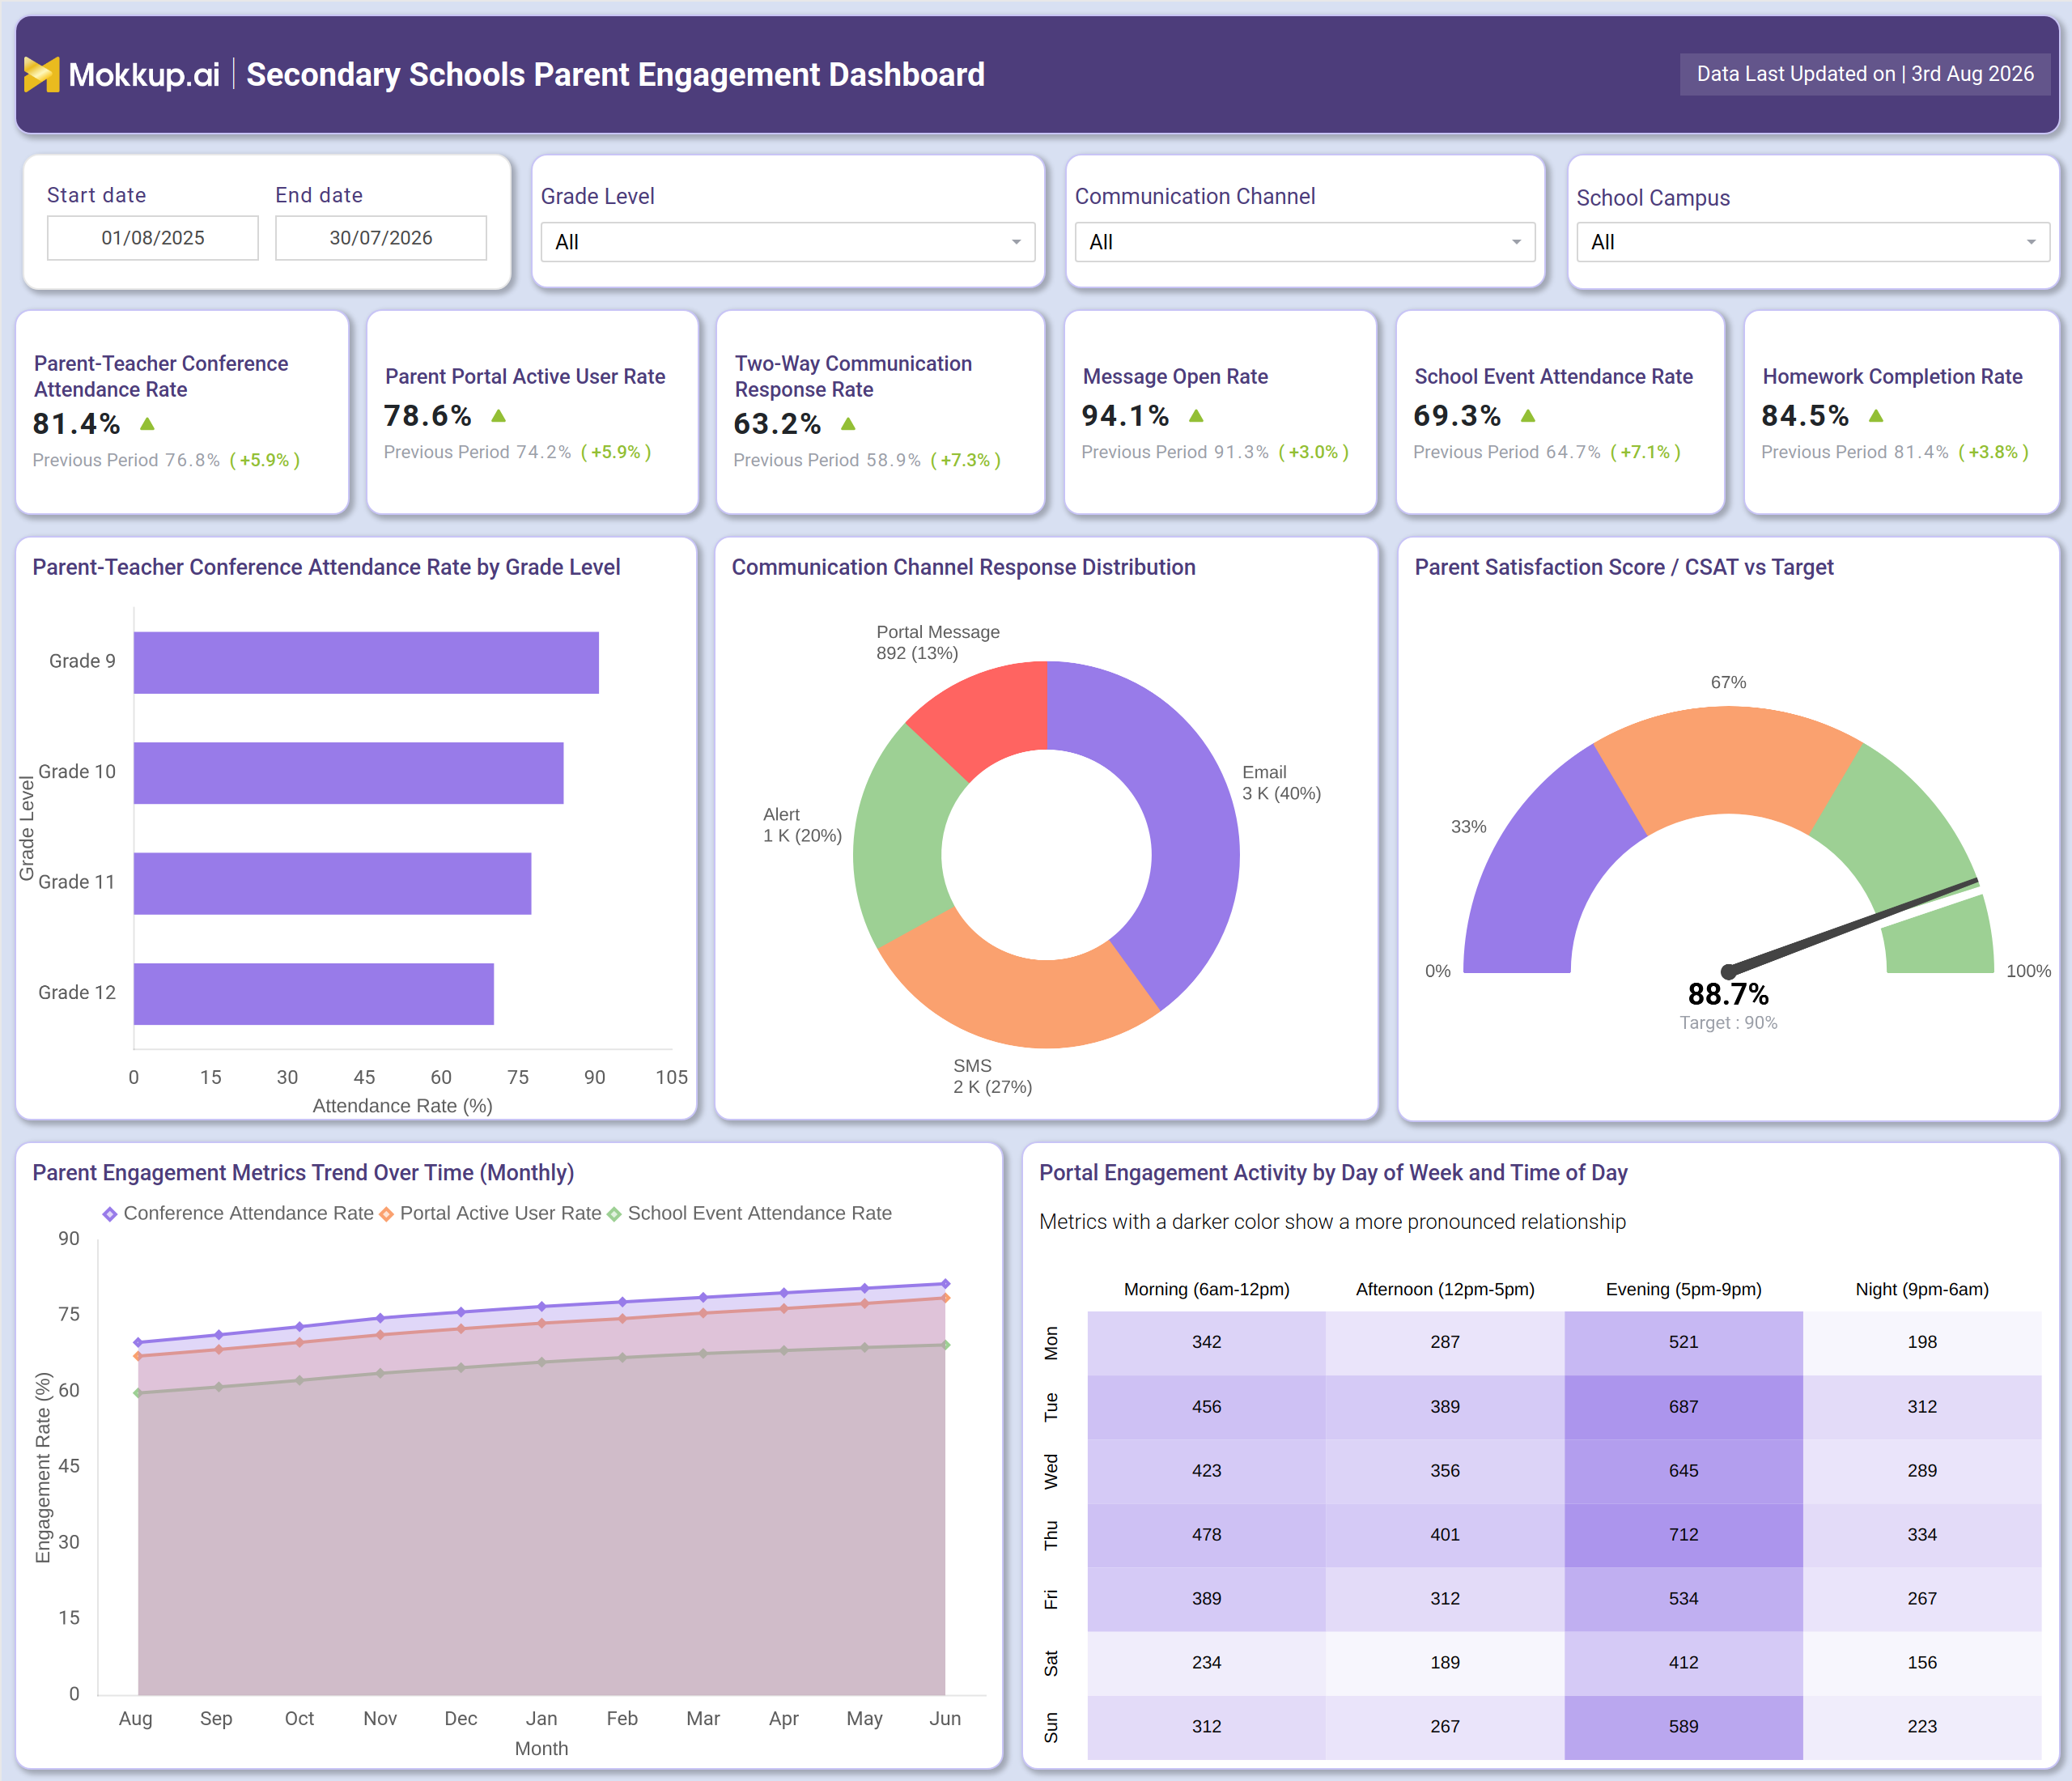
A secondary school administrator or family engagement coordinator typically opens this dashboard before a leadership meeting to answer a simple question: are parents actually engaging with what the school sends them, or is communication going unread and events going unattended? They start by narrowing the view to a grade level, campus, or communication channel, depending on what prompted the review. From there, the coordinator can compare conference turnout across grade levels to see whether older students' families are pulling back from in-person engagement, a pattern common in secondary schools, and can use the parent portal active user rate monitoring dashboard view to check whether portal adoption is keeping pace with outreach volume.
Reviewing the two-way communication response rate analysis for schools helps the team judge whether families are simply receiving messages or actually responding to them, which matters more for flagging disengaged households than open rates alone. If a grade or campus shows an attendance dip in the trend view, the team can drill into that segment before adjusting outreach rather than sending a blanket reminder to every family. The channel mix view lets the team judge whether email, SMS, alerts, or portal messages carry most of the response volume, so staff can shift communications toward whichever channel parents actually engage with. The day-of-week view then helps the team schedule reminders so they land when parents are most likely to open them.
Taken together, the dashboard helps school leadership move from a general sense that parents seem disengaged to a specific plan: which grade levels need a different channel, which campuses need a targeted reminder, and where satisfaction is trending below target before it affects enrollment conversations.
How to Analyze Data in a Secondary Schools Parent Engagement Dashboard
Here is how you can analyze data from this dashboard:
- Compare engagement by grade: Filter by Grade Level to analyze parent-teacher conference attendance across Grades 9 through 12.
- Track engagement over time: Set the Start Date and End Date to compare parent engagement trends across different terms.
- Analyze campus performance: Use the School Campus filter to evaluate outreach performance for an individual location.
- Evaluate communication channels: Switch the Communication Channel filter to compare engagement across Email, SMS, Alerts, and Portal Messages.
- Monitor participation trends: Review the monthly trend chart to determine whether conference attendance and parent portal activity move together.
- Optimize outreach timing: Cross-reference the day-of-week heatmap with the outreach calendar to identify the best times to send parent communications.
Benefits of a Secondary Schools Parent Engagement Dashboard
The following are the benefits of using this dashboard:
- Centralize engagement data: Replace scattered portal logs and attendance sheets with a single school event attendance dashboard.
- Improve outreach strategies: Identify grade levels that need different communication approaches before conference attendance declines.
- Evaluate communication channels: Give communications teams a unified view of channel performance instead of comparing separate platform reports.
- Support outreach decisions: Use engagement data to justify communication efforts with measurable evidence.
- Accelerate leadership reporting: Compare campus, grade, and communication channel performance without manual data consolidation.
- Simplify onboarding: Give new communications staff a single dashboard with all key parent engagement metrics in one place.
KPIs to Track in a Secondary Schools Parent Engagement Dashboard
Key Performance Indicators (KPIs) are the measurable values a team tracks to judge whether performance is improving or slipping against a goal.
- Parent-Teacher Conference Attendance Rate - measures the share of scheduled conferences parents actually attend, the core metric behind any parent-teacher conference attendance rate tracking tool.
- Parent Portal Active User Rate - tracks what portion of registered parent accounts log in and use the portal, the figure this parent portal active user rate monitoring dashboard is built around.
- Two-Way Communication Response Rate - captures how often parents reply to outreach rather than only receiving it, the basis for any two-way communication response rate analysis for schools.
- Message Open Rate - shows what percentage of sent communications are opened, an early indicator of whether outreach content is reaching families at all.
- School Event Attendance Rate - measures parent turnout at school-hosted events, the metric this school event attendance rate tracking dashboard uses to gauge community involvement.
- Homework Completion Rate - tracks the share of assigned homework submitted on time, linking family engagement to academic follow-through at home.
Frequently Asked Questions
1. What does a secondary school parent engagement dashboard track?
It tracks conference attendance, portal activity, message response, event turnout, homework completion, and parent satisfaction in one filterable view, letting schools compare engagement across grade levels, campuses, and communication channels.
2. How is parent satisfaction measured on this dashboard?
Parent satisfaction appears as a CSAT score benchmarked against a defined target, letting leadership see at a glance whether sentiment is on track. This supports ongoing parent satisfaction score monitoring for secondary schools without waiting for an annual survey.
3. Can I customize this dashboard template for my school?
Yes. The template is fully editable in Mokkup's drag-and-drop editor, so you can adjust KPIs, filters, and charts before exporting to Power BI, Tableau, PDF, PNG, or JPEG.