
What is a Secondary Schools Laboratory Management Dashboard?
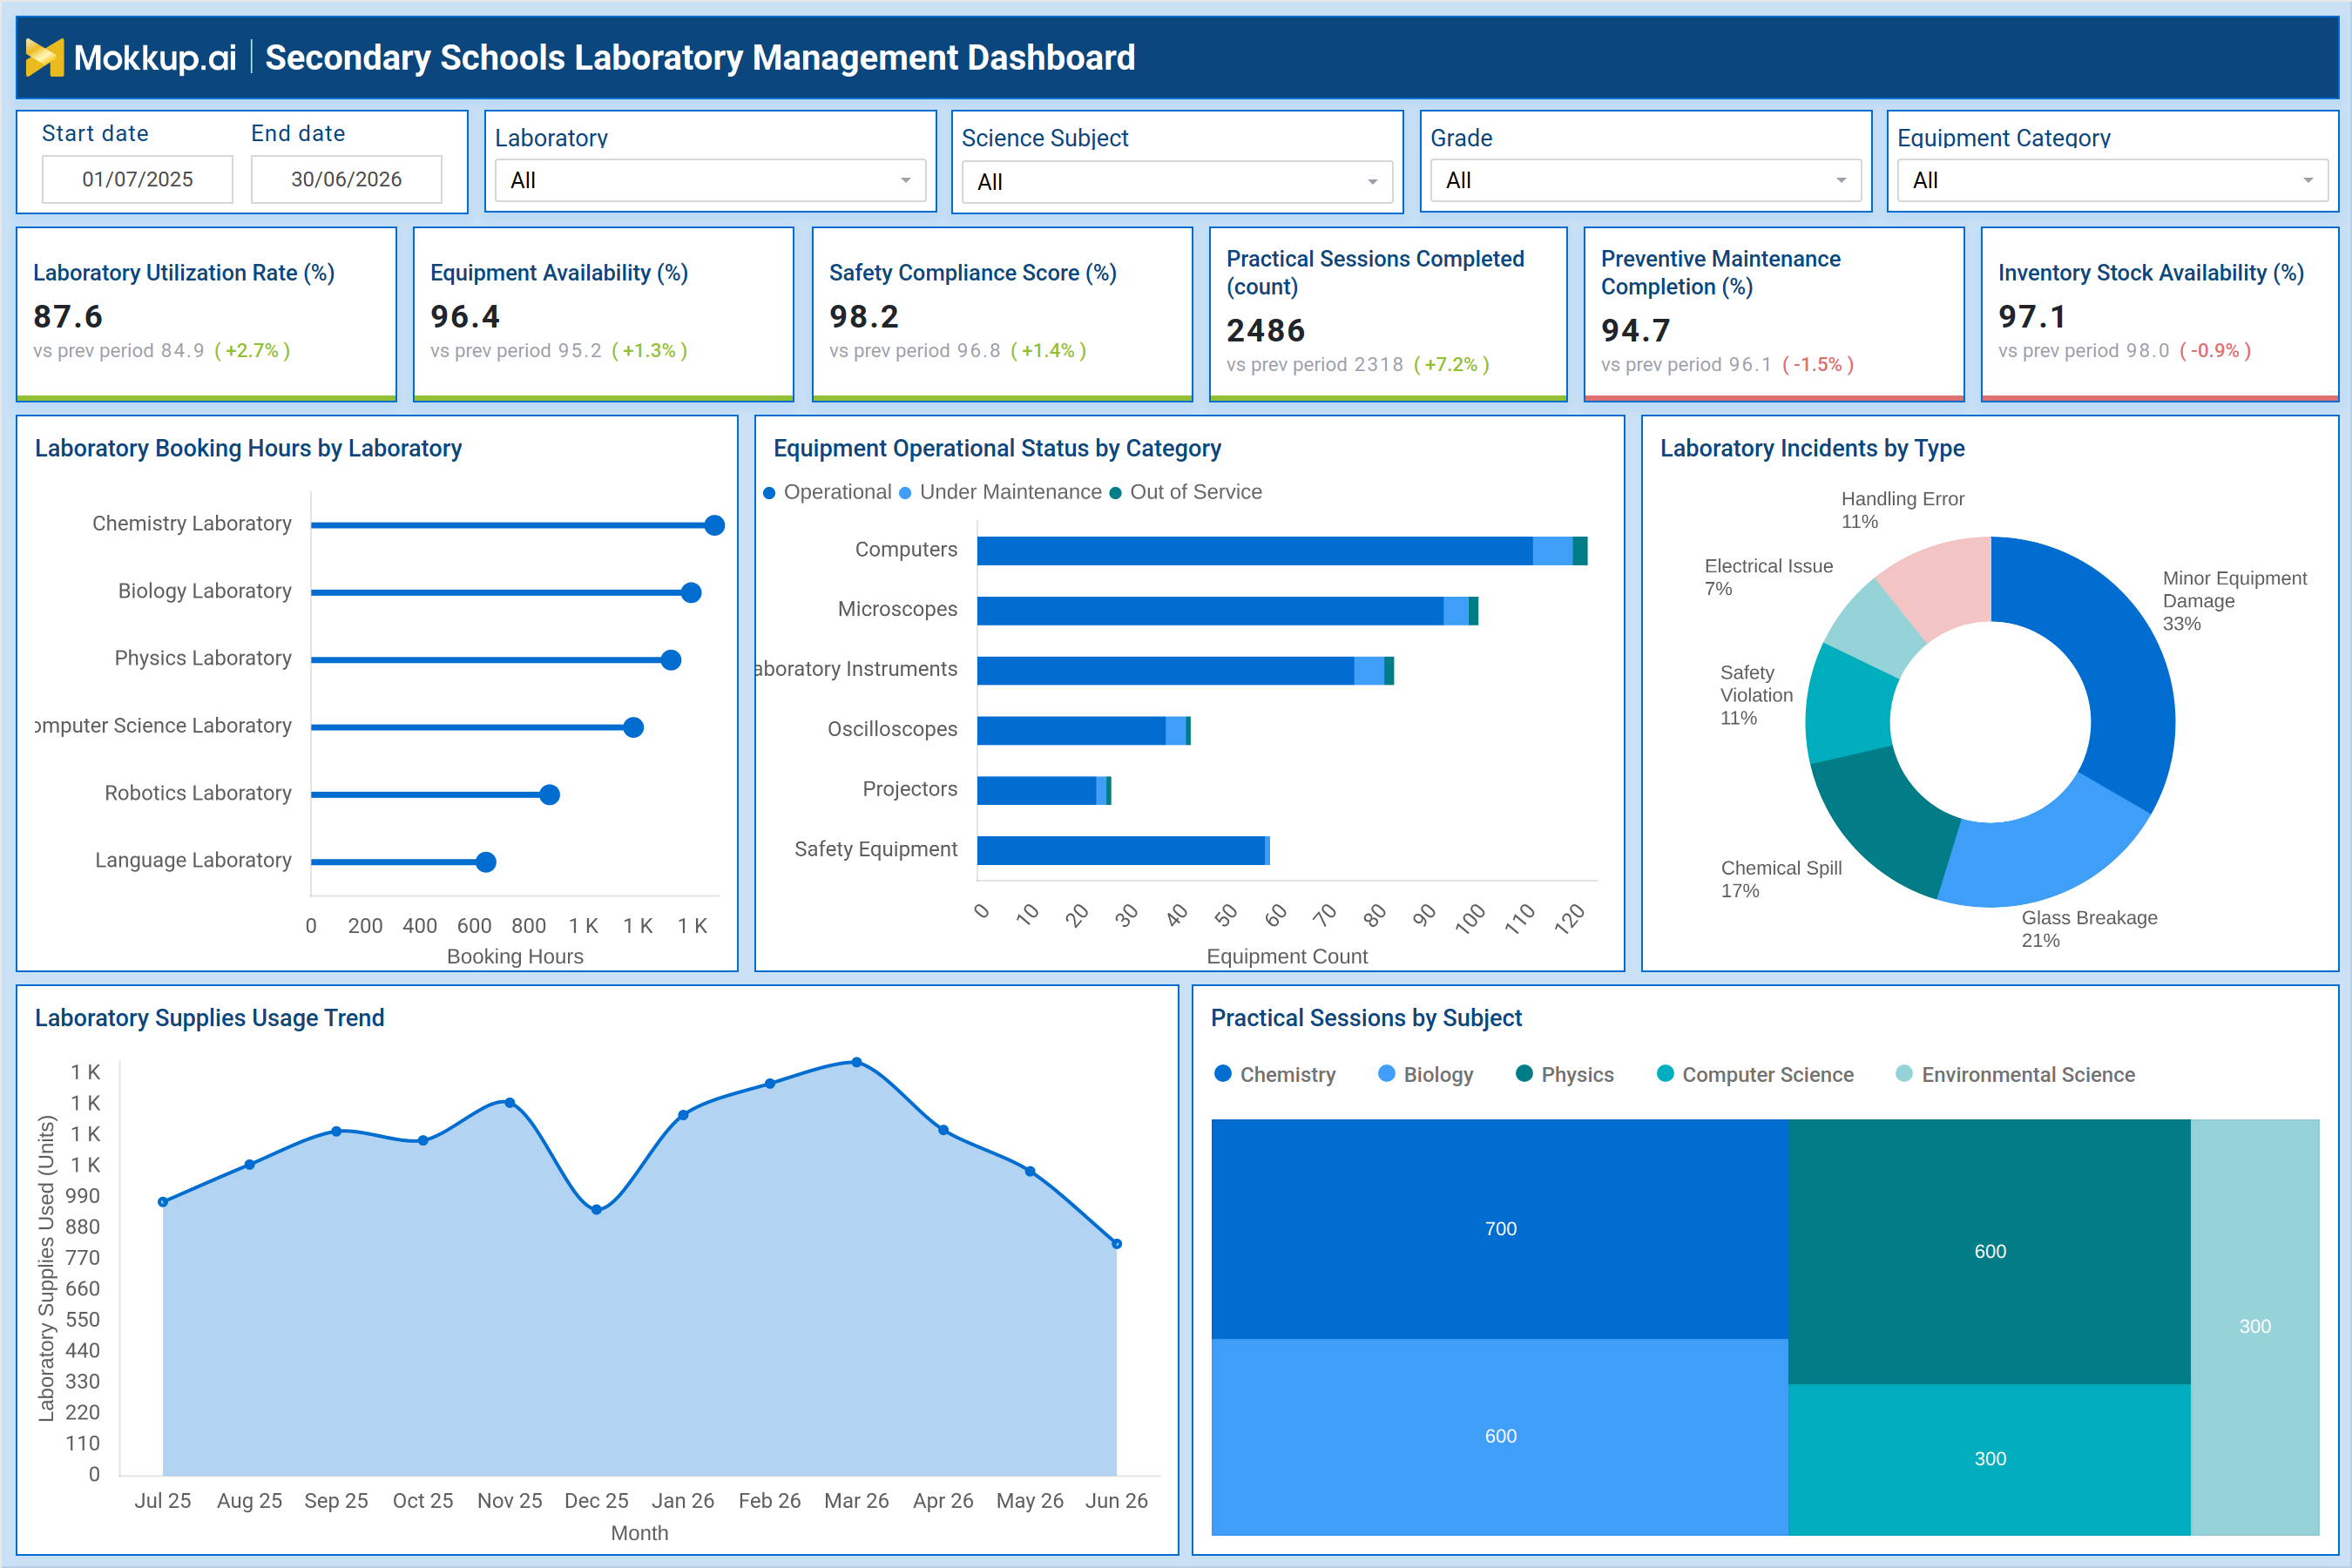
The Secondary Schools Laboratory Management Dashboard is a wireframe template built for school administrators, lab coordinators, and science department heads who need a single view into how laboratories are being used across a term or academic year. It brings together laboratory utilization tracking for secondary schools, equipment condition, safety compliance, and supply consumption in one layout, removing the need to check separate registers for bookings, maintenance logs, and inventory sheets. Filters for date range, laboratory, science subject, grade, and equipment category let a coordinator narrow the view down to a specific lab or subject before reviewing trends. Because it is a template, schools can adapt the layout to match their own lab structure, subject list, and grade bands without starting the design process from a blank page. Administrators who need ongoing laboratory utilization tracking for secondary schools can rely on this single layout instead of switching between multiple spreadsheets.
How to Create a Secondary Schools Laboratory Management Dashboard
You don't need to build your report from scratch; just start with a ready-to-use dashboard template from Mokkup. Add in your data and export it however you like. Here's how to do it:
1. Create or Log in to Your Mokkup Account
Start by signing up on Mokkup.ai using your email. If you already have an account, just log in, and you'll be good to go.
2. Choose and Customize Your Dashboard Template
Find the Secondary Schools Laboratory Management Dashboard template in the Templates section. Use the drag-and-drop editor to adjust KPIs, edit filters, or add elements based on your data.
3. Export to Your BI Tool
Once your dashboard wireframe is ready, use the BI Tool Export feature to send it directly to Power BI or Tableau for further analysis and enhancements. You can also download the dashboard as a PDF, PNG, or JPEG, embed it on a platform, or invite your team to collaborate.
Note: This is a Pro template. You'll need a Pro subscription on Mokkup to use and customize this dashboard wireframe. Upgrade anytime to unlock full access.
Secondary Schools Laboratory Management Dashboard Example
A science department head typically opens this dashboard at the start of a term to understand how laboratory space is being distributed across subjects and grades, and whether any lab is being underused while another is overbooked. Filtering by laboratory or science subject narrows the view to a single space, making it easier to compare booking patterns between the chemistry, biology, physics, computer science, robotics, and language laboratories without digging through separate scheduling sheets. On the equipment side, coordinators can review which categories of equipment are operational versus under maintenance or out of service, then prioritize repairs for the categories that carry the highest impact on practical sessions. This same view supports school laboratory equipment availability monitoring, so a lab manager can decide whether to reallocate instruments between laboratories or escalate a purchase request before a shortage disrupts scheduled practicals.
Reviewing incident types alongside equipment status also supports school lab incident analysis by equipment type, helping safety officers identify whether damage, spills, or handling errors are clustering around a particular category of equipment, which points to a training gap rather than an equipment fault. Coordinators also use the dashboard to track how laboratory supply usage moves across months, comparing consumption against the volume of practical sessions delivered by subject, which supports lab safety compliance tracking for schools and keeps procurement aligned with actual demand instead of guesswork. Taken together, the dashboard helps school leadership keep laboratories running safely, keep equipment available when it is needed, and plan supply and maintenance budgets around how labs are actually being used rather than assumptions made at the start of the year. Repeating this review each term keeps laboratory inventory stock management for schools aligned with actual classroom demand and supports practical session tracking in school laboratories across every subject.
How to Analyze Data in a Secondary Schools Laboratory Management Dashboard
Here is how you can analyze data from this dashboard:
- Filter by laboratory and date range to support laboratory utilization tracking for secondary schools across every lab.
- Cross-check equipment operational status against incident type to spot categories prone to repeated damage.
- Track practical sessions completed against the grade and subject filters to confirm curriculum coverage.
- Review the laboratory supplies usage trend by month to anticipate reorder timing before stock runs low.
- Compare safety compliance score alongside incident type as part of ongoing lab safety compliance tracking for schools.
- Use the equipment category filter to isolate maintenance backlogs for a single instrument group at a time.
Benefits of a Secondary Schools Laboratory Management Dashboard
The following are the benefits of using this dashboard:
- Centralizes booking, equipment, safety, and inventory data into a single view for lab coordinators.
- Supports school laboratory equipment availability monitoring so repairs get prioritized before sessions are affected.
- Makes practical session tracking in school laboratories straightforward across subjects and grades.
- Highlights recurring incident types early, reducing repeat safety issues in specific laboratories.
- Improves laboratory inventory stock management for schools by linking usage trends to reorder timing.
- Reduces reliance on manual registers by consolidating lab operations reporting in one wireframe.
- Speeds up budget and maintenance planning with a clear view of equipment condition by category.
- Gives procurement teams an added checkpoint for laboratory inventory stock management for schools before shortages occur.
KPIs to Track in a Secondary Schools Laboratory Management Dashboard
The following key KPIs can be tracked by using this dashboard:
- Laboratory Utilization Rate (%) - measures how much of the available lab time is actually booked and used for sessions.
- Equipment Availability (%) - tracks the proportion of lab equipment that is operational and ready for use.
- Safety Compliance Score (%) - reflects how well laboratories are adhering to established safety protocols.
- Practical Sessions Completed (count) - counts the number of hands-on sessions delivered across subjects and grades.
- Preventive Maintenance Completion (%) - shows how much of the scheduled preventive maintenance work has been carried out.
- Inventory Stock Availability (%) - indicates whether lab consumables and supplies are stocked at required levels.
Frequently Asked Questions
1. Who should use the Secondary Schools Laboratory Management Dashboard?
Science department heads, lab coordinators, and school administrators responsible for laboratory scheduling, safety, and equipment use should use this dashboard. It also helps procurement teams plan supply purchases based on actual consumption patterns.
2. Can the dashboard be customized for a specific school's lab structure?
Yes, the template can be edited to match the school's own laboratory names, subjects, and grade bands. KPIs and filters can be added or removed using the drag-and-drop editor.
3. What data is needed to populate this dashboard?
Schools need booking records, equipment status logs, safety incident reports, and supply usage data. Once added, the dashboard organizes this information into the existing charts and KPI tiles.