
What is a Secondary School Transportation Operations Dashboard
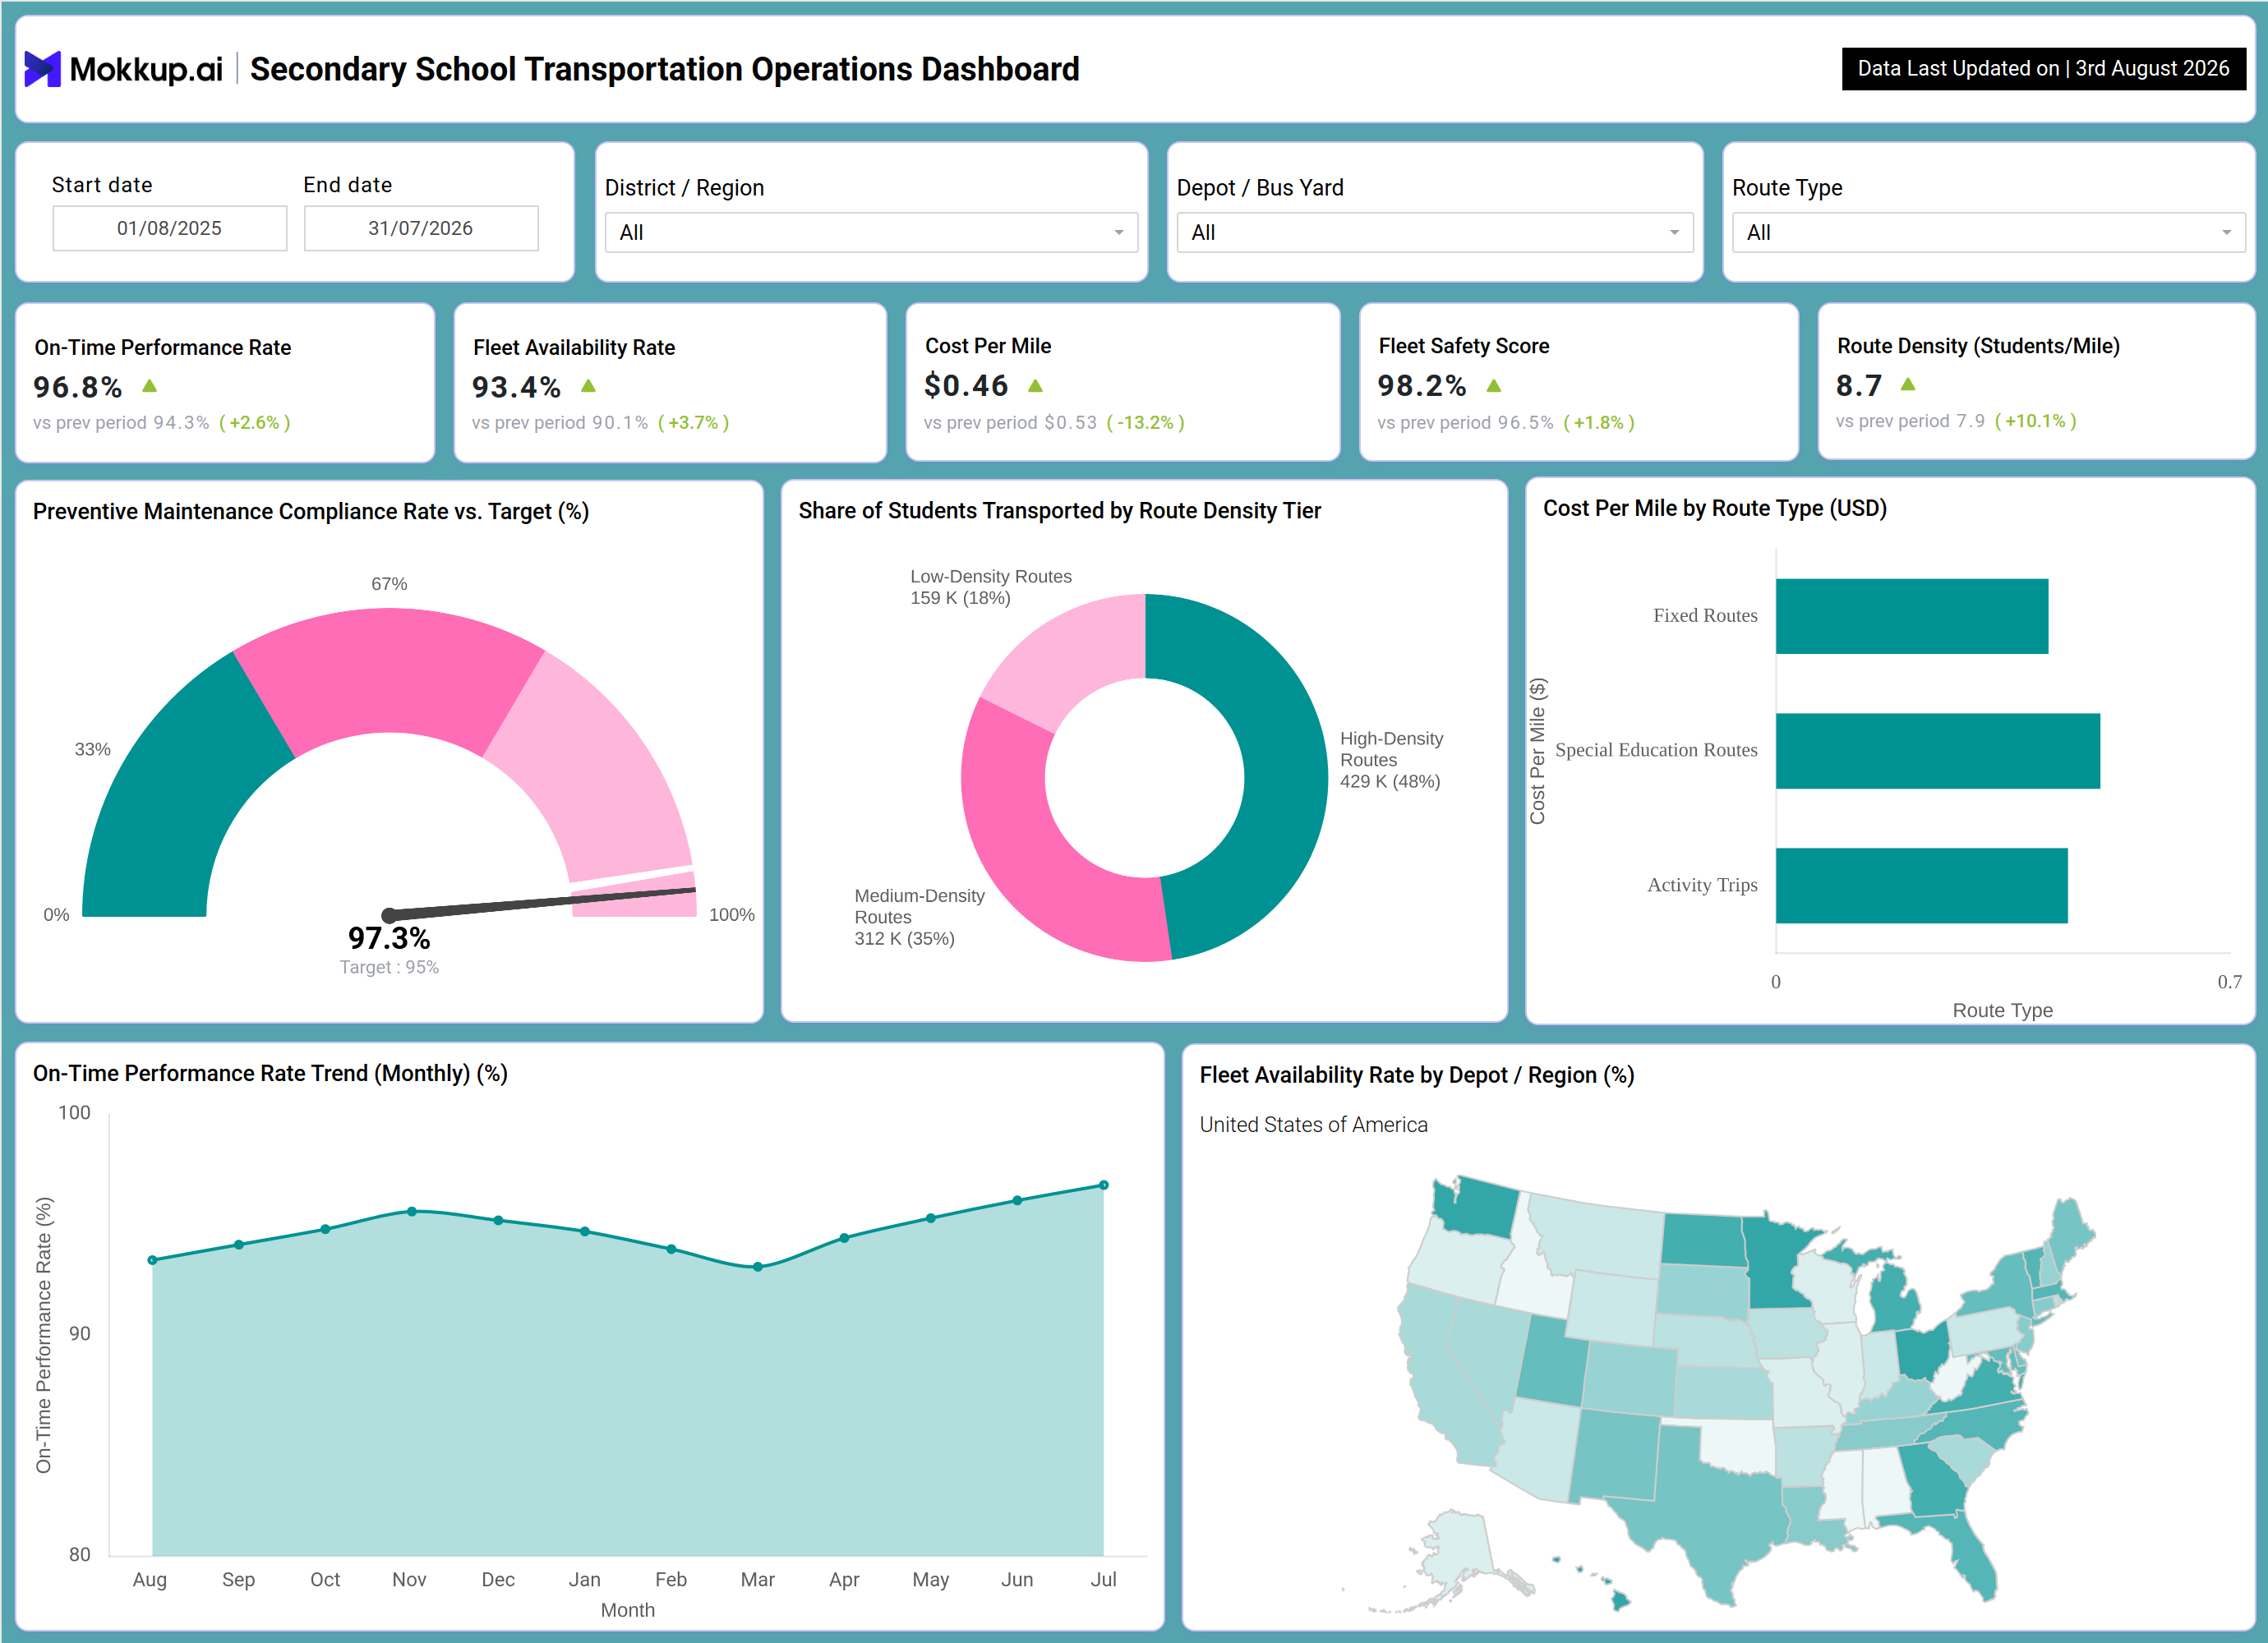
A secondary school transportation operations dashboard gives transportation directors, fleet managers, and district operations teams a single view into how student transportation is performing across buses, routes, and depots. This dashboard consolidates on-time performance, fleet availability, maintenance compliance, and route economics into one screen, so operations leaders no longer have to pull separate reports from routing software, maintenance logs, and finance systems. Built around filters for date range, district or region, depot or bus yard, and route type, it lets a transportation department narrow its view from a full district rollout down to a single bus yard or route category. For districts running large secondary school bus fleets, school bus fleet availability rate tracking replaces scattered spreadsheets with one operational picture that updates as new trip and maintenance data comes in. Whether preparing for a board meeting or reviewing weekly depot performance, this student transportation on-time performance dashboard gives stakeholders a shared reference point for how the fleet is running.
How to Create a Secondary School Transportation Operations Dashboard
You don't need to build your report from scratch; just start with a ready-to-use dashboard template from Mokkup. Add in your data and export it however you like. Here's how to do it:
1. Create or Log in to Your Mokkup Account
Start by signing up on Mokkup.ai using your email. If you already have an account, just log in, and you'll be good to go.
2. Choose and Customize Your Dashboard Template
Find the Secondary School Transportation Operations Dashboard template in the Templates section. Use the drag-and-drop editor to adjust KPIs, edit filters, or add elements based on your data.
3. Export to Your BI Tool
Once your dashboard wireframe is ready, use the BI Tool Export feature to send it directly to Power BI or Tableau for further analysis and enhancements. You can also download the dashboard as a PDF, PNG, or JPEG, embed it on a platform, or invite your team to collaborate.
Note: This is a Pro template. You'll need a Pro subscription on Mokkup to use and customize this dashboard wireframe. Upgrade anytime to unlock full access.
Secondary School Transportation Operations Dashboard Example
A transportation director for a secondary school district opens this dashboard each week to understand whether buses are running on schedule and whether the fleet is fit to operate. The question driving that review is straightforward: are routes meeting service commitments, and where is risk building before it turns into a parent complaint or a safety issue? Filtering by district, depot, or route type lets the director isolate a specific bus yard or a specific type of route, such as special education or activity trips, before making any judgment about the fleet as a whole.
From the top-level metrics, the director can judge whether on-time delivery, fleet uptime, and safety are trending in the right direction relative to the prior period, and whether cost per mile is moving in a direction the budget can absorb. Looking at the route density breakdown, planners can compare how many students are served by high-density versus low-density routes and decide where consolidation or additional buses would improve efficiency. The preventive maintenance view lets fleet managers check whether servicing is keeping pace with the compliance target, so a bus is pulled for maintenance before a mechanical issue turns into a missed pickup.
Comparing cost per mile across fixed routes, special education routes, and activity trips helps finance and operations teams identify which route category is driving spend and prioritize where cost controls are needed. Reviewing the monthly on-time performance trend alongside the depot-level fleet availability map, the team can spot which regions or bus yards are dragging down system-wide reliability and route additional support there first. Altogether, the dashboard helps transportation leadership move from reactive firefighting to a proactive routine: catching maintenance gaps early, keeping routes cost-efficient, and giving school administrators confidence that buses will show up on time.
How to Analyze Data in a Secondary School Transportation Operations Dashboard
Here is how you can analyze data from this dashboard:
- Compare performance over time: Filter by date range to evaluate transportation performance across a term, semester, or school year.
- Analyze regional operations: Narrow the view by district or region to assess performance within a specific attendance zone.
- Evaluate depot performance: Select a depot or bus yard to review fleet health at the facility level.
- Segment transportation services: Filter by route type to compare fixed routes, special education routes, and activity trips.
- Monitor on-time performance: Compare current on-time rates with the previous period to identify early signs of service degradation.
- Track maintenance compliance: Review the preventive maintenance compliance gauge to identify maintenance gaps before they lead to vehicle breakdowns.
- Analyze route costs: Compare cost per mile by route type to determine which services contribute the most to transportation expenses.
- Review route distribution: Use the route density chart to understand how student loads are distributed across different route density tiers.
- Identify seasonal trends: Track monthly on-time performance to detect recurring seasonal declines.
- Locate maintenance bottlenecks: Cross-reference fleet availability by depot to identify regions requiring additional maintenance support.
Benefits of a Secondary School Transportation Operations Dashboard
The following are the benefits of using this dashboard:
- Centralize transportation operations: Combine on-time performance, fleet availability, and maintenance compliance into a single secondary school transportation dashboard.
- Reduce reporting effort: Replace spreadsheet-based tracking with one unified operational view.
- Improve fleet availability: Monitor school bus fleet availability to identify vehicle shortages before they affect routes.
- Support budget planning: Track cost per mile across route types to improve transportation budgeting.
- Enhance fleet safety: Monitor safety scores and maintenance compliance to improve fleet reliability and reduce operational risk.
- Enable route-level analysis: Filter by depot, region, and route type to make faster operational decisions.
- Simplify leadership reporting: Give district leaders a shared, filterable view for board meetings and audit reporting.
- Control transportation costs: Analyze cost per mile by route category to identify rising expenses before they impact the budget.
KPIs to Track in a Secondary School Transportation Operations Dashboard
The following key KPIs can be tracked by using this preventive maintenance compliance rate school fleet dashboard:
- On-Time Performance Rate - measures the percentage of scheduled bus trips that arrive within the target time window.
- Fleet Availability Rate - tracks the percentage of the fleet that is operational and ready for daily assignment.
- Cost Per Mile - measures the average cost of operating a bus for each mile driven, a core metric for any school bus cost per mile analysis tool.
- Fleet Safety Score - measures how consistently the fleet meets defined safety standards.
- Route Density (Students per Mile) - measures how many students are served per mile of route, a key input for any route density dashboard for student transportation.
Frequently Asked Questions
1. What does the Secondary School Transportation Operations Dashboard track?
It tracks on-time performance, fleet availability, safety, maintenance compliance, and cost per mile in one secondary school transportation operations dashboard, so administrators do not need separate reports for each metric.
2. How often should on-time performance be reviewed?
Most districts review it weekly using the date filter, and monthly when comparing seasonal trends across the school year. Frequent review helps catch dips before they affect multiple routes.
3. Can this dashboard help reduce transportation costs?
Yes. Comparing cost per mile by route type and reviewing route density data highlights where a route density dashboard for student transportation can guide consolidation or resourcing decisions that lower per-mile spend.