
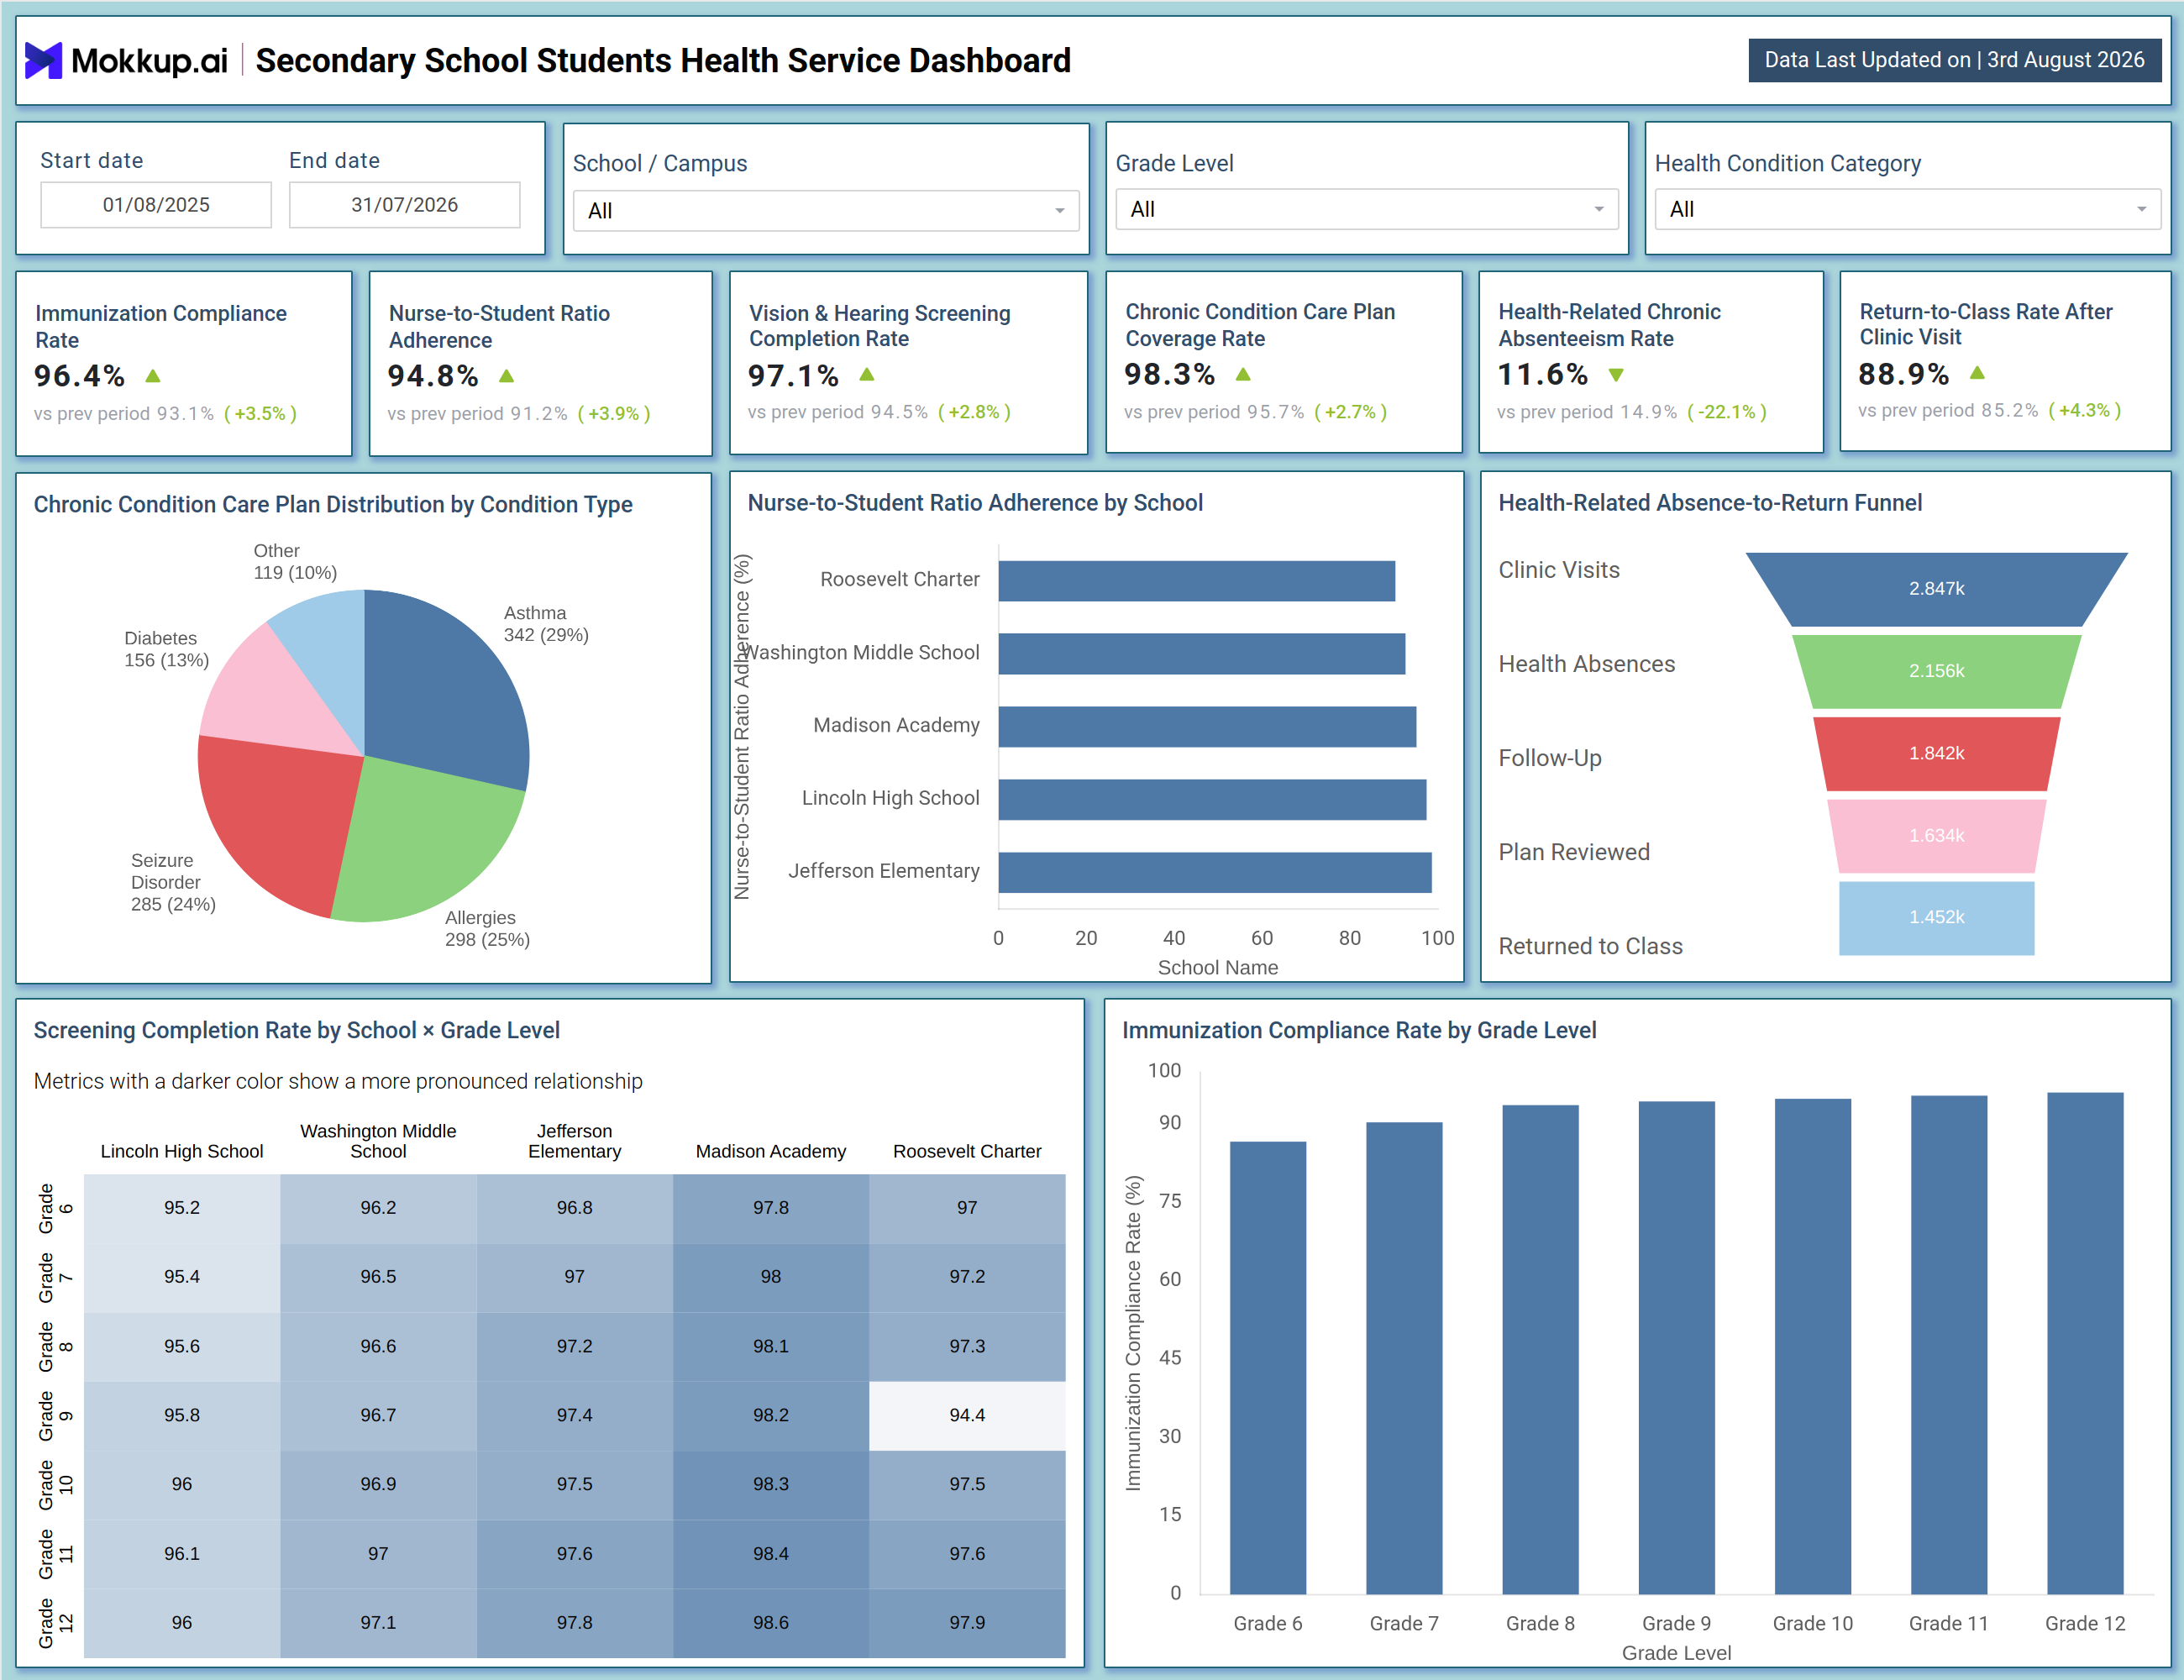
What is a Secondary School Students Health Service Dashboard
The Secondary School Students Health Service Dashboard is a single-screen reporting tool built for school health teams, nurse administrators, and student wellness coordinators who need a consolidated view of clinic performance across a district. It brings compliance, screening, staffing, and chronic condition data into one connected secondary school student health service dashboard view that reflects the latest visit and screening records logged by campus nurses. Users can filter by date range, school or campus, grade level, and health condition category to narrow the view to a single site, grade band, or condition type such as asthma or seizure disorder. This makes the dashboard useful whether the audience is a district health director reviewing five campuses or a single school nurse checking how her site compares against district averages. Because every KPI tile, chart, and table pulls from the same data set, the dashboard removes the need to reconcile numbers across separate spreadsheets or campus-level reports.
How to Create a Secondary School Students Health Service Dashboard
You don't need to build your report from scratch; just start with a ready-to-use dashboard template from Mokkup. Add in your data and export it however you like. Here's how to do it:
1. Create or Log in to Your Mokkup Account
Start by signing up on Mokkup.ai using your email. If you already have an account, just log in, and you'll be good to go.
2. Choose and Customize Your Dashboard Template
Find the Secondary School Students Health Service Dashboard template in the Templates section. Use the drag-and-drop editor to adjust KPIs, edit filters, or add elements based on your data.
3. Export to Your BI Tool
Once your dashboard wireframe is ready, use the BI Tool Export feature to send it directly to Power BI or Tableau for further analysis and enhancements. You can also download the dashboard as a PDF, PNG, or JPEG, embed it on a platform, or invite your team to collaborate.
Note: This is a Pro template. You'll need a Pro subscription on Mokkup to use and customize this dashboard wireframe. Upgrade anytime to unlock full access.
Secondary School Students Health Service Dashboard Example
A district school health coordinator typically opens the Secondary School Students Health Service Dashboard at the start of a review cycle to see how clinic operations and compliance programs are performing across campuses. The coordinator narrows the view using the date range and campus filter, then scans the top tiles for a quick read on whether immunization compliance, screening completion, and staffing coverage are trending in the right direction against the prior period.
From there, the coordinator can identify which condition types are placing the greatest demand on clinic resources by reviewing how chronic condition care plans are distributed across categories such as asthma, allergies, seizure disorder, and diabetes, then prioritize staff training or supply planning around the group consuming the most plans. Comparing nurse-to-student ratio adherence school by school also helps district leaders identify which campuses are understaffed relative to peers. Hence, staffing requests go to the sites that need them most.
The dashboard also lets the team trace what happens after a student visits the clinic, following the path from the initial visit through follow-up, care plan review, and return to class. When the share of returning to class after a visit runs lower than expected, planners can dig into resolution steps to see where the process stalls, whether at follow-up scheduling or care plan review. Cross-referencing screening completion and immunization compliance by grade level also lets nurses spot which grade bands are falling behind on preventive care before a compliance audit flags the gap. Altogether, the dashboard helps school health teams move from reactive record-keeping to coordinated oversight of clinic performance, staffing adequacy, and preventive care compliance across every campus in the district.
How to Analyze Data in a Secondary School Students Health Service Dashboard
Here is how you can analyze data from this dashboard:
- Compare reporting periods: Filter by Start Date and End Date to evaluate health metrics for a specific review period.
- Benchmark school performance: Use the School/Campus filter to compare individual schools or view district-wide performance.
- Analyze grade-level trends: Apply the Grade Level filter to identify whether screening completion rates differ by age group.
- Focus on specific conditions: Select a Health Condition Category to evaluate care plans and staffing needs for a particular condition.
- Review care plan distribution: Analyze the Chronic Condition Care Plan Distribution chart to identify conditions requiring the most nursing support.
- Monitor nurse staffing: Use the Nurse-to-Student Ratio Adherence by School chart to identify campuses that are understaffed.
- Track student recovery: Review the Health-Related Absence-to-Return Funnel to identify where students are delayed in returning to class.
- Compare screening completion: Evaluate vision and hearing screening completion rates across campuses to monitor ongoing performance.
- Track immunization compliance: Use the Immunization Compliance Rate by Grade Level chart to ensure compliance remains consistent across all grades.
Benefits of a Secondary School Students Health Service Dashboard
The following are the benefits of using this dashboard:
- Centralize student health data: Replace multiple campus reports with a single secondary school student health services dashboard.
- Track chronic care plans: Monitor care plans for asthma, allergies, seizure disorders, diabetes, and other chronic health conditions.
- Reduce reporting effort: Eliminate manual reconciliation across campus spreadsheets and student health record systems.
- Identify staffing gaps: Compare nurse-to-student ratios to detect understaffed campuses early.
- Prioritize healthcare resources: Focus clinic resources on the health conditions requiring the greatest level of care.
- Monitor student recovery: Track where students are delayed between clinic visits and returning to class.
- Support compliance reporting: Monitor screening completion and immunization compliance at both the grade and campus level to simplify audits.
KPIs to Track in a Secondary School Students Health Service Dashboard
The following key KPIs can be tracked by using this dashboard:
- Immunization Compliance Rate - core metric in this immunization compliance rate tracking tool, measuring students meeting required vaccination schedules.
- Nurse-to-Student Ratio Adherence - primary figure for nurse-to-student ratio monitoring for schools, tracking staffing against recommended ratios by campus.
- Vision & Hearing Screening Completion Rate - central to vision and hearing screening completion rate analysis, showing how many students completed required screenings.
- Chronic Condition Care Plan Coverage Rate - core measure in this chronic condition care plan tracking dashboard, showing students with an active plan on file.
- Health-Related Chronic Absenteeism Rate - supports student absenteeism rate tracking for school health teams by isolating absences linked to ongoing conditions.
- Return-to-Class Rate After Clinic Visit - measures how many students return to class after a clinic visit rather than being sent home.
Frequently Asked Questions
1. What is the Secondary School Students Health Service Dashboard used for?
District health coordinators and school nurses use it to monitor immunization compliance, screening completion, staffing adequacy, and chronic condition care plans across every campus in one view. It replaces separate campus-level health reports with a single filterable dashboard.
2. Which schools appear in this dashboard?
The dashboard tracks every campus in the district, including Lincoln High School, Washington Middle School, Jefferson Elementary, Madison Academy, and Roosevelt Charter. Filters let users narrow the view to one campus or compare all of them side by side.
3. Can I customize this dashboard template for my district?
Yes, the template is fully editable in Mokkup's drag-and-drop editor, so KPI tiles, filters, and charts used for student absenteeism rate tracking for school health teams can be adjusted to match a district's data structure. It requires a Pro subscription for full customization access.