
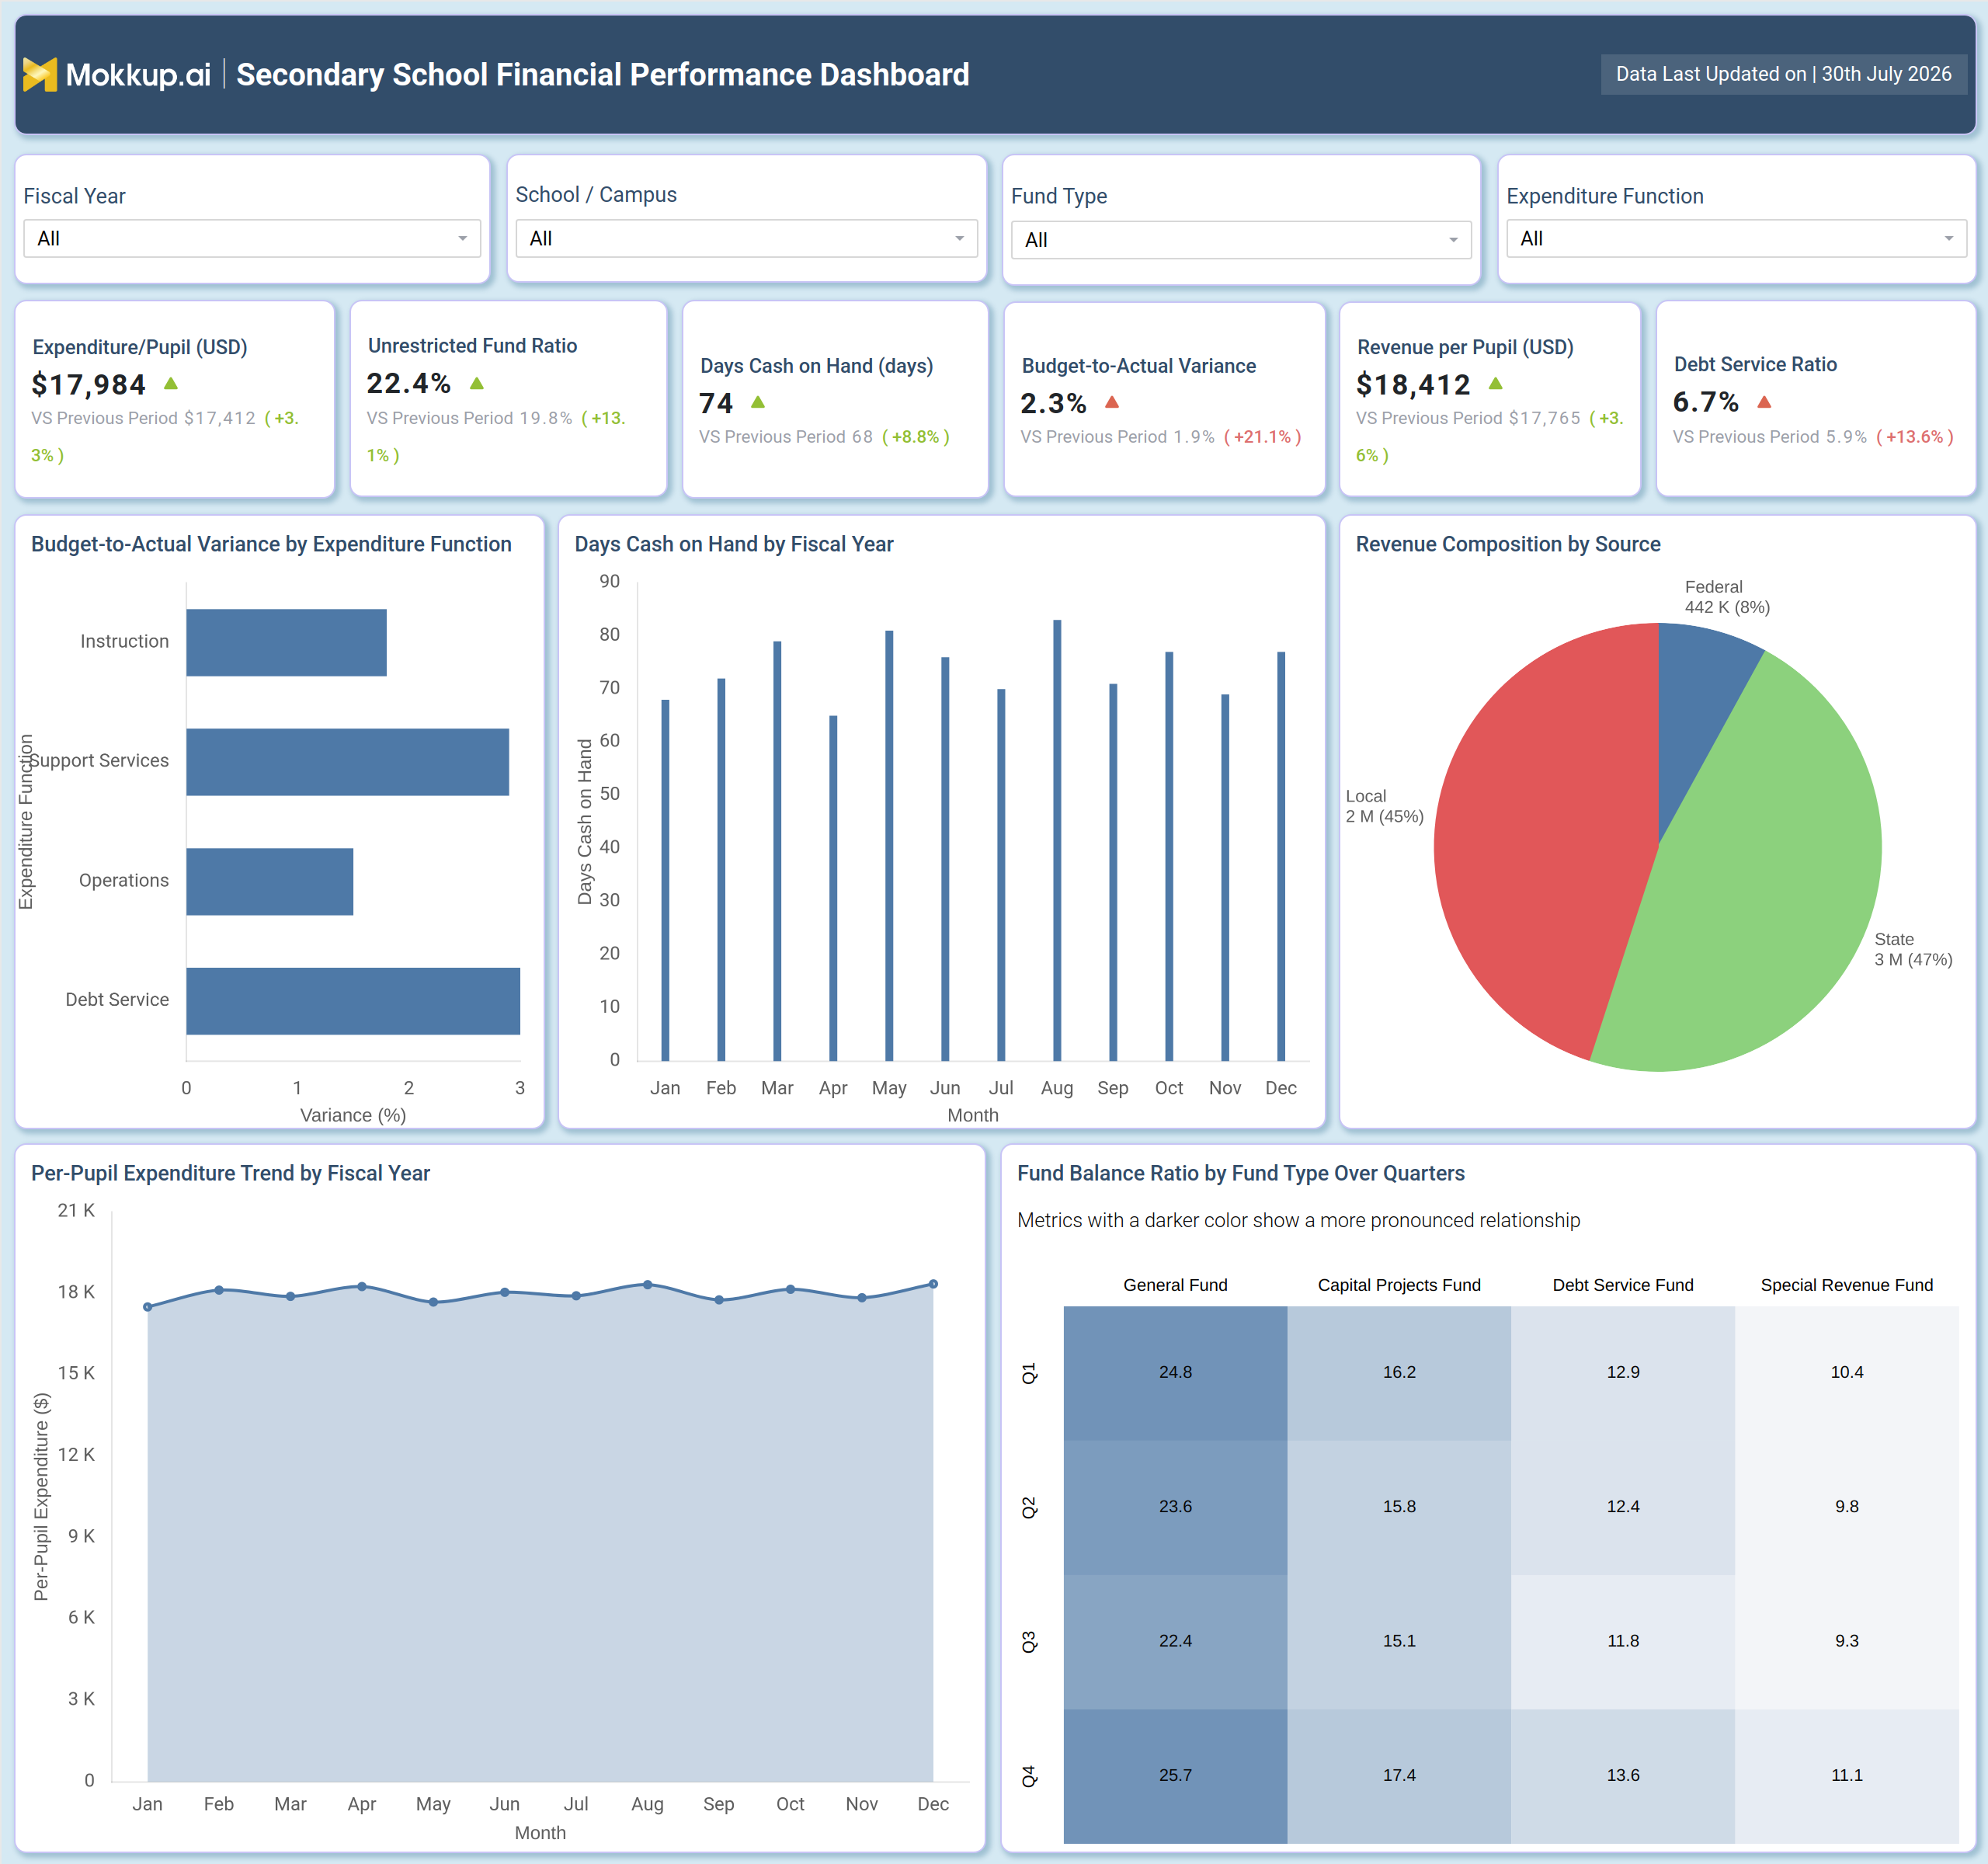
What is a Secondary School Financial Performance Dashboard?
The Secondary School Financial Performance Dashboard is a single-screen financial reporting template built for school district business offices to track spending, liquidity, and revenue performance across secondary campuses. It brings fiscal year, school or campus, fund type, and expenditure function filters together with cash position and revenue composition views, so finance teams do not need to stitch together separate reports before every board presentation. Districts can use this secondary school financial performance dashboard to standardize how per-pupil spending, fund balances, and budget variance are reviewed across every campus, rather than rebuilding a report each budget cycle. Business managers who need an expenditure per pupil tracking tool that also covers cash reserves and debt load can rely on this single wireframe instead of maintaining several disconnected spreadsheets.
How to Create a Secondary School Financial Performance Dashboard
You don't need to build your report from scratch; just start with a ready-to-use dashboard template from Mokkup. Add in your data and export it however you like. Here's how to do it:
1. Create or Log in to Your Mokkup Account
Start by signing up on Mokkup.ai using your email. If you already have an account, just log in, and you'll be good to go.
2. Choose and Customize Your Dashboard Template
Find the Secondary School Financial Performance Dashboard template in the Templates section. Use the drag-and-drop editor to adjust KPIs, edit filters, or add elements based on your data.
3. Export to Your BI Tool
Once your dashboard wireframe is ready, use the BI Tool Export feature to send it directly to Power BI or Tableau for further analysis and enhancements. You can also download the dashboard as a PDF, PNG, or JPEG, embed it on a platform, or invite your team to collaborate.
Note: This is a Pro template. You'll need a Pro subscription on Mokkup to use and customize this dashboard wireframe. Upgrade anytime to unlock full access.
Secondary School Financial Performance Dashboard Example
A district chief financial officer typically opens this secondary school financial performance dashboard before a monthly board meeting, looking to understand whether spending is tracking to budget and whether the district holds enough cash to cover near-term obligations. Before drilling into any one campus, the officer first checks the fiscal year and fund type filters to confirm the reporting period matches what the board expects to review. On this screen, finance leaders can compare budget performance across expenditure functions to see which departments are exceeding plan and which are running under budget. They can also assess how the district cash position is trending across the fiscal year, so seasonal dips tied to tax collection cycles do not get mistaken for a structural liquidity problem.
When per-pupil expenditure moves outside its expected range, teams can trace the shift back to a specific expenditure function or campus before it becomes a budget hearing surprise, which is the value an expenditure per pupil tracking tool brings to a finance office. Planners also use this same view to weigh revenue composition against spending patterns. If state or local funding shifts unexpectedly, finance staff can see how that changes the district's reliance on federal dollars and adjust reserve planning accordingly. Business officers reviewing fund balances by fund type can flag any fund that is drawing down faster than its peers and prioritize it for closer monitoring before the next fiscal year. Altogether, the dashboard helps district finance teams move from reactive reporting to proactive oversight, giving board members, superintendents, and auditors a shared, consistent view of financial health across every secondary campus.
How to Analyze Data in a Secondary School Financial Performance Dashboard
Here is how you can analyze data from this dashboard:
- Filter by Fiscal Year to compare current spending and revenue against prior budget cycles.
- Use the School/Campus filter to isolate financial performance for a single secondary campus.
- Apply the Fund Type filter to separate General Fund activity from Capital Projects, Debt Service, and Special Revenue funds.
- Narrow by Expenditure Function to identify which departments are driving budget-to-actual variance.
- Review the Days Cash on Hand trend for days cash on hand monitoring for schools across fiscal years.
- Compare the Per-Pupil Expenditure Trend against Revenue per Pupil to gauge spending sustainability.
- Scan the Fund Balance Ratio heatmap to spot funds drawing down faster than others.
- Check Revenue Composition by Source to track shifts in federal, state, and local funding reliance.
Benefits of a Secondary School Financial Performance Dashboard
The following are the benefits of using this dashboard:
- Centralizes fiscal year, campus, fund type, and expenditure data in one budget-to-actual variance tracking dashboard.
- Supports days cash on hand monitoring for schools so liquidity risk surfaces early.
- Enables revenue per pupil analysis for secondary schools alongside expenditure trends every reporting cycle.
- Improves fund balance ratio tracking for school districts across every fund type in one place.
- Standardizes financial reporting across every secondary campus in the district.
- Highlights revenue concentration risk through fund and source composition views.
- Supports faster identification of departments exceeding approved budgets.
- Improves transparency for superintendents, board members, and auditors.
- Saves finance staff from rebuilding reports each fiscal year.
KPIs to Track in a Secondary School Financial Performance Dashboard
The following key KPIs can be tracked by using this dashboard:
- Expenditure per Pupil (USD): total operating spend divided by enrolled students, the core metric for any expenditure per pupil tracking tool.
- Unrestricted Fund Ratio (%): share of fund balance available for discretionary use without donor or legal restriction.
- Days Cash on Hand (days): number of days a district can cover operating expenses using available cash reserves.
- Budget-to-Actual Variance (%): the core measure inside this budget to actual variance tracking dashboard, showing the difference between approved budget and actual spend by expenditure function.
- Revenue per Pupil (USD): total revenue divided by enrolled students, central to revenue per pupil analysis for secondary schools.
- Debt Service Ratio (%): portion of revenue committed to debt obligations, indicating long-term financial flexibility.
Frequently Asked Questions
1. What is the Secondary School Financial Performance Dashboard used for?
It gives district finance teams a single view of spending, cash reserves, and revenue composition within the Secondary School Financial Performance Dashboard for every secondary campus. Business officers use it to track budget-to-actual variance and prepare for board reporting without merging multiple spreadsheets.
2. Which KPIs matter most on this dashboard?
Days Cash on Hand and Unrestricted Fund Ratio indicate liquidity, while Budget-to-Actual Variance and Expenditure per Pupil show spending discipline. Revenue per Pupil and Debt Service Ratio round out the picture of overall fiscal health.
3. Can this dashboard be customized for a specific district?
Yes, the Mokkup template lets teams adjust filters, KPIs, and chart labels to match a district fund structure and reporting calendar. Once customized, it can be exported to Power BI or Tableau, or downloaded directly for board use.