
What is a Santa's Holiday Donation & Community Impact Dashboard?
A Santa's Holiday Donation & Community Impact Dashboard is a specialized philanthropic analytics tool designed to monitor and optimize charitable giving, volunteer engagement, and community outcomes during the Christmas season. It consolidates key metrics such as funds raised, donor participation, average gift size, and beneficiary count into a single visual platform. By integrating holiday fundraising performance tracking, Christmas donor engagement analytics, and festive community impact measurement, the dashboard empowers nonprofit managers and CSR teams to track campaign effectiveness, cultivate donor relationships, and demonstrate tangible social value. The dashboard acts as a central hub for analyzing donation trends, evaluating campaign performance, and correlating volunteer efforts with community impact.
How to Create a Santa's Holiday Donation & Community Impact Dashboard
You don’t need to build your report from scratch—just start with a ready-to-use dashboard template from Mokkup. Add in your data and export it however you like. Here’s how to do it:
1. Create or Log in to Your Mokkup Account
Start by signing up on Mokkup.ai using your email. If you already have an account, just log in, and you’ll be good to go.
2. Choose and Customize Your Dashboard Template
Find the Santa's Holiday Donation & Community Impact Dashboard template in the Templates section. Use the drag-and-drop editor to adjust KPIs, edit filters, or add elements based on your data.
3. Export to Your BI Tool
Once your dashboard wireframe is ready, use the BI Tool Export feature to send it directly to Power BI or Tableau for further analysis and enhancements. You can also download the dashboard as a PDF, PNG, or JPEG, embed it on a platform, or invite your team to collaborate.
Note: This is a Pro template. You’ll need a Pro subscription on Mokkup to use and customize this dashboard wireframe. Upgrade anytime to unlock full access.
Santa's Holiday Donation & Community Impact Dashboard Example
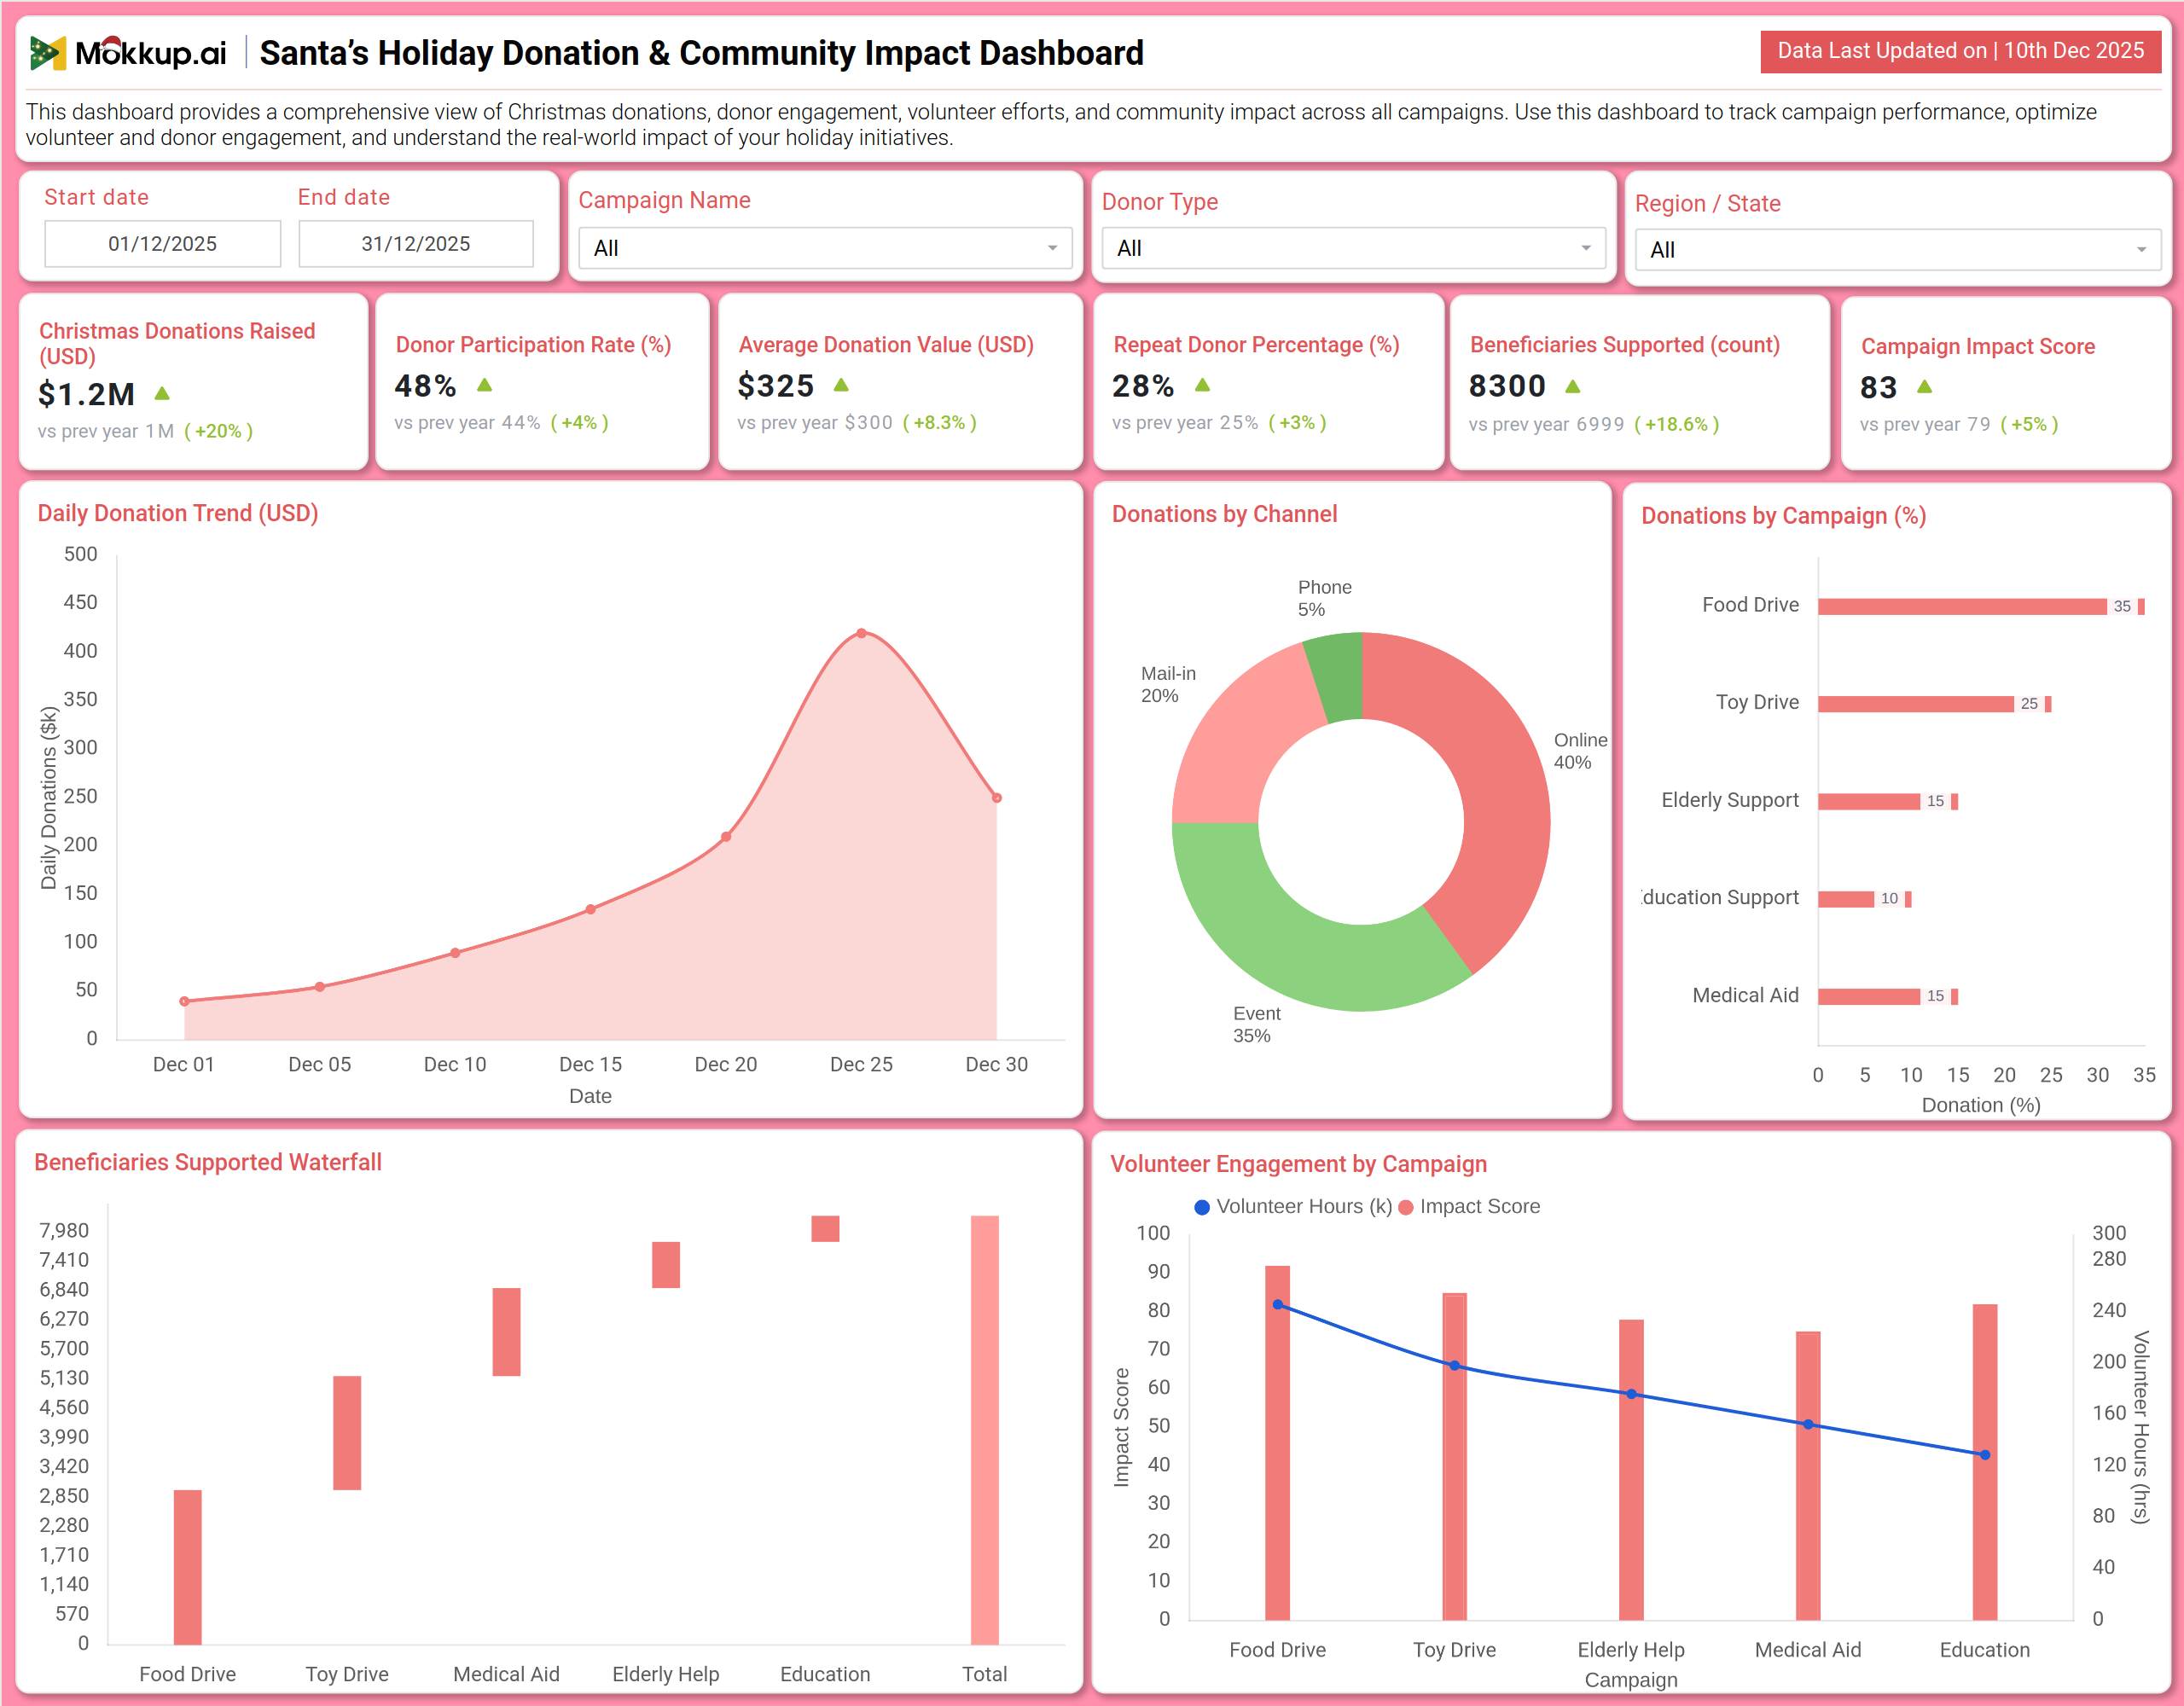
You can create a Santa's Holiday Donation & Community Impact Dashboard that brings together fundraising strategy results, campaign intelligence, and volunteer efforts into a unified view. A typical dashboard includes a Fundraising Overview section, where users can track Christmas Donations Raised, Donor Participation Rate, and Average Donation Value. Visual charts like the Daily Donation Trend and Donations by Channel reveal giving patterns and effective fundraising avenues. The Campaign & Volunteer Analysis section builds on this by displaying Donations and Beneficiaries Supported by Campaign, along with a Volunteer Engagement chart showing hours contributed and impact scores. Together, these modules deliver crucial festive season charity performance insights, enabling organizations to optimize outreach, recognize top campaigns, and clearly report on their holiday social impact.
How to Analyze Data in Santa's Holiday Donation & Community Impact Dashboard
Here is how you can analyze data from this dashboard:
- Monitor Christmas Donations Raised to track the total funds collected across all holiday charitable campaigns.
- Track Donor Participation Rate to measure the percentage of your donor base that contributed during the festive period.
- Analyze Average Donation Value to understand the typical gift size and identify opportunities for donor upgrade strategies.
- Observe Campaign Impact Score to evaluate the overall effectiveness and reach of each individual charitable initiative.
- Study Daily Donation Trend to identify peak giving days and correlate them with specific outreach or marketing activities.
- Examine Donations by Channel to determine which fundraising methods (Online, Mail, Events) are most effective for generating contributions.
- Evaluate Donations and Beneficiaries by Campaign to see which causes (Food Drive, Toy Drive, Medical Aid) resonate most with donors and create the most impact.
Benefits of Santa's Holiday Donation & Community Impact Dashboard
The following are the benefits of using this dashboard:
- Provides centralized visibility into all critical fundraising, donor, and impact metrics for holiday charitable initiatives.
- Supports holiday fundraising performance tracking to measure campaign success against goals and historical benchmarks.
- Improves donor strategy with clear insights from Christmas donor engagement analytics on participation, retention, and gift size.
- Enhances storytelling and reporting through festive community impact measurement, quantifying beneficiaries helped and overall social value created.
- Increases operational efficiency by identifying the most effective fundraising channels and high-impact campaigns for resource allocation.
- Strengthens festive season charity performance insights with an integrated view of financial contributions, volunteer efforts, and community outcomes.
- Reduces manual reporting workload for grant applications and stakeholder updates with automated, consolidated impact data.
- Ensures donor trust and transparency by providing a clear, data-driven narrative of how contributions were used and their direct effects.
KPIs to Track in Santa's Holiday Donation & Community Impact Dashboard
The following key KPIs can be tracked by using this dashboard:
- Christmas Donations Raised (USD): The total monetary value of all donations received during the holiday campaign period.
- Donor Participation Rate (%): The percentage of active or targeted donors who made a gift during the festive season.
- Average Donation Value (USD): The mean gift size calculated by total funds raised divided by the number of donations.
- Repeat Donor Percentage (%): The proportion of donors who have given in a previous period and donated again during the current holiday campaign.
- Beneficiaries Supported (count): The total number of individuals, families, or units directly assisted by the charitable campaigns.
- Campaign Impact Score: A composite metric rating the overall success of a campaign based on funds raised, reach, and efficiency.
- Fundraising Channel Contribution (%): The breakdown of total donations by source (e.g., Online, Direct Mail, Corporate Matching).
- Volunteer Hours Contributed: The total number of hours volunteered across all holiday campaigns and initiatives.
Frequently Asked Questions
1. What is the purpose of this donation and impact dashboard?
It helps nonprofit leaders, development directors, and corporate social responsibility (CSR) managers measure the effectiveness of their holiday giving campaigns, understand donor behavior, track volunteer contributions, and demonstrate the real-world impact of their charitable work.
2. Can the dashboard show which campaign is most popular with donors?
Yes. The Donations by Campaign chart clearly shows which initiatives (e.g., Toy Drive, Food Drive) attract the most financial support.
3. How does the dashboard help with donor retention?
By tracking the Repeat Donor Percentage, it measures loyalty and helps evaluate the success of stewardship efforts aimed at previous donors.
4. Does it quantify the actual community benefit?
Yes. The Beneficiaries Supported metric and the Campaign Impact Score provide direct measures of the social outcome and effectiveness of the funds raised.
5. Who uses this dashboard?
Nonprofit Executive Directors, Development Officers, CSR Managers, Volunteer Coordinators, and Program Directors.