
What is a Production Line Performance Dashboard?
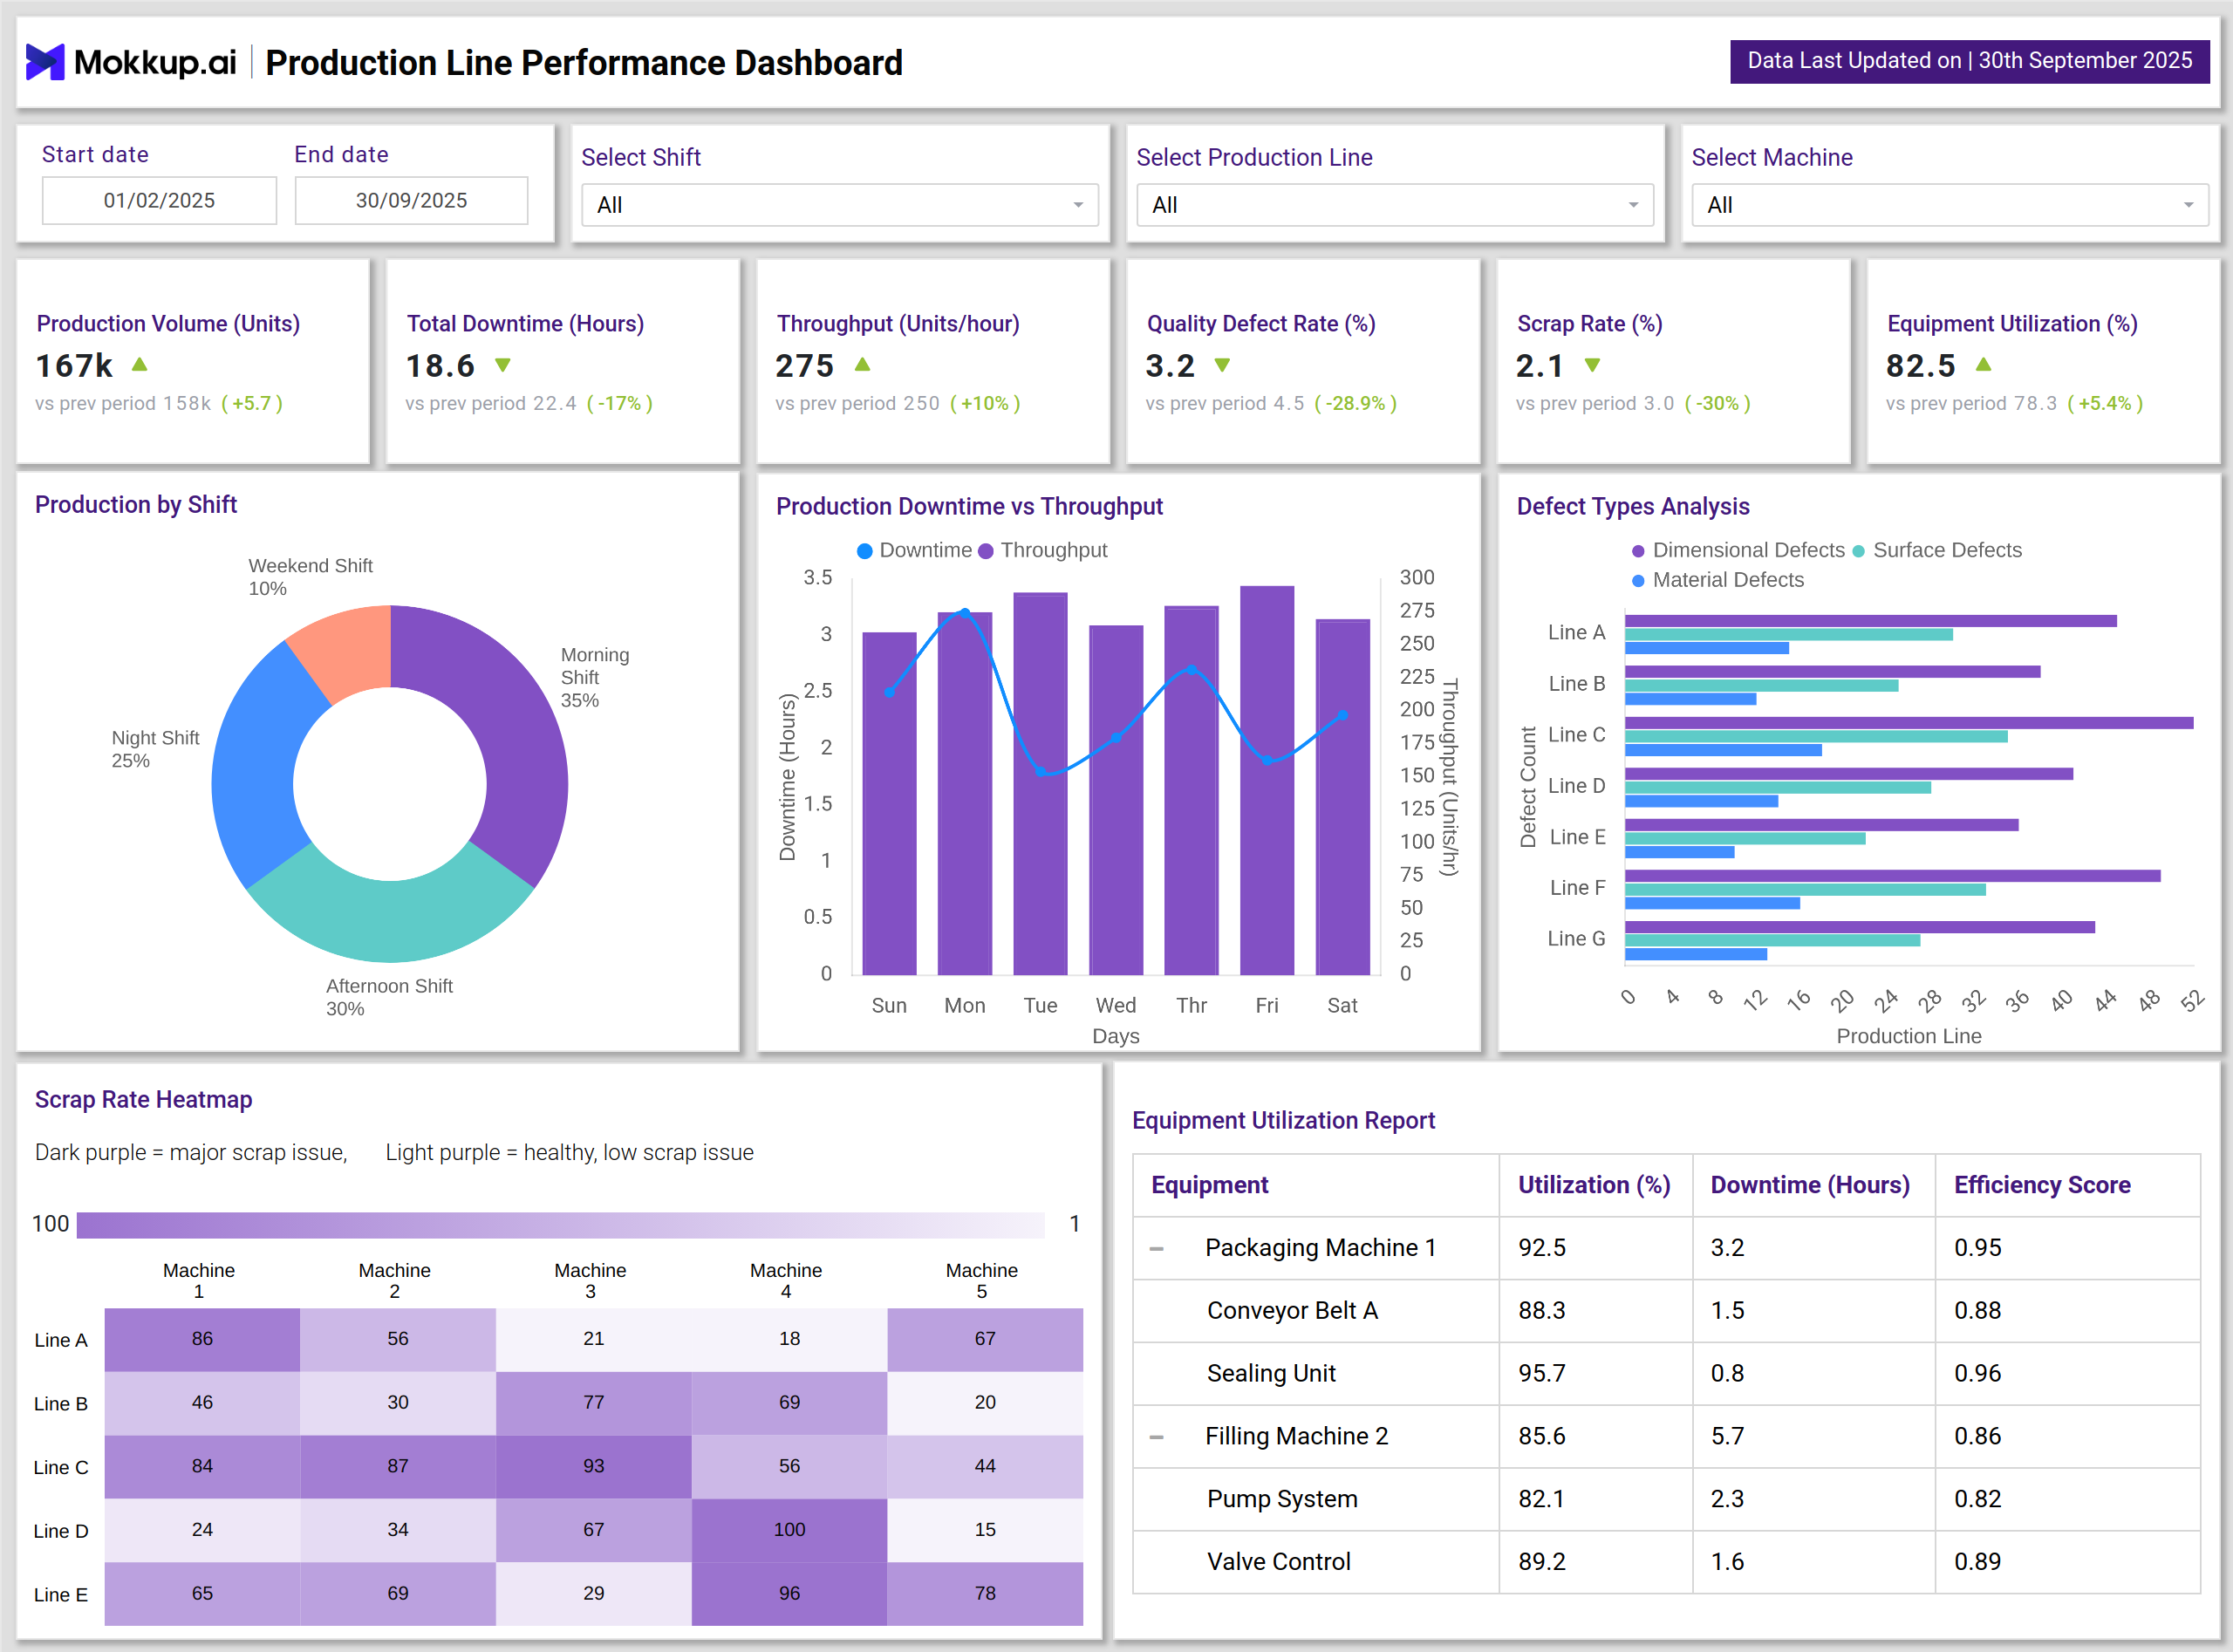
A Production Line Performance Dashboard is a manufacturing analytics tool that provides real-time visibility into operational KPIs. It tracks performance metrics such as production volume, downtime, throughput, defect rate, scrap rate, and equipment utilization.By centralizing these KPIs, the production line performance dashboard template enables manufacturers to identify bottlenecks, improve efficiency, and reduce waste. Acting as a real-time production monitoring dashboard, it allows leaders to optimize shift planning, machine performance, and quality outcomes.
How To Create Production Line Performance Dashboards
You don’t need to build your report from scratch—just start with a ready-to-use production line performance dashboard template from Mokkup. Add in your data and export it however you like. Here’s how to do it:
1. Create or Log in to Your Mokkup Account
Start by signing up on Mokkup.ai using your email. If you already have an account, just log in, and you’ll be good to go.
2. Choose and Customize Your Dashboard Template
Find the Production Line Performance Dashboard template in the Templates section. Use the drag-and-drop editor to adjust KPIs, edit filters, or add elements based on your data.
3. Export to Your BI Tool
Once your dashboard wireframe is ready, use the BI Tool Export feature to send it directly to Power BI or Tableau for further analysis and enhancements. You can also download the dashboard as a PDF, PNG, or JPEG, embed it on a platform, or invite your team to collaborate.
Note: This is a Pro template. You’ll need a Pro subscription on Mokkup to use and customize this dashboard wireframe. Upgrade anytime to unlock full access.
Production Line Performance Dashboard Example
Visual components enhance decision-making. The Production Downtime vs Throughput chart shows how downtime directly affects unit throughput. A Production by Shift donut chart highlights performance differences between morning, afternoon, night, and weekend shifts. The Defect Types Analysis bar chart categorizes defects into dimensional, surface, and material issues across different lines.
The dashboard also features a Scrap Rate Heatmap to identify scrap-related problems by machine and production line, with darker shades representing higher scrap severity. Lastly, the Equipment Utilization Report shows machine-level performance, downtime hours, and efficiency scores, helping managers evaluate asset effectiveness. This manufacturing performance dashboard provides granular and consolidated insights, enabling continuous improvement in production environments.
How to Analyze Data in a Production Line Performance Dashboard
Organizations can maximize the value of a production line performance dashboard template by:
- Monitoring Production Volume vs Throughput – Ensuring actual throughput aligns with planned production targets.
- Comparing Downtime Hours – Treat the dashboard as an incident tracking and production dashboard to identify causes of downtime.
- Evaluating Shift Performance – Assessing differences in efficiency between shifts to balance workload distribution.
- Analyzing Defect Trends – Tracking defect categories to improve quality control and reduce rework.
- Reviewing Scrap Rates – Using the heatmap to find machines or lines that create excessive scrap.
- Measuring Equipment Utilization – Leveraging the real-time production monitoring dashboard to optimize machine capacity and reliability.
By analyzing these factors, organizations can enhance line efficiency, improve product quality, and reduce operational costs.
Benefits of Production Line Performance Dashboard
Adopting a Production Line Performance Dashboard delivers multiple benefits:
- Increased Efficiency: Real-time tracking of throughput and downtime improves productivity.
- Enhanced Quality: The production line performance dashboard template helps monitor defect rates and scrap issues.
- Optimized Asset Utilization: The manufacturing performance dashboard identifies underperforming equipment.
- Shift Optimization: Managers can compare shift-level productivity and assign resources accordingly.
- Reduced Costs: An incident tracking and production dashboard highlights recurring issues, lowering repair and scrap expenses.
- Proactive Decision-Making: The real-time production monitoring dashboard supports continuous improvement initiatives.
Overall, it helps ensure smooth operations and continuous improvement across production lines.
KPIs to Track in Production Line Performance Dashboard
Key KPIs include:
- Production Volume (Units) – Tracks total units produced, reflecting overall manufacturing output.
- Total Downtime (Hours) – Measures equipment downtime, providing insight into lost productivity and efficiency gaps.
- Throughput (Units/hour) – Evaluates how efficiently units are produced within a specific time frame.
- Quality Defect Rate (%) – Monitors the percentage of defective units, enabling better quality control.
- Equipment Utilization (%) – Shows the percentage of time machines are in productive use, helping assess asset efficiency.
These KPIs ensure accurate monitoring of both quality and productivity in daily production.
Frequently Asked Questions
1. Why is a Production Line Performance Dashboard important?
It provides real-time visibility into manufacturing KPIs, helping organizations improve efficiency, reduce downtime, and enhance product quality.
2. Which industries benefit most from this dashboard?
Due to their production complexity, the automotive, electronics, FMCG, pharmaceuticals, and heavy manufacturing industries gain the most value from a manufacturing performance dashboard.
3. Can this dashboard integrate with MES or ERP systems?
Yes. The production line performance dashboard template can connect with MES and ERP platforms for automated, real-time data integration.