
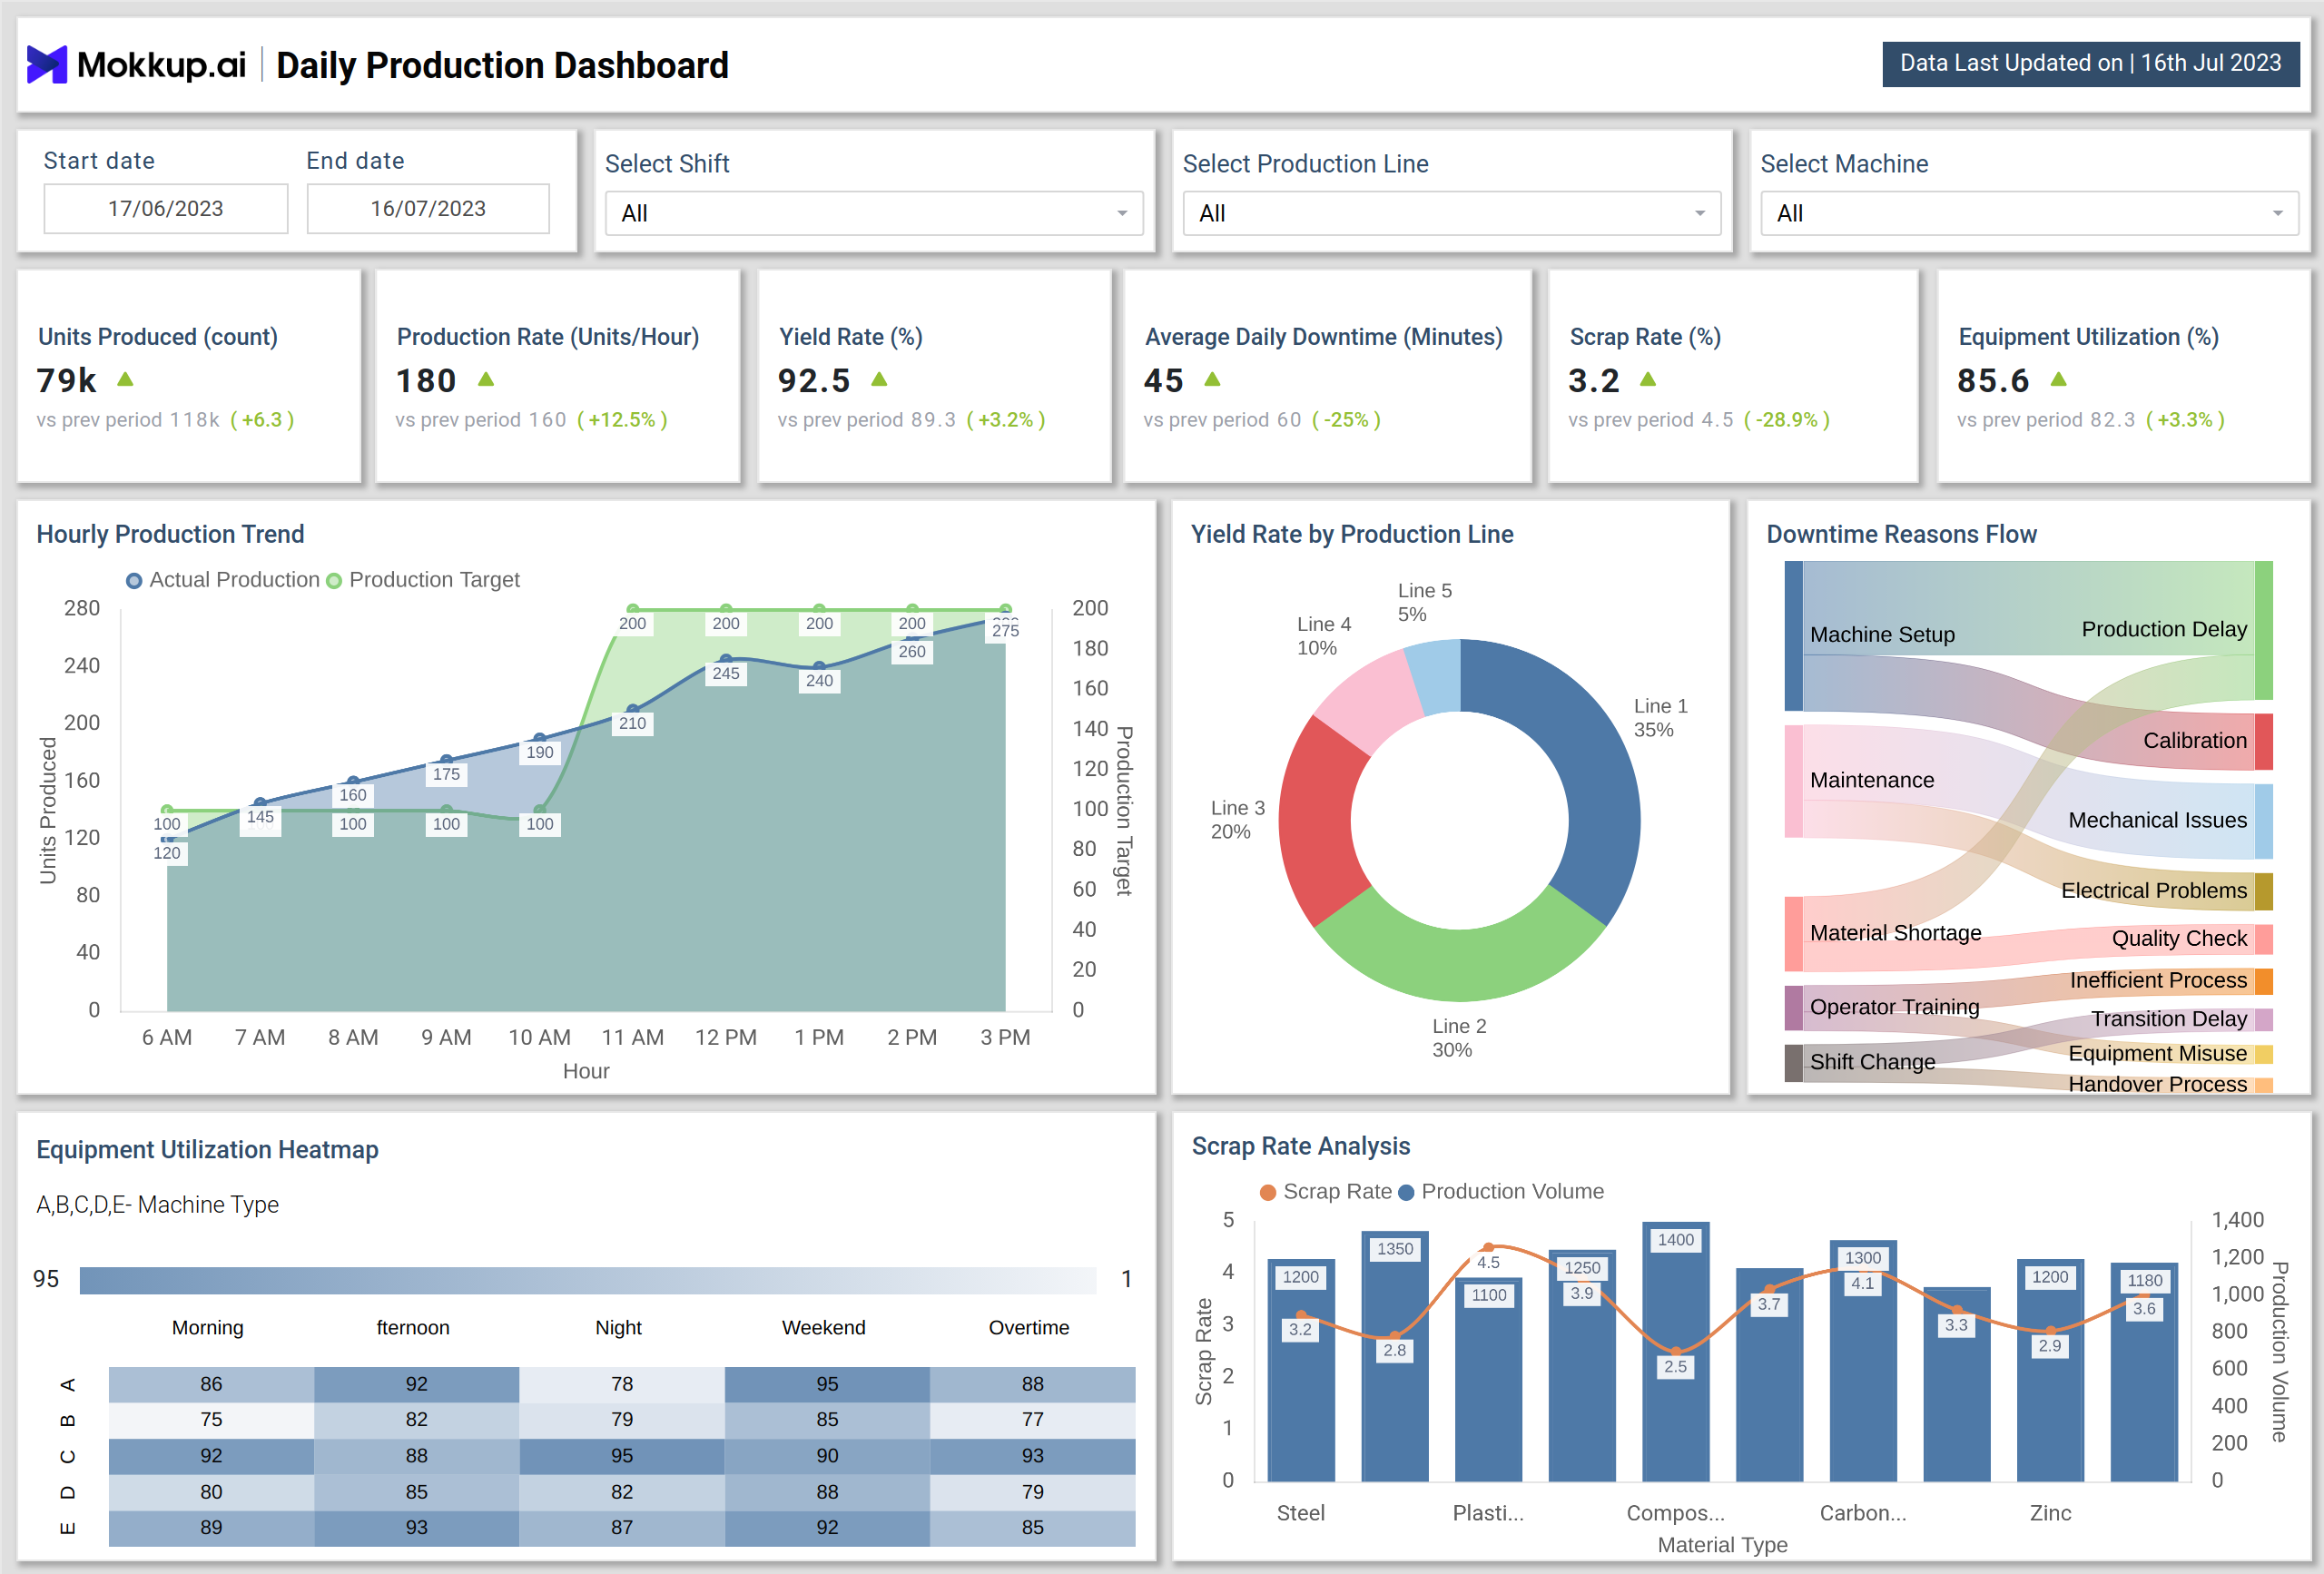
What is a Daily Production Dashboard?
A Daily Production Dashboard is a manufacturing data visualization dashboard that shows all your key factory metrics in one place. It brings together KPIs like Units Produced, Production Rate, Yield Rate, Average Daily Downtime, Scrap Rate, and Equipment Utilization so you can see what’s working and what’s not. It’s ideal for tracking progress across production lines and shifts, helping managers make better decisions without switching between multiple tools.
How To Create Daily Production Dashboards
You don’t need to build your report from scratch; just start with a ready-to-use sample daily production dashboard template from Mokkup. Plug in your own data and export it however you like. Here’s how to do it:
1. Create or Log in to Your Mokkup Account
Start by signing up on Mokkup.ai using your email. Already have an account? Just log in, and you’re good to go.
2. Choose and Customize Your Dashboard Template
Find the Daily Production Dashboard template in the Templates section. Use the drag-and-drop editor to adjust KPIs, edit filters, or add elements based on your data.
3. Export to Your BI Tool
Once your dashboard is ready, use the BI Tool Export feature to send it directly to Power BI or Tableau for further analysis and enhancements. You can also download the dashboard as a PDF, PNG, or JPEG, embed it on a platform, or invite your team to collaborate.
Note: This is a Pro template. To use and customize this dashboard wireframe, you’ll need a Pro subscription on Mokkup. Upgrade anytime to unlock full access.
Daily Production Dashboard Example
Create your personalized production KPI dashboard, bringing all of your key metrics into one view. The Mokkup Daily Production Dashboard wireframe provides a structured layout to help you visualize and organize factory data. With the flexibility to modify elements and filters, you can tailor it to your needs. Once you’ve entered your data, the wireframe can be easily exported to BI tools like Power BI or Tableau for further analysis and enhancement. This allows you to seamlessly take your design to the next level with dynamic, data-driven insights and makes it the ideal production line efficiency tracking tool.
How to Analyze Data in Daily Production Dashboard
To make the most of your Daily Production Dashboard, analyze your data with the following steps:
- Track Hourly Production Trends to see how actual performance compares against production targets.
- Monitor Yield Rate by Production Line to identify high-performing and underperforming lines.
- Review Downtime Reasons Flow to find recurring causes of delays such as machine setup, maintenance, or material shortages.
- Use the Scrap Rate Analysis to evaluate quality issues and minimize waste.
- Leverage the Equipment Utilization Heatmap to understand how effectively machines are used across different shifts and time periods.
- Compare current vs. previous performance to measure improvements or declines in productivity.
- Correlate downtime with utilization to identify bottlenecks and plan better resource allocation.
By following these steps, managers can uncover inefficiencies, reduce downtime, and improve both production speed and quality.
Benefits of Daily Production Dashboard
A Daily Production Dashboard offers several key advantages. It helps you bring together all your production data in one place, making it easier to track and analyze performance. With Mokkup’s customizable dashboard templates, you can:
- Simplify Monitoring: Track critical production metrics clearly and effectively.
- Enhance Efficiency: Detect downtime and scrap issues quickly to resolve them.
- Improve Transparency: Share performance data across teams in an easy-to-understand format.
- Customizable Layouts: Adjust the dashboard to suit your specific production needs with simple data input.
Overall, a Daily Production Dashboard helps you make data-driven decisions while keeping production reporting simple and professional. It is the best production line dashboard for those seeking clarity and efficiency in operations.
KPIs to Track in the Daily Production Dashboard
A good Daily Production Dashboard includes essential KPIs from multiple production areas, such as machine utilization, output, and downtime. It provides a clear overview of factory performance without overwhelming you with too many details.
Key KPIs to Track:
- Units Produced: Tracks total daily output.
- Production Rate (Units/Hour): Monitors manufacturing speed and efficiency.
- Yield Rate (%): Shows the percentage of quality output without defects.
- Average Daily Downtime (Minutes): Tracks machine stoppages and production delays.
- Scrap Rate (%): Measures waste or defective units.
- Equipment Utilization (%): Assesses how effectively machines are used across shifts.
By keeping all of these KPIs in one easy-to-use dashboard, you can track performance and make smarter operational decisions even with work efficiency monitor.
Frequently Asked Questions
1. Best platforms for daily production dashboard creation
Mokkup is a great platform for creating customized production dashboards. It offers a variety of templates that you can modify to display key performance metrics, although data needs to be entered manually. You can also export your dashboard to BI tools like Power BI and Tableau for further analysis.
2. How do you analyze data in a daily production dashboard?
In Mokkup, enter your data and adjust KPIs as needed. Use filters to explore production trends, then export to BI tools for deeper analysis.