
What is a Procurement Process Report Dashboard?
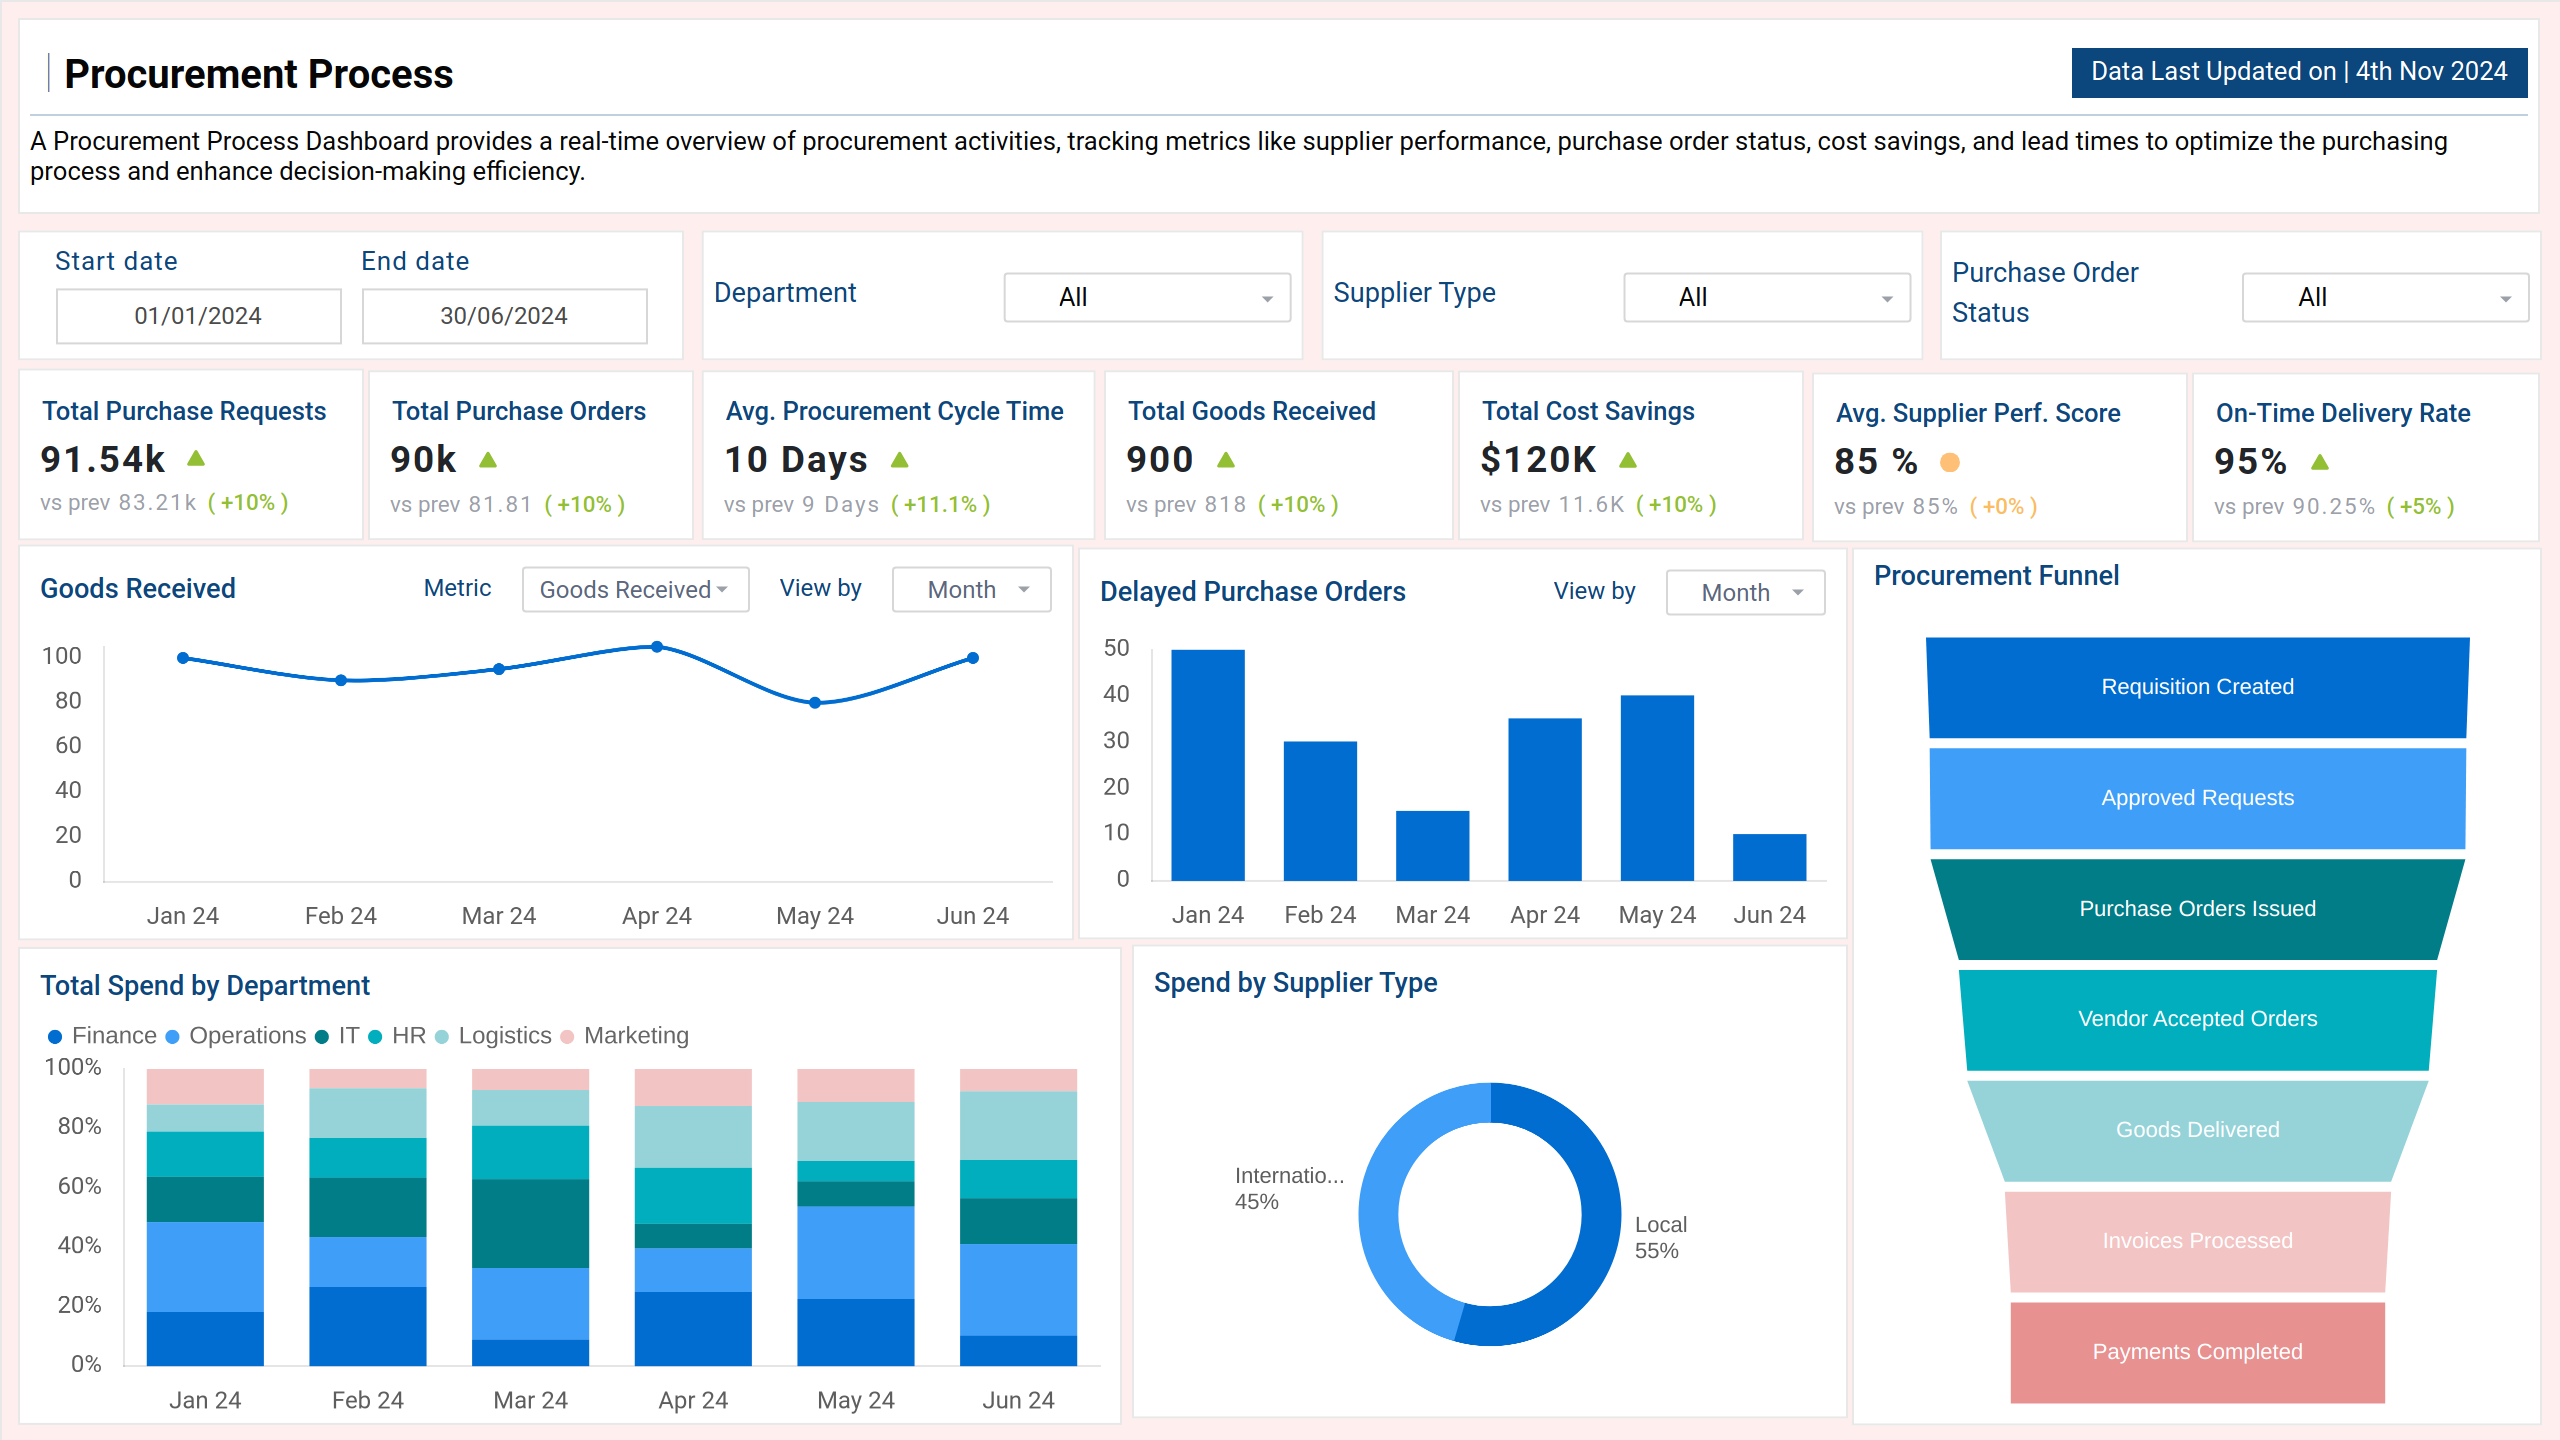
The procurement dashboard template provides detailed insights into procurement operations, assisting organizations in streamlining processes and optimizing expenditures. It consolidates key metrics and data points related to purchasing activities, supplier performance, cost management, and procurement efficiency and presents them in an easily digestible, real-time format.
Procurement Dashboard Example
A well-structured procurement analytics dashboard gives a high-level view of an organization’s procurement activities. It includes visual elements such as bar charts showing delayed purchase orders, pie charts showing supplier distribution, and line graphs showing procurement trends over time. You can even adjust metrics based on department, supplier, purchase order, or time period using intuitive filters. Drill-down capabilities enable deeper analysis, such as viewing spend by specific vendor or identifying delays in order fulfillment.
Benefits of Procurement Dashboards
The procurement reporting dashboard offers a wide range of benefits that help organizations optimize their procurement processes, reduce costs, and improve decision-making. Here’s a breakdown of the key benefits:
- Get instant insights into procurement KPIs such as spend analysis, supplier performance, and purchase order cycle time.
- Maintain healthy supplier relationships by proactively addressing issues.
- Align procurement goals with broader organizational objectives.
You can also explore our purchase order procurement dashboard to ensure that payment terms and pending orders are aligned for efficient order management.
KPIs to Track in Procurement Dashboards
From this dashboard wireframe, you can track KPIs like:
- Total Purchase Requests: Monitors the total number of procurement requests submitted.
- Total Purchase Orders (POs): This represents the total number of approved orders submitted to suppliers.
- Spend by Supplier Type: The visualization illustrates the spending distribution by supplier categories.
- Total Approved POs: The total number of purchase orders approved during the specified timeframe.
- Pending POs: Counts the number of purchase orders pending approval.
- Average Approval Time: This metric measures the average time it takes to approve purchase orders.
- Average Cost Per PO: The typical cost for a single purchase order.
- PO Conversion Rate: The percentage of purchase requests converted into purchase orders.
- Supplier Diversity: Specifically measures the engagement and spend with suppliers from underrepresented or disadvantaged groups
- Inventory Turnover Ratio: This KPI is used to measure how efficiently a company is managing its inventory.
How to Create a Procurement Dashboard
You do not need to develop the dashboard from scratch, as there is a ready-to-use sample procurement dashboard available to get started. Just plug in your details, and you will be good to go. Here is a step-by-step guide:
- Create or Log in to Your Mokkup Account
- Choose and Customize Your Dashboard with a drag-and-drop editor.
- Export to your BI Tool or download it as a PDF, PNG, or JPEG
Note: This is a Pro template. You’ll need a Pro subscription on Mokkup to use and customize this dashboard wireframe. Upgrade anytime to unlock full access.
How to Analyze Data in Procurement Dashboards
Analyzing data in a supply chain procurement dashboard is similar to using a supplier dashboard template, where actionable insights are useful for improving purchasing efficiency, supplier performance, and cost control.
- Start with key questions: Are we staying on budget? Which suppliers are underperforming? Where are the delays?
- Focus on core KPIs
- Drill down for deeper insights
- Track trends over time by using line charts and time-series views
- Establish regular reviews to align procurement teams and drive continuous improvement.
Frequently Asked Questions
Q1. How to create an effective procurement report?
An effective report consolidates KPIs, visualizes trends, and provides actionable insights to support decision-making.
Q2. What should be included in procurement process documentation?
Include purchase requests, order details, supplier information, approvals, payment terms, and performance metrics.
Q3. Best practices for vendor management reporting?
Regularly monitor supplier performance, compliance, delivery times, spending, and diversity metrics.
Q4. How to track procurement KPIs and metrics?
Use interactive dashboards with charts and drill-down features to monitor spend, approvals, PO cycles, and supplier performance.
Q5. What are the key components of purchase order reports?
Include total POs, approved versus pending orders, approval times, costs, supplier details, and PO conversion rates.