
What is an Academic Engagement and Performance Dashboard?
An is a centralized data visualization tool that empowers educational leaders to measure engagement, retention, and academic growth across schools and regions. This education engagement dashboard consolidates student performance, school participation, and retention data into a single interface for real-time analysis.
The Academic Engagement and Performance Dashboard serves as an essential part of data-driven education systems, providing insights into engagement levels, performance index, and institutional efficiency. Through built-in student engagement analytics and education retention metrics, decision-makers can pinpoint areas of improvement and take timely actions to boost academic outcomes.
Overall, this solution enhances academic growth tracking and school performance analysis, ensuring better visibility into student success metrics across public and private institutions.
How to Create an Academic Engagement and Performance Dashboard
You don’t need to build your report from scratch—just start with a ready-to-use dashboard template from Mokkup. Add your data and export it as needed. Here’s how to do it:
1. Create or Log in to Your Mokkup Account
Start by signing up on Mokkup.ai using your email. If you already have an account, simply log in, and you’ll be all set.
2. Choose and Customize Your Dashboard Template
Find the Academic Engagement and Performance Dashboard template in the Templates section. Use the drag-and-drop editor to adjust KPIs, edit filters, or add elements based on your data.
3. Export to Your BI Tool
Once your dashboard wireframe is ready, use the BI Tool Export feature to send it directly to Power BI or Tableau for further analysis and enhancements. You can also download the dashboard as a PDF, PNG, or JPEG, embed it on a platform, or invite your team to collaborate.
Note: This is a Pro template. You’ll need a Pro subscription on Mokkup to use and customize this dashboard wireframe. Upgrade anytime to unlock full access.
Academic Engagement and Performance Dashboard Example
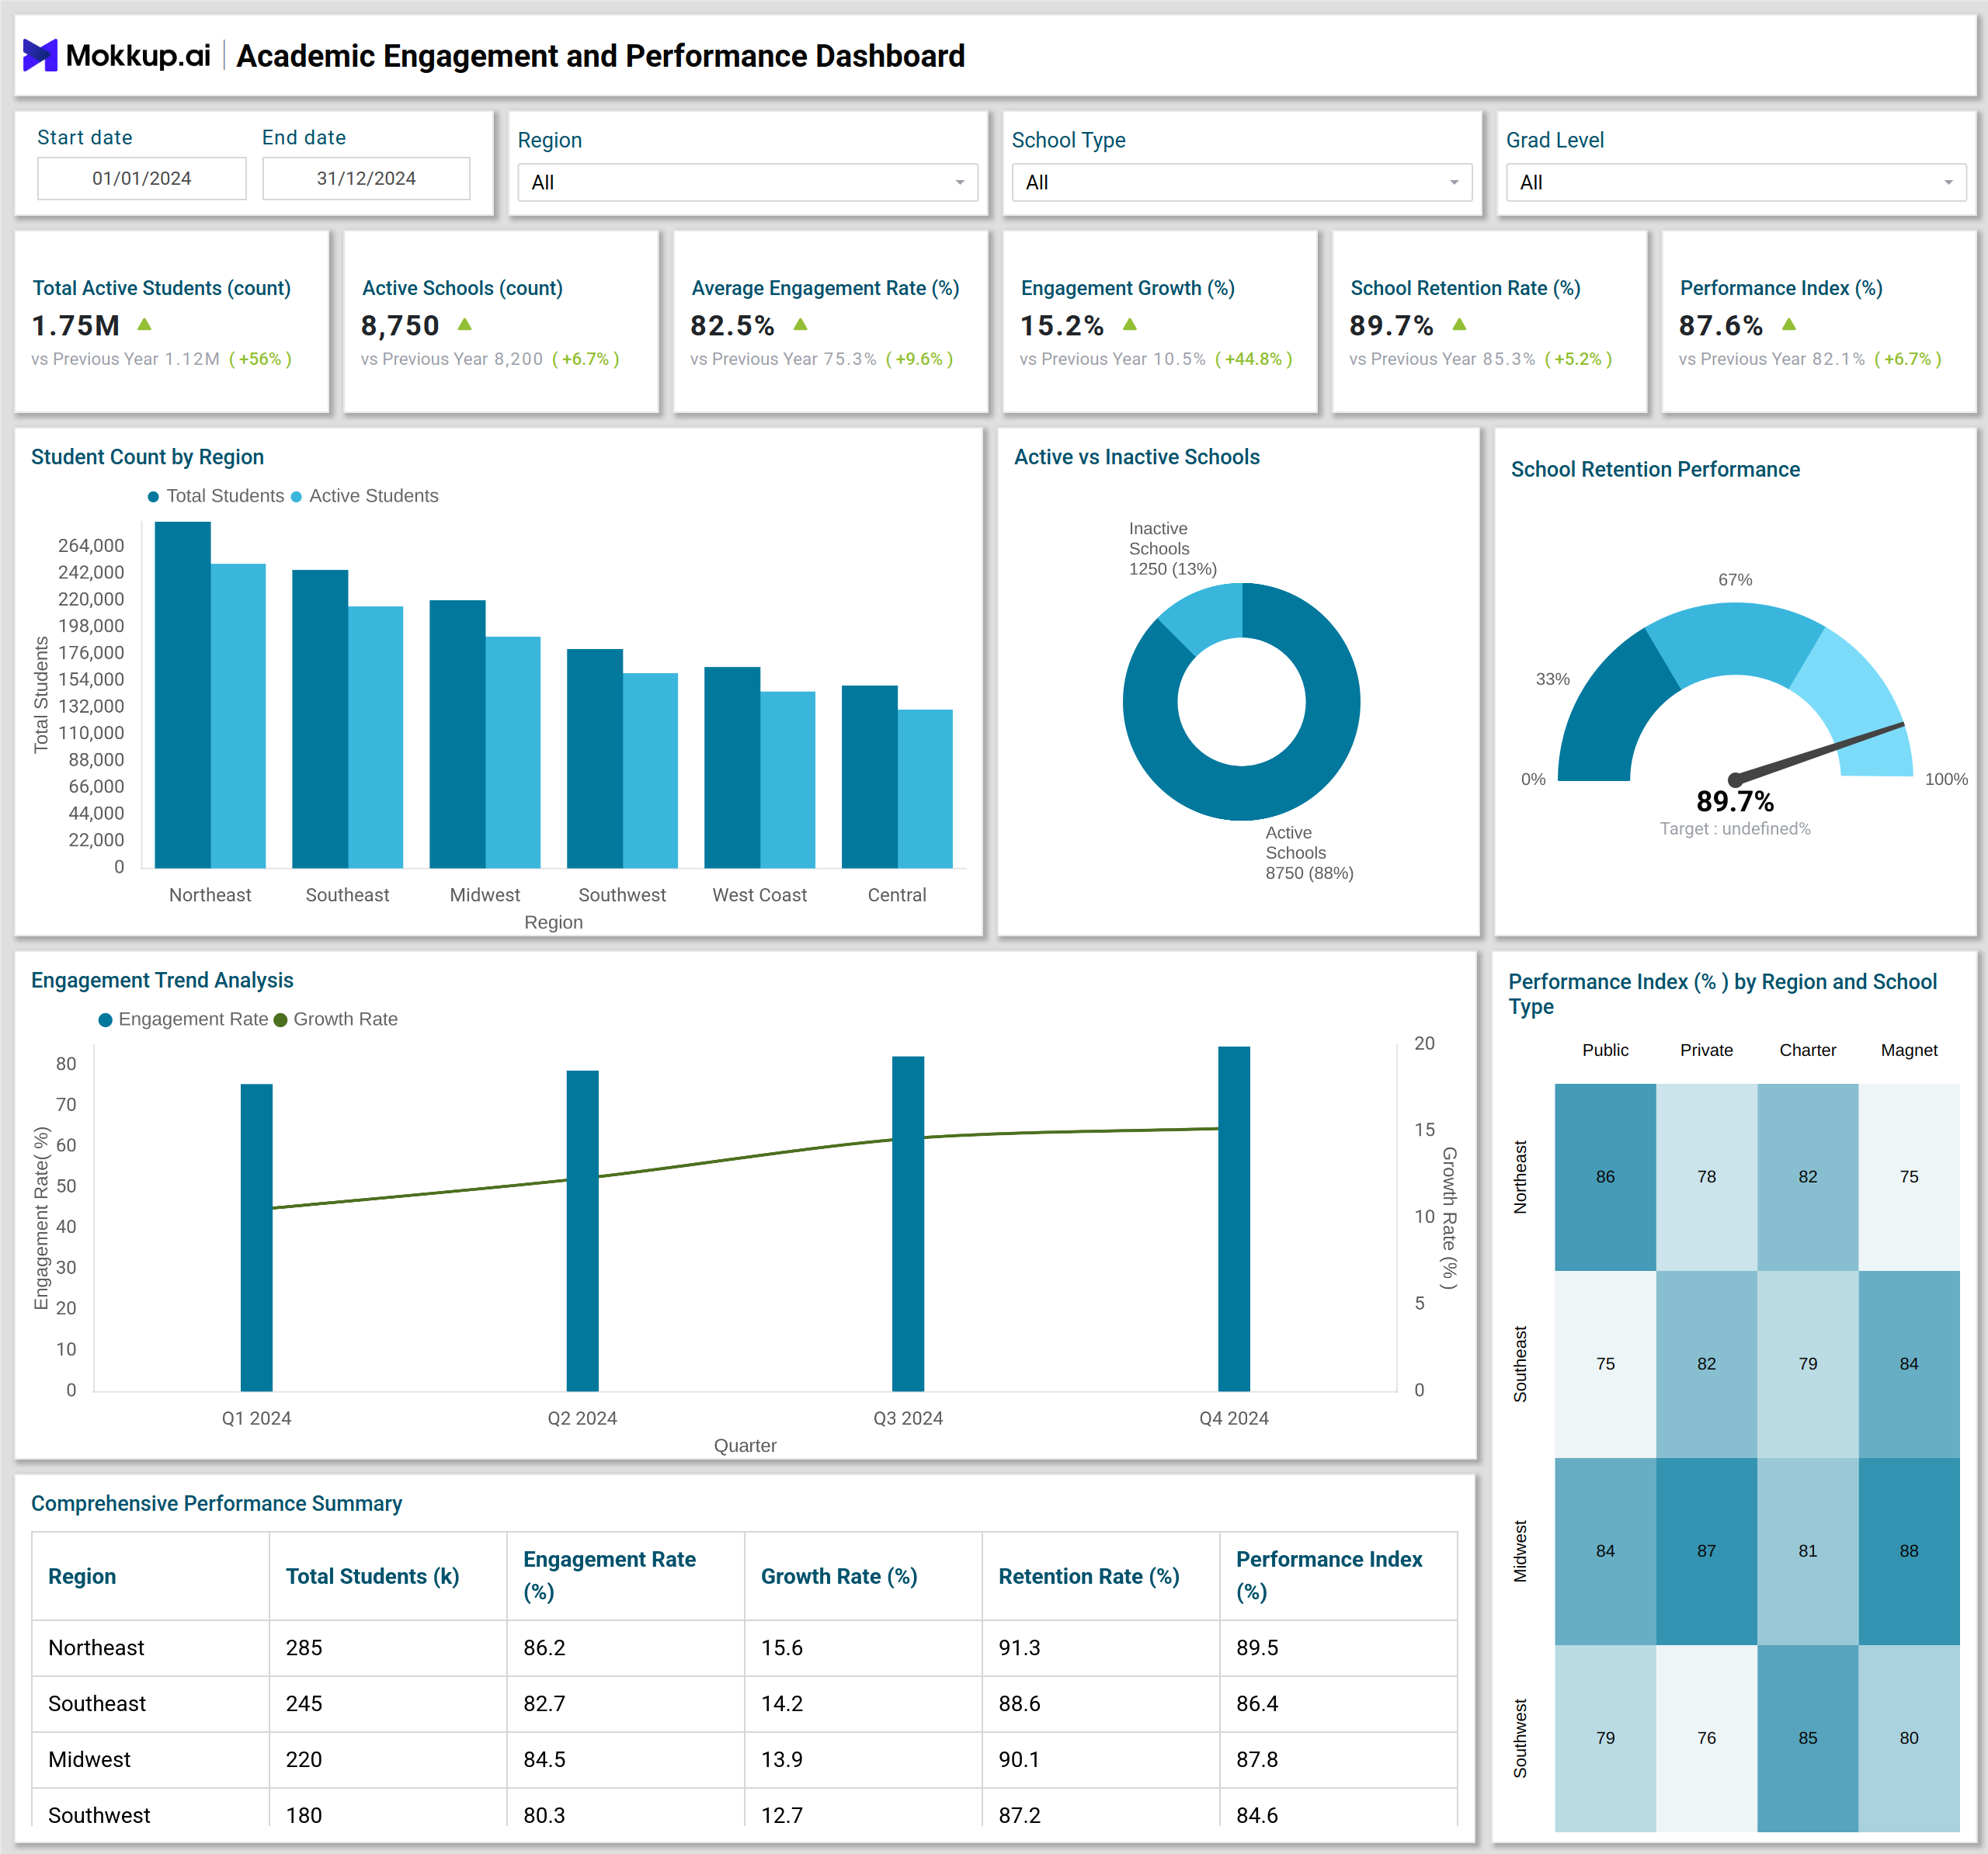
This Academic Engagement and Performance Dashboard example offers a complete view of how schools perform in terms of engagement and retention. The student engagement analytics section provides insights into total versus active participation, while the performance index heatmap allows users to compare results across regions. Such visual clarity supports continuous academic growth tracking and better planning of engagement initiatives. With education retention metrics integrated into the visual layer, the school performance dashboard becomes a valuable decision-making companion for long-term educational improvement.
How to Analyze Data in Academic Engagement and Performance Dashboards
Analyzing data from your Academic Engagement and Performance Dashboard involves interpreting multiple key dimensions that define student and school success:
- Evaluate student engagement analytics by region and grade level to identify high or low-performing areas.
- Measure education retention metrics to track how effectively schools maintain student enrollment.
- Use academic growth tracking features to monitor quarterly engagement trends.
- Conduct school performance analysis to understand which institutions are excelling.
- Leverage heatmaps and trend charts for student success monitoring, identifying the best engagement strategies.
Through such analysis, institutions can turn data into action — improving outcomes across every school in the network.
Benefits of Academic Engagement and Performance Dashboards
Implementing an Academic Engagement and Performance Dashboard provides measurable benefits for schools, administrators, and policymakers:
- Enhance Student Engagement: Real-time student engagement analytics reveal participation trends for effective planning.
- Improve Retention Rates: Use education retention metrics to minimize student dropouts.
- Boost Academic Growth: Strengthen learning outcomes with accurate academic growth tracking tools.
- Enable Data-Driven Decisions: With school performance analysis, identify patterns and allocate resources effectively.
- Ensure Student Success: Continuous student success monitoring helps institutions maintain quality education standards.
By integrating these features, the school performance dashboard supports better engagement and institutional resilience.
KPIs to Track in Academic Engagement and Performance Dashboards
To ensure actionable insights, focus on KPIs designed for Academic Engagement and Performance Dashboard:
- Total Students (count): Tracks overall participation in programs.
- Active Schools (count): Measures the number of schools contributing to engagement goals.
- Average Engagement Rate (%): A core student engagement analytics metric.
- Engagement Growth (%): Highlights performance improvements over time.
- School Retention Rate (%): A critical education retention metric for continuity.
- Performance Index (%): The ultimate measure in school performance analysis.
- Growth Rate by Region: Monitors progress through academic growth tracking dashboards.
These KPIs ensure institutions maintain transparency and excellence in student success monitoring.
Frequently Asked Questions
1. Who uses the Academic Engagement and Performance Dashboard?
Administrators, academic planners, and policymakers use this education engagement dashboard to track progress and enhance student performance.
2. What are the top metrics in this Academic Engagement and Performance Dashboard ?
Core metrics include student engagement analytics, education retention metrics, and academic growth tracking.
3. How does it improve student success?
By offering real-time school performance analysis and actionable insights that guide better academic strategy and student success monitoring.