
What is a Primary Schools IT & Digital Operations Dashboard
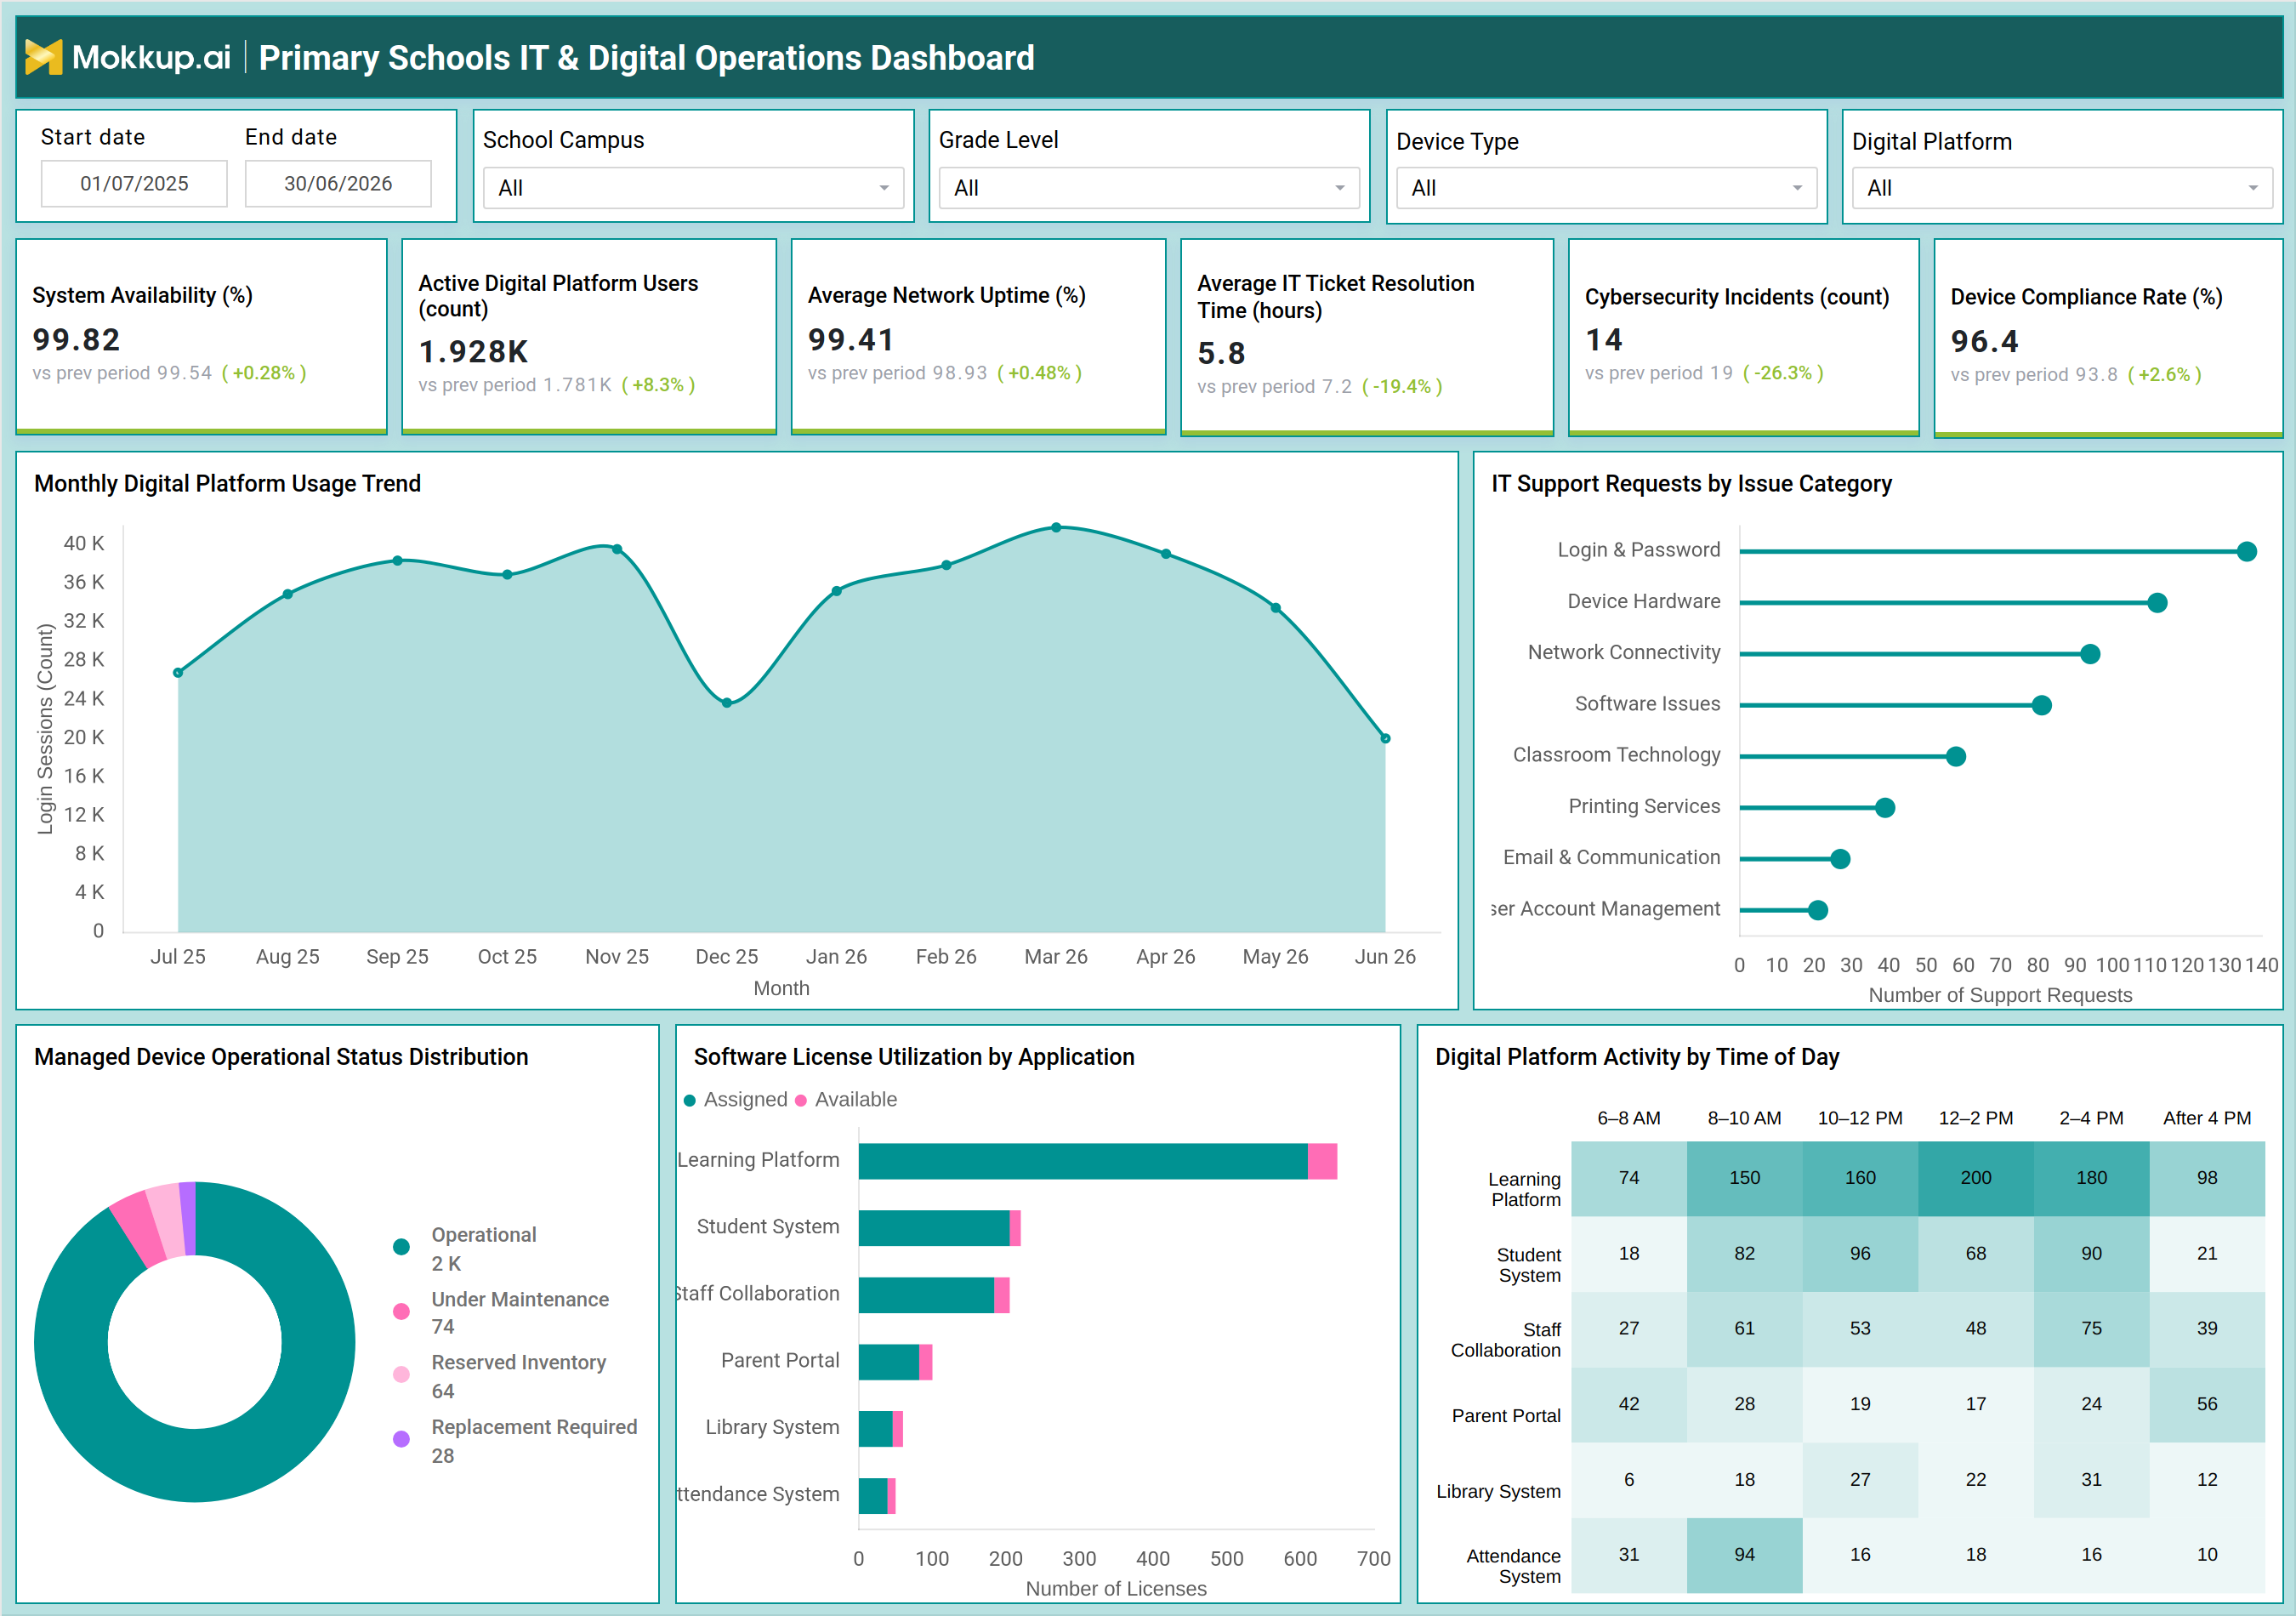
The Primary Schools IT & Digital Operations Dashboard gives school IT administrators, network managers, and technology coordinators a single view of infrastructure health across campuses. Built as a primary school IT operations dashboard, it consolidates system availability, network stability, and device status so technology teams no longer need to check multiple tools separately. School network uptime monitoring sits at the center of the view, giving IT leaders confidence that classrooms, staff, and parents can rely on digital platforms without interruption. The dashboard also surfaces education cybersecurity incident monitoring alongside ticket resolution speed, helping technology teams balance daily support demands with long-term security posture. Whether reviewing a single campus or comparing performance across an entire district, this dashboard template turns scattered IT logs into one structured operational view for school digital platform usage tracking.
How to Create a Primary Schools IT & Digital Operations Dashboard
You don't need to build your report from scratch; just start with a ready-to-use dashboard template from Mokkup. Add in your data and export it however you like. Here's how to do it:
1. Create or Log in to Your Mokkup Account
Start by signing up on Mokkup.ai using your email. If you already have an account, just log in, and you'll be good to go.
2. Choose and Customize Your Dashboard Template
Find the Primary Schools IT & Digital Operations Dashboard template in the Templates section. Use the drag-and-drop editor to adjust KPIs, edit filters, or add elements based on your data.
3. Export to Your BI Tool
Once your dashboard wireframe is ready, use the BI Tool Export feature to send it directly to Power BI or Tableau for further analysis and enhancements. You can also download the dashboard as a PDF, PNG, or JPEG, embed it on a platform, or invite your team to collaborate.
Note: This is a Pro template. You'll need a Pro subscription on Mokkup to use and customize this dashboard wireframe. Upgrade anytime to unlock full access.
Primary Schools IT & Digital Operations Dashboard Example
A school IT director opens this dashboard each morning to understand whether campus technology is running smoothly before the school day begins. Rather than checking separate systems for network status, support tickets, and device health, the dashboard brings every signal into one place, letting the team immediately spot whether any campus needs attention. From there, the team can identify which support issue categories are driving the most tickets and decide whether a targeted fix, additional training, or a policy change is needed. With school IT ticket resolution tracking built into the workflow, coordinators can flag campuses where response times are slipping before they affect classrooms.
Reviewing managed device status supports ongoing K-12 device compliance tracking, allowing the team to plan maintenance and replacement cycles before aging hardware causes disruptions, while comparing software license usage across platforms helps determine where to renew, reduce, or reallocate seats. Ultimately, the dashboard helps school IT teams move from reactive firefighting to proactive planning. Instead of waiting for a parent or teacher to report an outage, administrators can catch early signs of instability, contain security incidents, and ensure every classroom has reliable access to the digital tools that instruction depends on.
How to Analyze Data in a Primary Schools IT & Digital Operations Dashboard
Here is how you can analyze data from this dashboard:
- Compare digital operations: Filter by School Campus and Grade Level to evaluate digital operations performance across schools and classrooms.
- Track trends over time: Adjust the start and end date range to monitor system availability across a term or academic year.
- Analyze device performance: Segment data by Device Type to identify devices generating the most support tickets or compliance issues.
- Monitor platform usage: Use the Digital Platform filter to analyze usage of the learning platform, student information system, or parent portal.
- Review usage trends: Track the Monthly Digital Platform Usage Trend to identify seasonal increases or declines in login activity.
- Identify recurring IT issues: Analyze IT Support Requests by Issue Category to uncover problems that require process improvements.
- Plan device lifecycle: Review the Managed Device Operational Status Distribution to schedule maintenance and replacement proactively.
- Optimize software licensing: Compare Software License Utilization by Application to right-size license purchases and reduce unnecessary costs.
Benefits of a Primary Schools IT & Digital Operations Dashboard
The following are the benefits of using this dashboard:
- Centralize IT operations: Combine network performance, support tickets, and device compliance into a single primary school IT operations dashboard.
- Reduce reporting effort: Consolidate school network uptime monitoring into one centralized operational view.
- Improve device compliance: Track managed device status across every campus to identify compliance gaps.
- Strengthen cybersecurity: Monitor education cybersecurity incidents continuously to improve security readiness.
- Optimize software licensing: Use software license utilization insights to support data-driven license renewal decisions.
- Plan IT resources: Analyze peak digital platform activity to allocate IT staffing more effectively.
- Improve support accountability: Track school IT ticket resolution performance to monitor support team effectiveness.
KPIs to Track in a Primary Schools IT & Digital Operations Dashboard
The following key KPIs can be tracked by using this dashboard:
- System Availability (%) - the percentage of time IT systems and platforms remain accessible to schools, reflecting infrastructure reliability.
- Active Digital Platform Users (count) - the number of students, teachers, and staff actively logged into digital learning and administrative platforms.
- Average Network Uptime (%) - how consistently the school network stays online without outages or disruptions, a core measure for school network uptime monitoring.
- Average IT Ticket Resolution Time (hours) - how quickly IT support teams close out reported technology issues, the basis for school IT ticket resolution tracking.
- Cybersecurity Incidents (count) - the number of security threats or breaches detected across school IT systems, central to education cybersecurity incident monitoring.
- Device Compliance Rate (%) - the share of managed devices meeting required security and configuration standards, a key measure for K-12 device compliance tracking.
Frequently Asked Questions
1. Who should use the Primary Schools IT & Digital Operations Dashboard?
School IT directors, network administrators, and technology coordinators use this dashboard to monitor infrastructure health and support operations. It also helps district technology leaders compare performance across multiple campuses.
2. What data goes into this dashboard?
The dashboard pulls in network uptime logs, IT support ticket records, device inventory status, software license data, and digital platform login activity. Filters for campus, grade level, device type, and platform let teams narrow the view as needed.
3. Can this template be customized for a specific school district?
Yes, the template can be customized in Mokkup's drag-and-drop editor to match a district's campuses, device types, and platforms. Once adjusted, it can be exported to Power BI or Tableau for further analysis.