
What is a Primary Schools Curriculum Management Dashboard
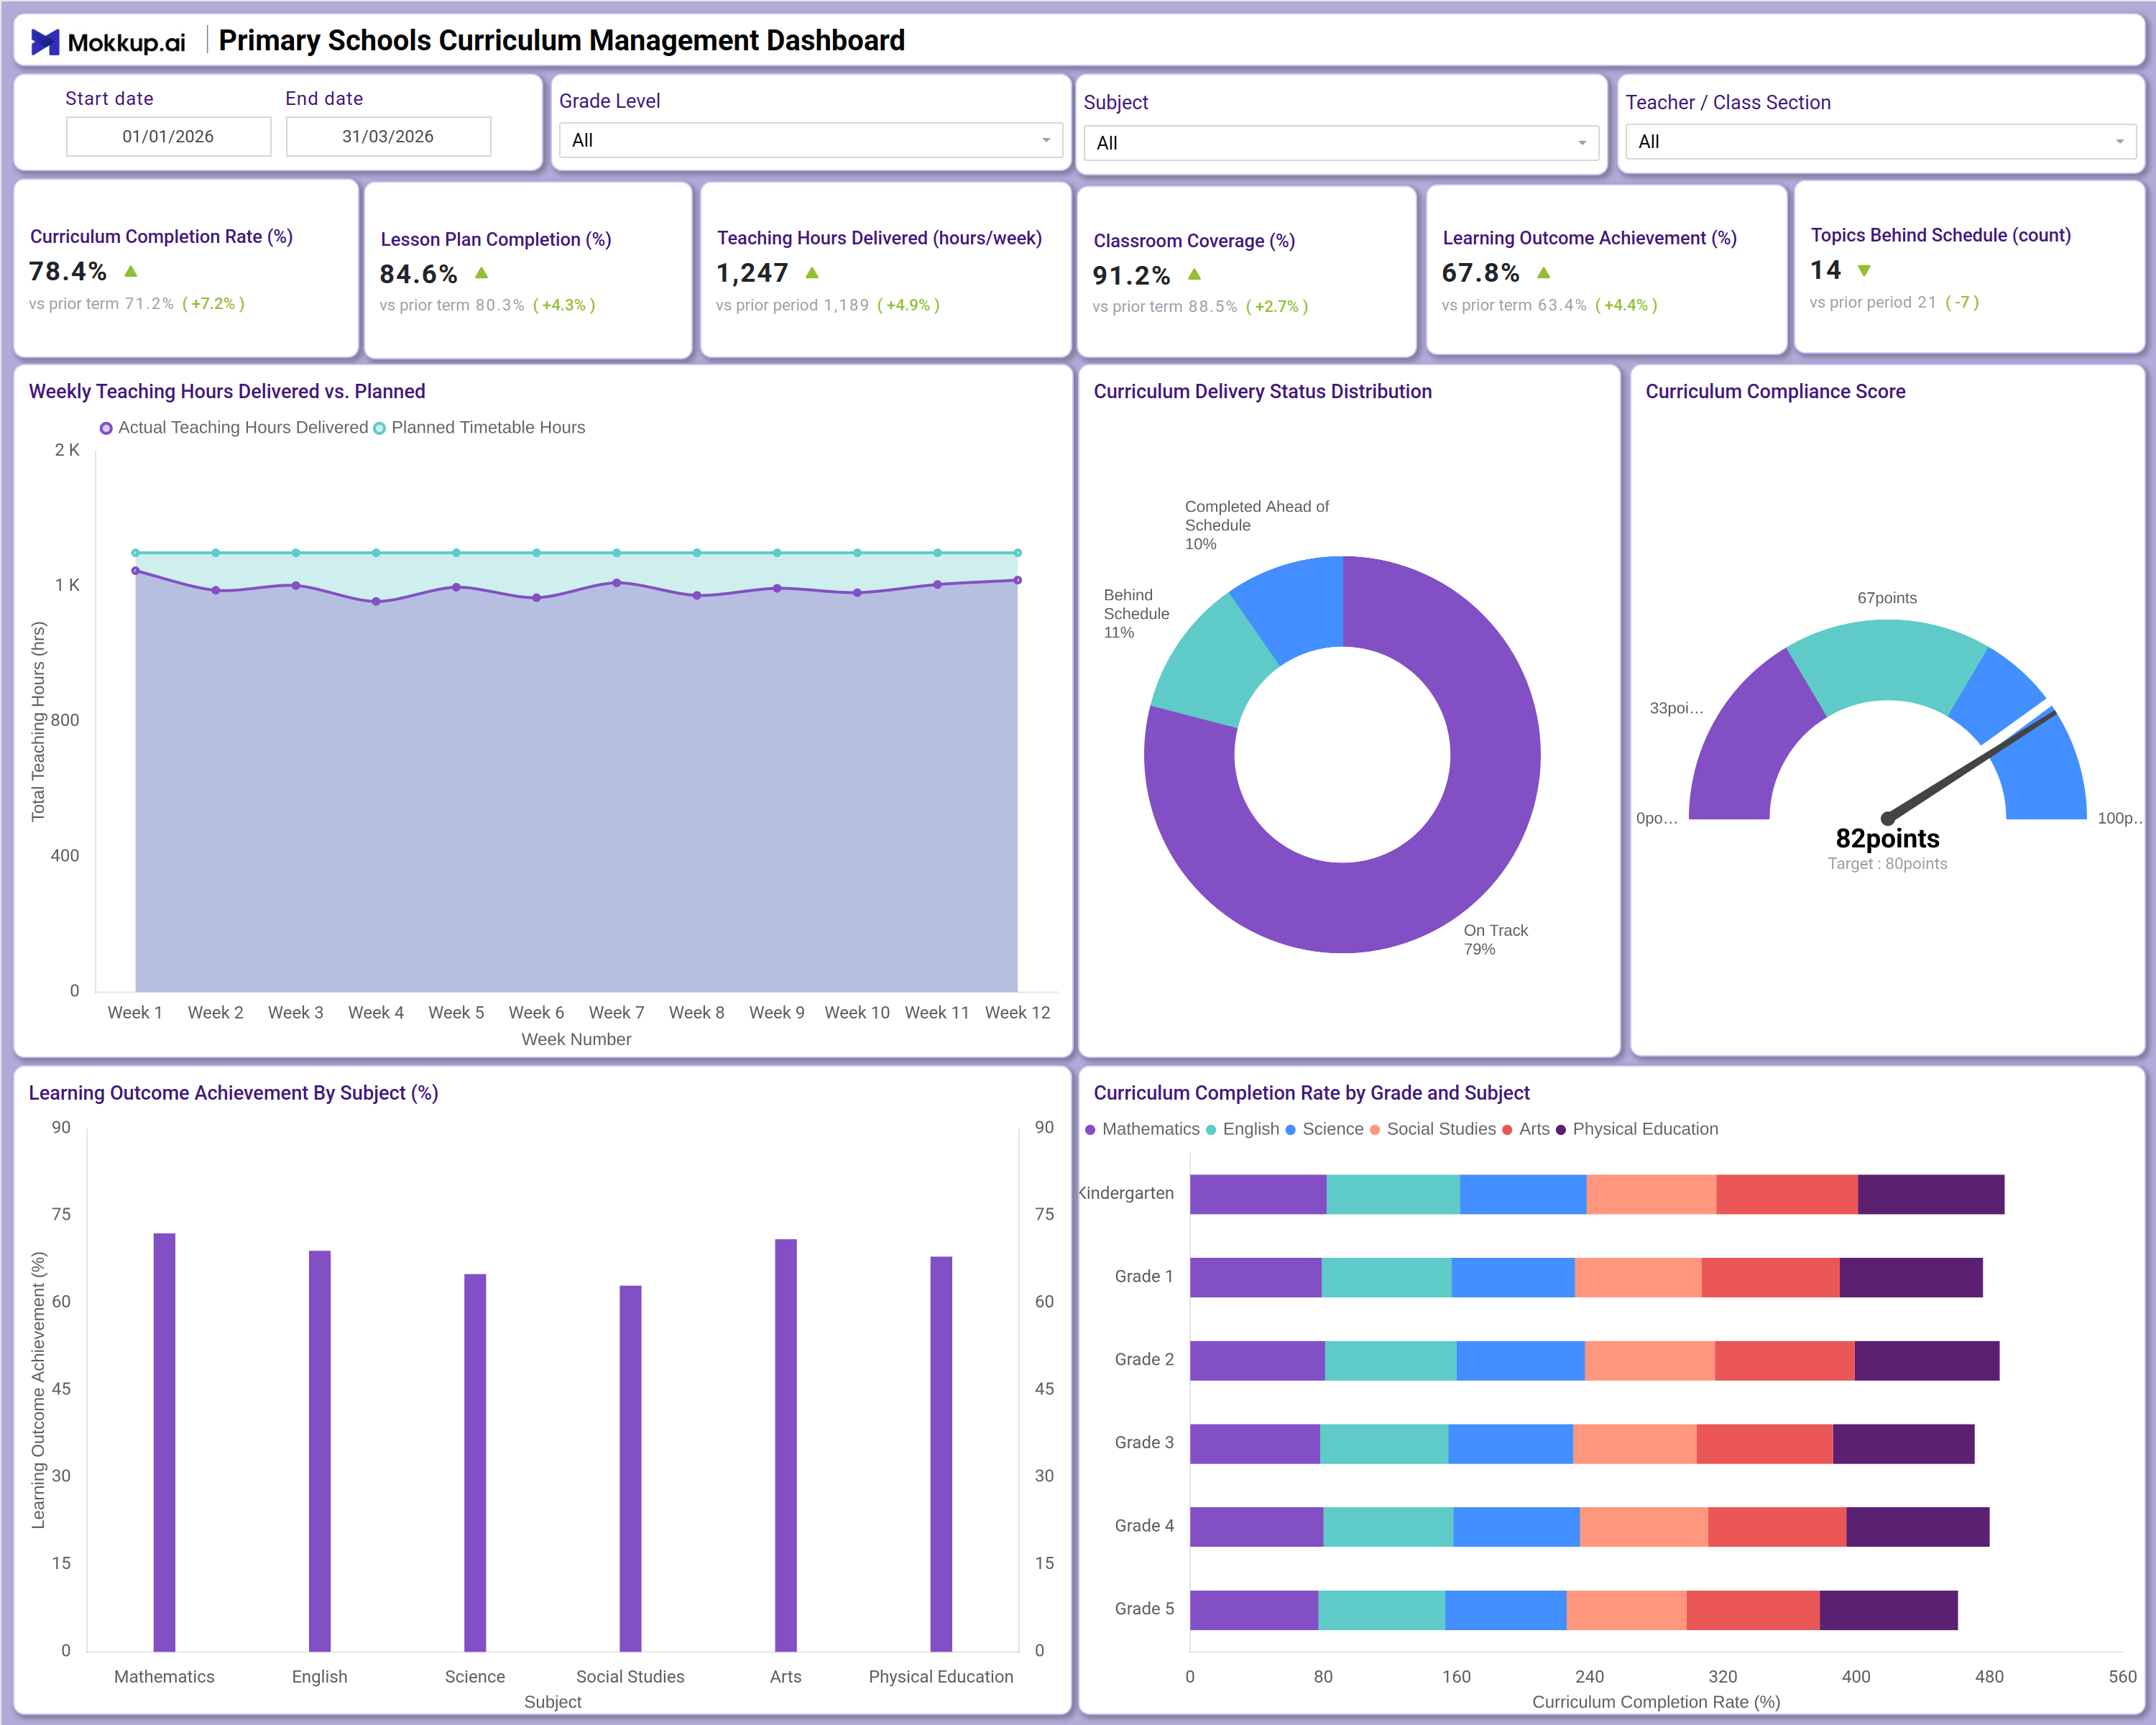
The Primary Schools Curriculum Management Dashboard is a structured reporting tool designed for school administrators, curriculum coordinators, and department heads who need to track instructional delivery across grades and subjects. This primary schools curriculum management dashboard consolidates six core performance indicators, including Curriculum Completion Rate, Lesson Plan Completion, Teaching Hours Delivered, Classroom Coverage, Learning Outcome Achievement, and Topics Behind Schedule into a single view. It supports data-driven decisions by surfacing which grades or subjects are falling behind and which are progressing ahead of schedule. With filters for date range, grade level, subject, and teacher or class section, the dashboard gives curriculum teams a focused view of school-wide instructional performance and curriculum compliance tracking.
How to Create a Primary Schools Curriculum Management Dashboard
You don't need to build your report from scratch; just start with a ready-to-use dashboard template from Mokkup. Add in your data and export it however you like. Here's how to do it:
1. Create or Log in to Your Mokkup Account
Start by signing up on Mokkup.ai using your email. If you already have an account, just log in, and you'll be good to go.
2. Choose and Customize Your Dashboard Template
Find the Primary Schools Curriculum Management Dashboard template in the Templates section. Use the drag-and-drop editor to adjust KPIs, edit filters, or add elements based on your data.
3. Export to Your BI Tool
Once your dashboard wireframe is ready, use the BI Tool Export feature to send it directly to Power BI or Tableau for further analysis and enhancements. You can also download the dashboard as a PDF, PNG, or JPEG, embed it on a platform, or invite your team to collaborate.
Note: This is a Pro template. You'll need a Pro subscription on Mokkup to use and customize this dashboard wireframe. Upgrade anytime to unlock full access.
Primary Schools Curriculum Management Dashboard Example
A curriculum coordinator opens this dashboard at the start of a new term to answer one key question: is the school delivering instruction on schedule across all grades and subjects? By applying the Grade Level and Subject filters, they narrow the view to specific cohorts where learning outcome achievement by subject has flagged below expectations — particularly in Science or Social Studies — and immediately identify which class sections are contributing to the shortfall. With the Curriculum Delivery Status Distribution donut chart, the coordinator can see at a glance what proportion of the curriculum is on track, behind schedule, or completed ahead of schedule.
The Curriculum Compliance Score gauge chart reinforces this picture by measuring overall performance against a defined target, giving leadership a single reference point for curriculum compliance tracking across the school. These two visuals together help prioritize where intervention is needed most. The Weekly Teaching Hours Delivered vs. Planned line chart lets the team compare actual instruction time against the planned timetable week by week, flagging any sustained gaps that warrant teacher or resource adjustments.
Meanwhile, the Curriculum Completion Rate by Grade and Subject stacked bar chart reveals how each grade is progressing across Mathematics, English, Science, Social Studies, Arts, and Physical Education — making it easy to identify which subject areas consistently underperform across grade levels and align instructional planning accordingly. Overall, this primary schools curriculum management dashboard gives school leadership a structured foundation for lesson plan completion monitoring, teacher accountability reviews, and end-of-term reporting — all from a single, filterable interface.
How to Analyze Data in a Primary Schools Curriculum Management Dashboard
Here is how you can analyze data from this dashboard:
- Use the Grade Level filter to isolate curriculum completion data for a specific grade and compare performance across subjects.
- Apply the Subject filter to focus the dashboard on a single subject area and evaluate teaching hours and learning outcomes in context.
- Use the Teacher / Class Section filter to identify which class sections are contributing to gaps in lesson plan completion monitoring.
- Monitor the Weekly Teaching Hours Delivered vs. Planned chart to detect weeks where actual instruction time falls consistently short of the planned timetable.
- Review the Curriculum Delivery Status Distribution donut chart to assess what share of the curriculum is on track versus behind schedule.
- Check the Curriculum Compliance Score gauge to compare the school's overall compliance score against the defined target threshold.
- Analyze the Learning Outcome Achievement By Subject bar chart to identify which subjects have the lowest learning outcome achievement by subject scores.
- Use the Curriculum Completion Rate by Grade and Subject stacked bar chart to find which grades lag across multiple subjects and prioritize support.
Benefits of a Primary Schools Curriculum Management Dashboard
The following are the benefits of using this dashboard:
- Centralizes Curriculum Completion Rate, Teaching Hours Delivered, and Learning Outcome Achievement across all grades in one template.
- Supports curriculum compliance tracking across multiple subjects and grade levels simultaneously without building separate reports.
- Reduces manual data compilation for end-of-term reporting with pre-built KPI tiles and chart layouts.
- Enables class-section-level analysis of lesson plan completion monitoring to guide targeted teacher support decisions.
- Provides a stacked bar breakdown of curriculum completion by grade and subject for instructional planning.
- Helps curriculum coordinators align instruction across Mathematics, English, Science, Social Studies, Arts, and Physical Education without rebuilding reports from scratch.
- Gives school administrators and department heads a shared view of instructional delivery performance across the full school.
KPIs to Track in a Primary Schools Curriculum Management Dashboard
KPIs (Key Performance Indicators) are measurable values used to evaluate how effectively a school is meeting its curriculum delivery and instructional quality objectives.
- Curriculum Completion Rate (%) - Tracks the percentage of the planned curriculum delivered — central to primary schools curriculum management dashboard reporting and measuring instructional progress.
- Lesson Plan Completion (%) - Measures how consistently teachers are completing lesson plans as scheduled — key to lesson plan completion monitoring and identifying delivery gaps.
- Teaching Hours Delivered (hours/week) - Quantifies actual instruction hours per week against the planned timetable — essential for tracking curriculum compliance tracking across the school term.
- Classroom Coverage (%) - Measures the proportion of classrooms actively covered by scheduled teaching — indicates whether student access to instruction is consistent across sections.
- Learning Outcome Achievement (%) - Evaluates the share of students meeting defined learning outcomes — supporting learning outcome achievement by subject analysis across Mathematics, English, Science, Social Studies, Arts, and Physical Education.
- Topics Behind Schedule (count) - Tracks the number of curriculum topics that have not been delivered on time — a direct indicator of instructional backlog and scheduling risk.
Frequently Asked Questions
1. What industries benefit most from this Primary Schools Curriculum Management Dashboard?
This dashboard is designed for primary and elementary schools, school district administrators, and curriculum development teams. It is also useful for education consultants and academic quality assurance teams conducting term-by-term instructional audits.
2. Can this dashboard track performance across individual subjects like Mathematics and Physical Education?
Yes. The Subject filter and the Learning Outcome Achievement By Subject bar chart allow users to isolate and compare learning outcome achievement by subject across all six subjects visible in the dashboard: Mathematics, English, Science, Social Studies, Arts, and Physical Education.
3. Is this dashboard suitable for end-of-term curriculum compliance reporting?
Yes. The Curriculum Compliance Score gauge, Curriculum Delivery Status Distribution, and KPI tiles for Curriculum Completion Rate and Topics Behind Schedule together support structured curriculum compliance tracking for end-of-term reporting cycles.