
What is a Primary School Teacher Workforce Dashboard
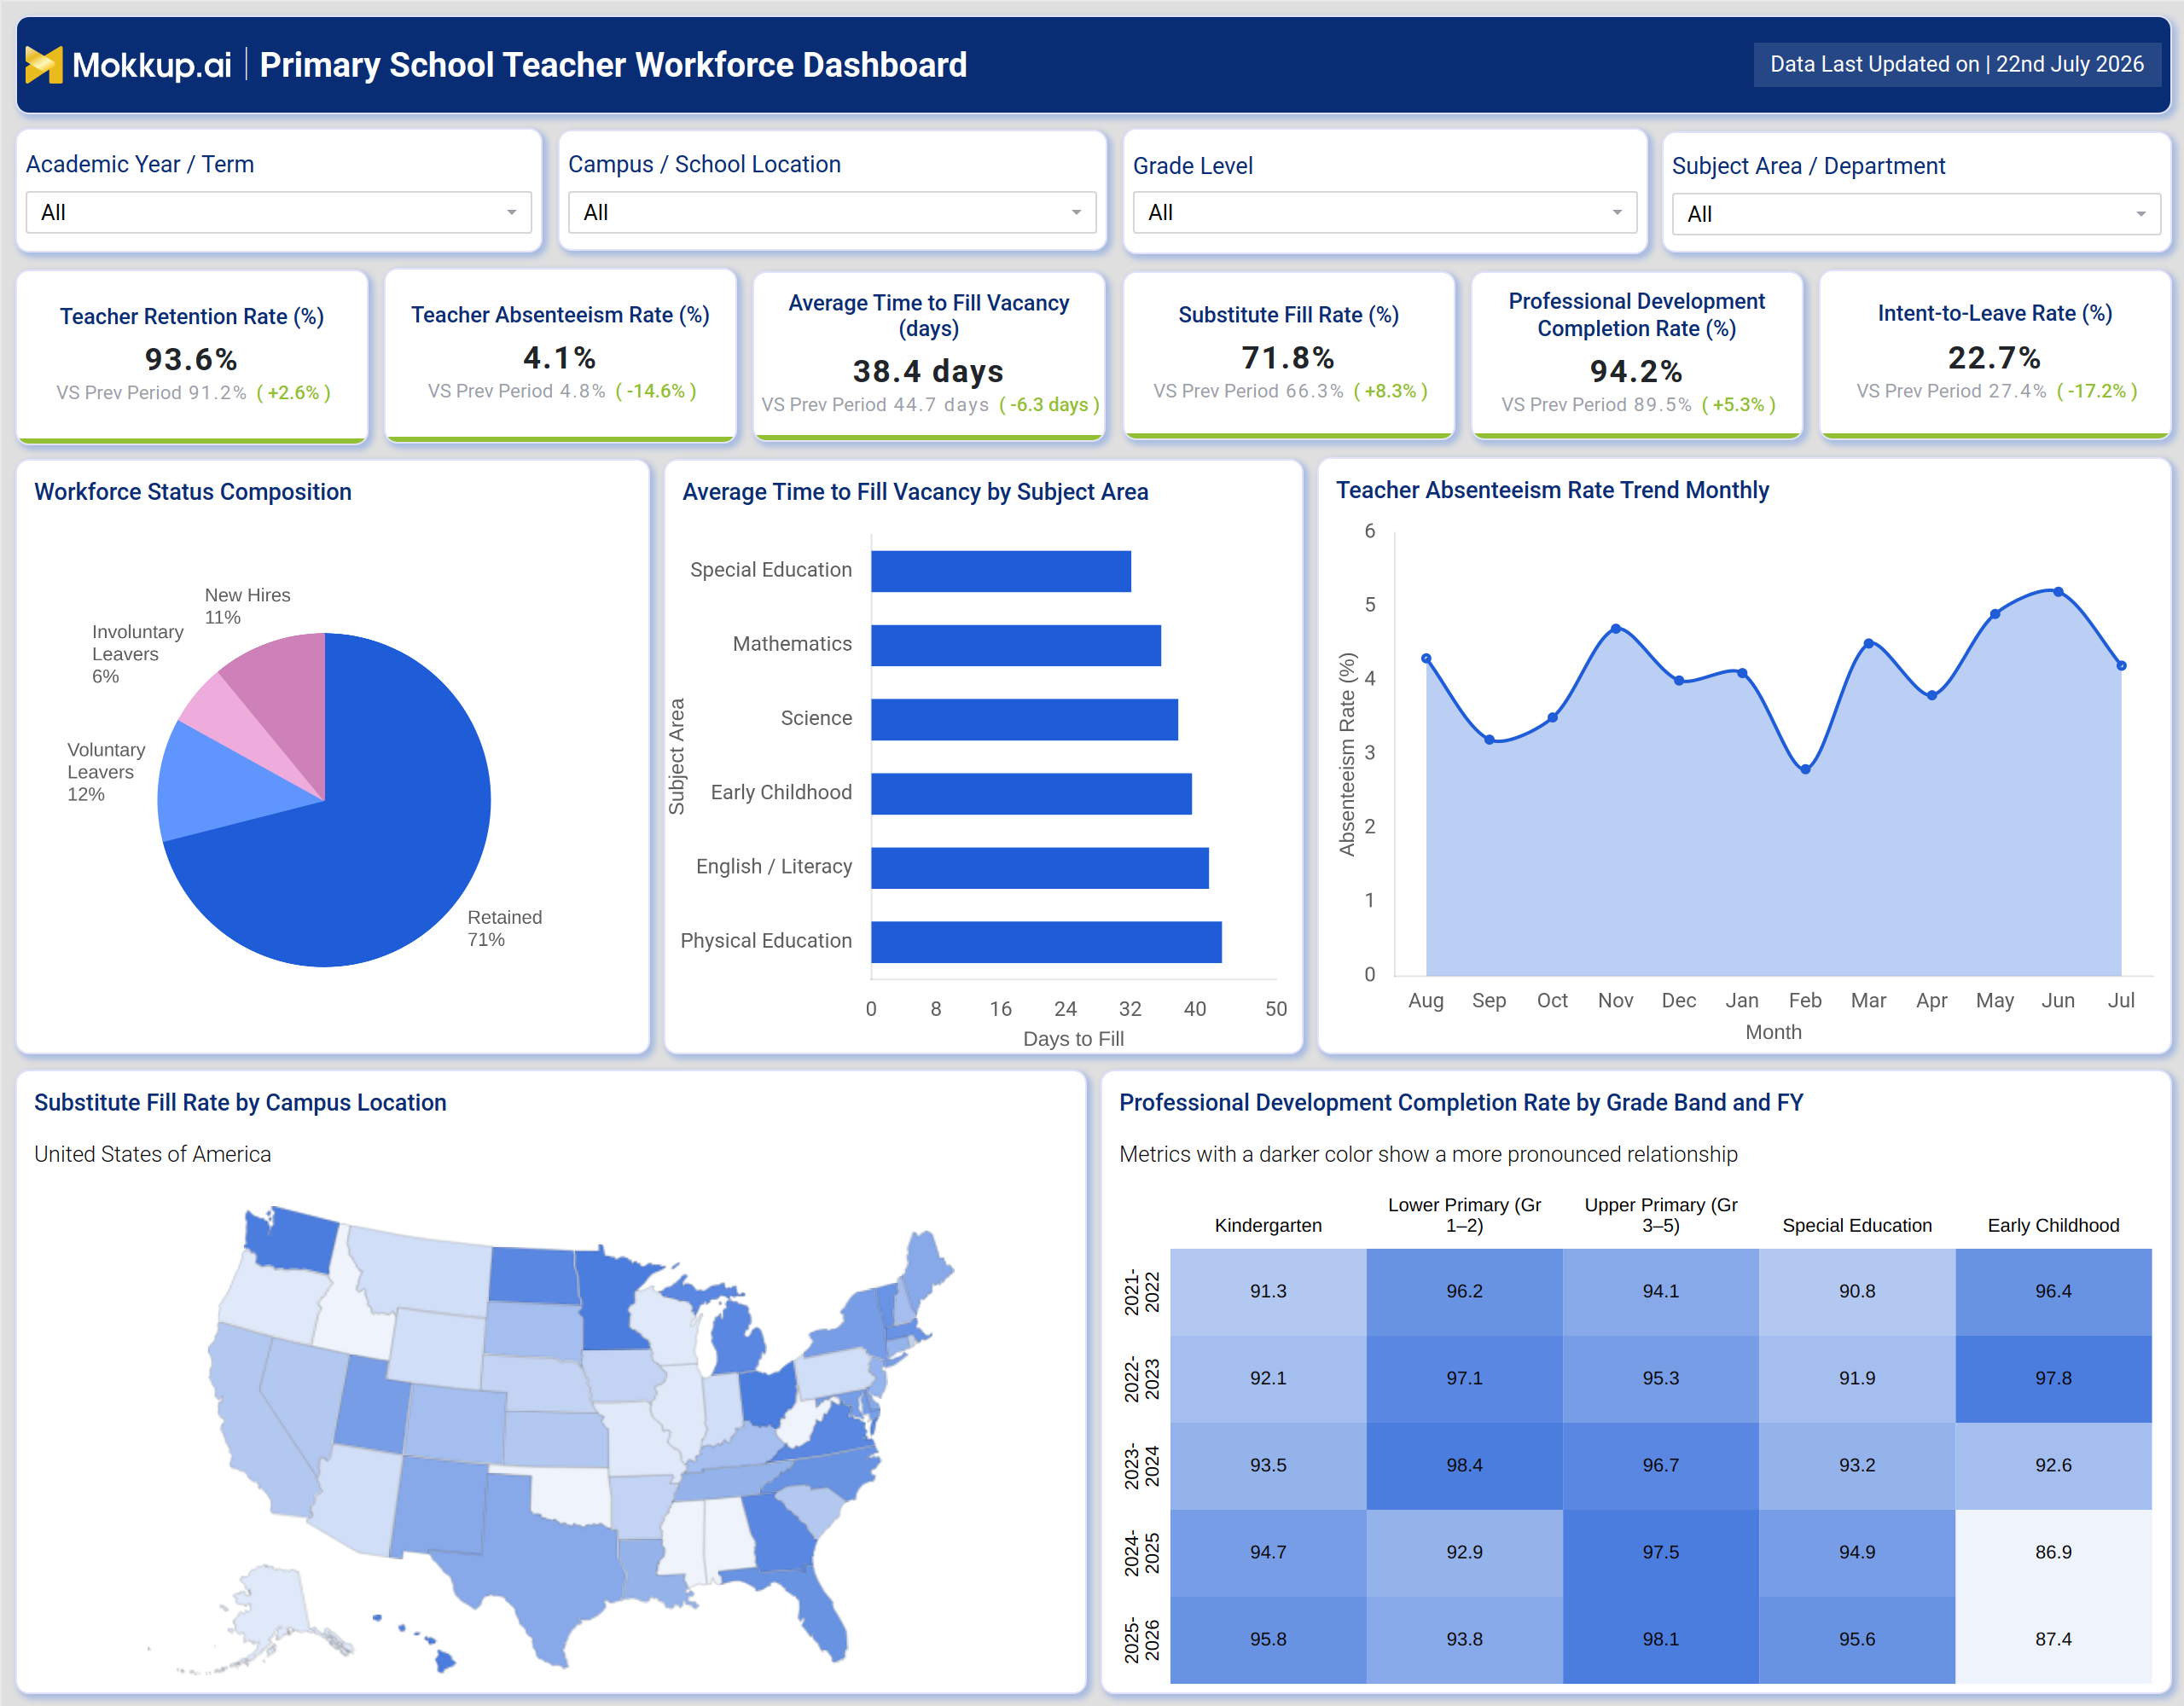
The Primary School Teacher Workforce Dashboard is a single-screen reporting template built for HR leaders and school administrators managing teaching staff across multiple campuses, grade levels, and subject areas. It brings teacher retention, absenteeism, vacancy fill time, substitute coverage, professional development completion, and intent-to-leave signals into one place, filtered by academic year, term, campus, grade level, and subject area or department.
Many HR teams use it as their teacher retention rate tracking tool, replacing separate exports from payroll, recruitment, and campus records with a single reference point that HR and principals can review together. The same view also functions as a teacher intent-to-leave rate tracking for schools tool, since attrition risk signals sit alongside retention and absenteeism data rather than in a separate report. Built specifically for the staffing realities of primary education, a primary school teacher workforce dashboard surfaces subject-specific hiring gaps, seasonal absenteeism swings, and the balance between retaining experienced teachers and onboarding new hires.
How to Create a Primary School Teacher Workforce Dashboard
You don't need to build your report from scratch; just start with a ready-to-use dashboard template from Mokkup. Add in your data and export it however you like. Here's how to do it:
1. Create or Log in to Your Mokkup Account
Start by signing up on Mokkup.ai using your email. If you already have an account, just log in, and you'll be good to go.
2. Choose and Customize Your Dashboard Template
Find the Primary School Teacher Workforce Dashboard template in the Templates section. Use the drag-and-drop editor to adjust KPIs, edit filters, or add elements based on your data.
3. Export to Your BI Tool
Once your dashboard wireframe is ready, use the BI Tool Export feature to send it directly to Power BI or Tableau for further analysis and enhancements. You can also download the dashboard as a PDF, PNG, or JPEG, embed it on a platform, or invite your team to collaborate.
Note: This is a Pro template. You'll need a Pro subscription on Mokkup to use and customize this dashboard wireframe. Upgrade anytime to unlock full access.
Primary School Teacher Workforce Dashboard Example
A school HR director opens the Primary School Teacher Workforce Dashboard at the start of a term to check whether teaching staff levels are stable enough to support the year ahead. Instead of reviewing separate spreadsheets from payroll, recruitment, and campus offices, the director filters by academic year and campus to answer one question: are teachers being retained, and where are the pressure points. From there, the director uses the dashboard as a teacher retention rate tracking tool to see whether staffing stability is holding steady compared to the prior period, and compares how quickly vacancies are being filled across subject areas such as special education, mathematics, or physical education.
If time to fill is stretching in a particular subject, HR can prioritize recruitment there before the gap affects classroom coverage. Reviewing the monthly absenteeism trend alongside substitute fill rate by campus location lets staff identify which locations are leaning most heavily on substitutes and whether that reliance is seasonal or a sign of a deeper coverage issue. Comparing professional development completion across grade bands lets training coordinators prioritize campuses falling behind on certifications, while the workforce status composition view helps leadership separate voluntary departures from involuntary ones and new hires, clarifying whether turnover reflects a retention problem or a planned staffing change.
Altogether, the dashboard helps HR and school leadership move from reactive staffing fixes to a proactive workforce plan, prioritizing recruitment, training, and retention efforts where they matter most before staffing gaps affect students.
How to Analyze Data in a Primary School Teacher Workforce Dashboard
Here is how you can analyze data from this dashboard:
- Compare workforce trends: Filter by academic year and term to evaluate staffing performance across different reporting periods.
- Analyze campus performance: Segment data by campus or school location to identify staffing challenges at specific sites.
- Identify coverage gaps: Break down workforce data by grade level to determine where staffing shortages are concentrated.
- Evaluate hiring by department: Filter by subject area or department to identify recruitment bottlenecks across disciplines.
- Monitor recruitment efficiency: Review the Average Time to Fill Vacancy by Subject Area to prioritize hiring where staffing gaps are greatest.
- Track staff retention: Compare the Teacher Retention Rate with the previous period to assess workforce stability.
- Assess staffing coverage: Cross-reference absenteeism trends with substitute fill rates to evaluate the impact on classroom coverage.
- Analyze workforce composition: Review workforce status to distinguish between voluntary leavers, involuntary leavers, and new hires.
Benefits of a Primary School Teacher Workforce Dashboard
The following are the benefits of using this dashboard:
- Centralize workforce data: Combine teacher retention, absenteeism, and vacancy metrics into a single primary school teacher workforce dashboard.
- Reduce reporting effort: Eliminate manual consolidation of HR reports across multiple campuses and systems.
- Monitor substitute coverage: Track substitute fill rates to identify campuses that rely most heavily on substitute teachers.
- Prioritize recruitment: Use average vacancy fill time by subject area to identify departments with the greatest hiring challenges.
- Track professional development: Monitor training completion rates to identify grade bands that are falling behind on required certifications.
- Identify retention risks: Give leadership visibility into intent-to-leave trends so action can be taken before attrition occurs.
- Standardize workforce reporting: Maintain consistent staffing reporting across academic years, terms, and campuses.
- Improve workforce accountability: Make staffing metrics accessible to both HR teams and school leadership for better decision-making.
KPIs to Track in a Primary School Teacher Workforce Dashboard
The following key KPIs can be tracked by using this dashboard:
- Teacher Retention Rate (%) - the share of teaching staff retained from one period to the next, a core signal of workforce stability.
- Teacher Absenteeism Rate (%) - the percentage of scheduled teaching days lost to absence, tracked monthly to catch seasonal spikes.
- Average Time to Fill Vacancy (days) - how long it takes to fill a teaching position, viewed through average time to fill vacancy by subject area to target recruitment.
- Substitute Fill Rate (%) - the percentage of teacher absences successfully covered by substitute staff, viewed by campus location.
- Professional Development Completion Rate (%) - the share of required training completed by teaching staff; as a professional development completion rate dashboard metric, it is tracked by grade band and fiscal year.
- Intent-to-Leave Rate (%) - the percentage of teaching staff indicating plans to leave, an early warning signal for attrition.
Frequently Asked Questions
1. What does the Primary School Teacher Workforce Dashboard track?
It tracks teacher retention, absenteeism, vacancy fill time, substitute coverage, professional development completion, and intent-to-leave signals, filtered by academic year, campus, grade level, and subject area. These metrics are grouped on a single screen so HR teams do not need to consolidate multiple reports before a staffing review.
2. How does this dashboard support substitute staffing decisions?
As substitute fill rate monitoring for schools, it shows which campuses rely most heavily on substitutes and whether that reliance is trending up or down across the school year. This helps HR teams decide where to expand the substitute pool before coverage gaps affect classrooms.
3. Why track intent-to-leave rate alongside retention data?
Intent-to-leave signals surface attrition risk before an employee resigns, making the dashboard a genuine teacher intent-to-leave rate tracking for schools tool rather than a lagging retention report alone. Reviewing it alongside absenteeism and retention data gives HR a fuller picture of workforce risk.