
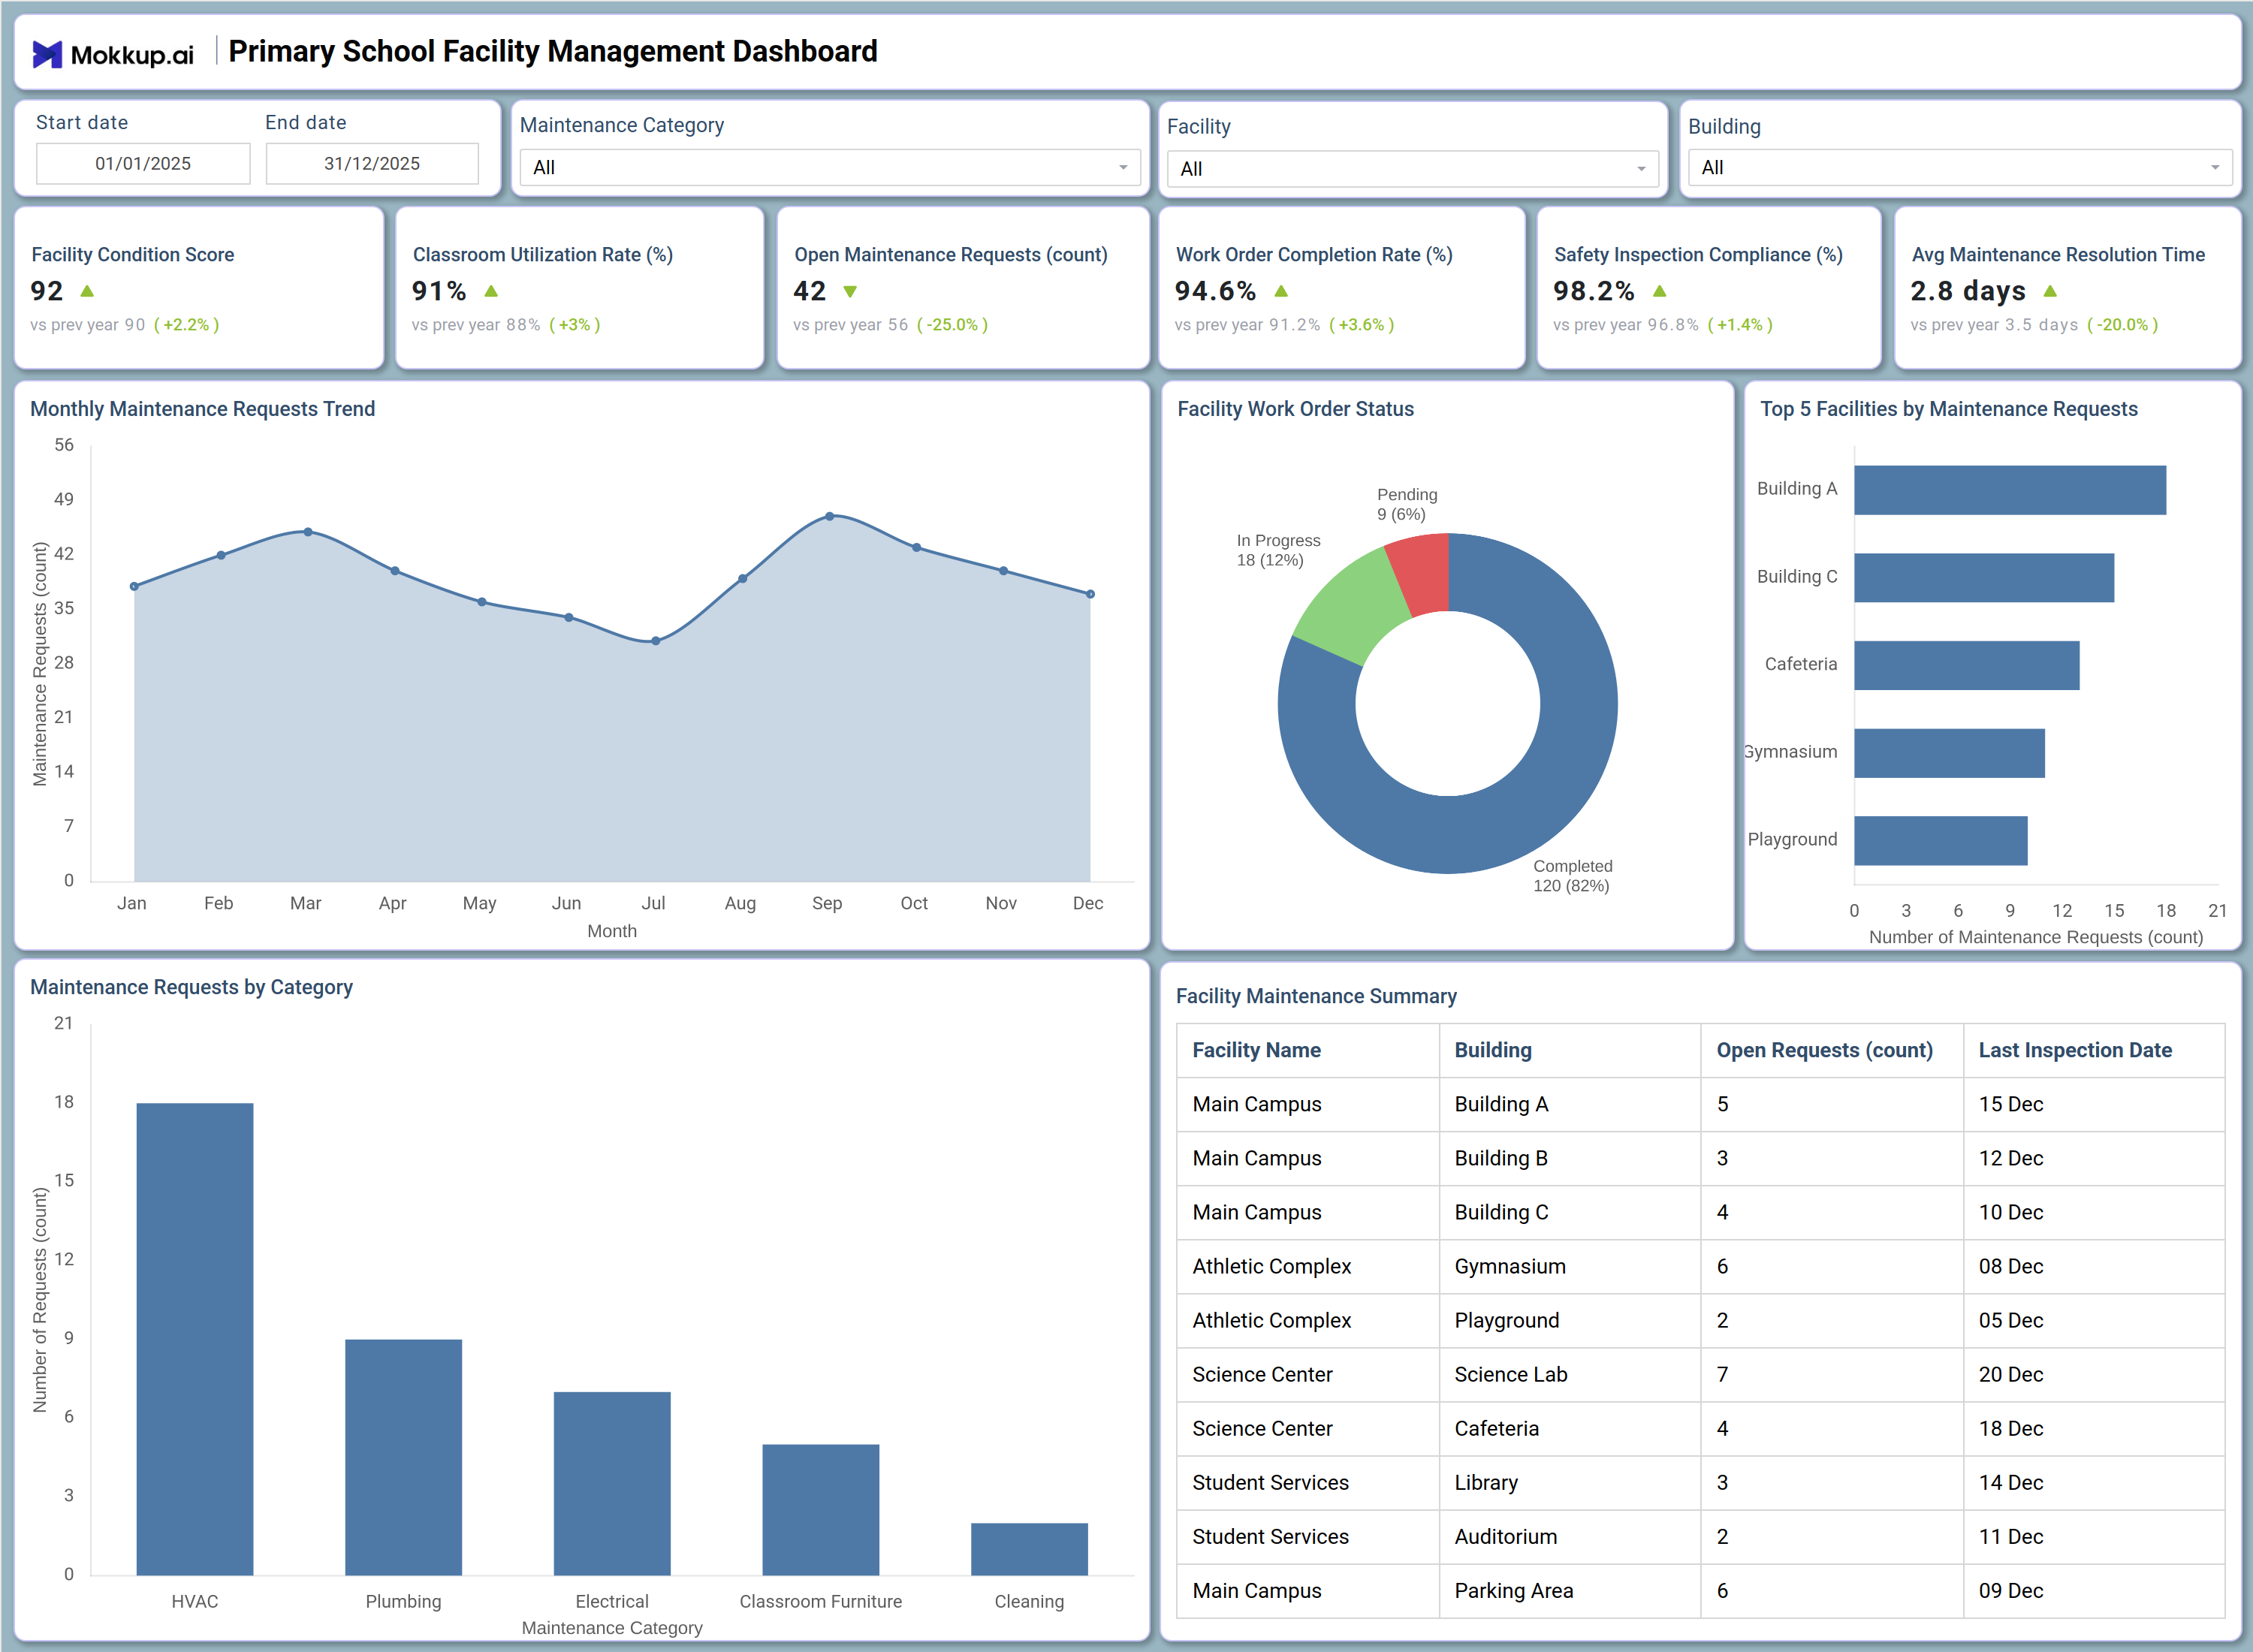
What is a Primary School Facility Management Dashboard?
A primary school facility management dashboard gives facility managers and school administrators a single view of how buildings, classrooms, and shared spaces are being maintained across a campus. This school facility KPI dashboard template consolidates maintenance requests, work order status, and safety inspection results that are otherwise scattered across separate logs and spreadsheets. Facility teams can filter by start date, end date, month, facility, and building to see how performance shifts across a term or across specific campuses without pulling data from multiple sources. Built for elementary and primary school operations, the dashboard connects maintenance backlog, classroom usage, and inspection compliance so that upkeep can be planned with evidence instead of guesswork.
How to Create a Primary School Facility Management Dashboard
You don’t need to build your report from scratch; just start with a ready-to-use dashboard template from Mokkup. Add in your data and export it however you like. Here’s how to do it:
1. Create or Log in to Your Mokkup Account
Start by signing up on Mokkup.ai using your email. If you already have an account, just log in, and you'll be good to go.
2. Choose and Customize Your Dashboard Template
Find the Primary School Facility Management Dashboard template in the Templates section. Use the drag-and-drop editor to adjust KPIs, edit filters, or add elements based on your data.
3. Export to Your BI Tool
Once your dashboard wireframe is ready, use the BI Tool Export feature to send it directly to Power BI or Tableau for further analysis and enhancements. You can also download the dashboard as a PDF, PNG, or JPEG, embed it on a platform, or invite your team to collaborate.
Note: This is a Pro template. You'll need a Pro subscription on Mokkup to use and customize this dashboard wireframe. Upgrade anytime to unlock full access.
Primary School Facility Management Dashboard Example
A facility manager typically opens this primary school facility management dashboard at the start of a term to check whether maintenance activity is under control across every building on campus. Before assigning vendors or approving budget, the manager needs a clear picture of where requests are piling up, which categories of repair are driving the workload, and whether safety inspections are keeping pace. From the main screen, the manager narrows the view using the Facility and Building filters to isolate performance for a single block or campus. They can track how maintenance requests have moved month over month, compare buildings against each other to see which locations generate the most tickets, and break down requests by category to see whether HVAC, plumbing, electrical, or cleaning issues are consuming the most attention.
When work orders start piling up in the pending or in-progress stages, the status breakdown makes it easy to spot and address that backlog before it affects classroom operations. The result is a school facility maintenance request dashboard that turns scattered maintenance logs into a single reference point for planning. Facility managers can prioritize buildings that need urgent attention, maintenance staff can plan vendor schedules around category-level demand, and administrators get a defensible view of facility health heading into budget and inspection cycles.
How to Analyze Data in a Primary School Facility Management Dashboard
Here is how you can analyze data from this dashboard:
- Use the Facility filter within this school facility maintenance request dashboard to isolate activity for one facility before comparing it against campus-wide performance.
- Apply the Building filter to compare performance across Building A, Building B, and other blocks on campus.
- Use the Start date and End date filters to review facility performance within a specific term or reporting period.
- Monitor the Monthly Maintenance Requests Trend to spot seasonal spikes in repair activity across the year.
- Review the Facility Work Order Status donut chart to see how many requests remain pending or in progress against completed work.
- Compare buildings in the Top 5 Facilities by Maintenance Requests chart to flag locations needing extra attention.
- Check the Maintenance Requests by Category chart, a maintenance requests by category dashboard view, to see which trade drives the most tickets.
- Monitor the Classroom Utilization Rate KPI through this classroom utilization rate tracking dashboard to spot underused or overbooked classrooms.
Benefits of a Primary School Facility Management Dashboard
The following are the benefits of using this dashboard:
- Centralizes maintenance requests, work order status, and safety inspections in one school facility condition score dashboard.
- Highlights buildings generating the most repair tickets so budgets and vendor schedules can be prioritized correctly.
- Keeps classroom utilization visible alongside maintenance data instead of tracking it in a separate spreadsheet.
- Surfaces the Facility Maintenance Summary table so administrators see open requests and last inspection date per facility in one place.
- Reduces manual reporting effort with pre-built KPI tiles, charts, and filters ready to use immediately.
- Gives facility managers and administrators a shared view of safety inspection compliance across every building.
- Turns scattered maintenance logs into a single primary school facility management dashboard that teams can reuse every term.
KPIs to Track in a Primary School Facility Management Dashboard
The following key KPIs can be tracked by using this or any school facility KPI dashboard template:
- Facility Condition Score: an overall rating of building and infrastructure health, central to school facility condition score dashboard reporting across campuses.
- Classroom Utilization Rate (%): shows how much available classroom capacity is being used, the basis for this classroom utilization rate tracking dashboard.
- Open Maintenance Requests (count): the number of maintenance tickets still unresolved, indicating current backlog pressure on facility teams.
- Work Order Completion Rate (%): measures how many work orders are closed out relative to those raised, showing how efficiently maintenance staff clear demand.
- Safety Inspection Compliance (%): tracks how consistently facilities pass required safety inspections across buildings.
- Avg Maintenance Resolution Time (days): the average time taken to resolve a maintenance request from submission to close, showing how responsive facility teams are.
Frequently Asked Questions
1. What industries benefit most from this Primary School Facility Management Dashboard?
Primary and elementary schools benefit most, along with facility managers and district operations teams using a primary school facility management dashboard to standardize reporting across campuses. Maintenance supervisors also use it to plan vendor scheduling and safety inspections.
2. Can this dashboard support maintenance requests by category dashboard reporting across multiple buildings?
Yes. The Maintenance Requests by Category chart combined with the Building filter lets staff compare repair volume by trade across every building on campus.
3. How does the Facility Work Order Status donut chart work?
It shows the proportion of work orders that are completed, in progress, or pending within the selected filters. Facility managers use it alongside Open Maintenance Requests to judge how well maintenance demand is being cleared.